![]()
![]()

|
|
|
|
Model
Forcing - Tides, Rivers, Bottom Fresh Water, Winds and Initial
Conditions
| Tides - Tides in the Mid-Atlantic Bight are dominated by the M2 component which represents approximately 85% of the tidal elevation variance along the southern coast of Long Island (Moody, et al., 1984). Inside the Bay at West Islip the M2 tidal component represents about 88% of the variance (Wong, 1986). Based upon these results, other observations of the much attenuated tides inside Great South Bay (Wong, 1982) and the simplicity of determining tidal-mean conditions in the model, the tidal forcing for the model is currently limited to the M2 component. The M2 tidal amplitudes and phases at the boundary of the model domain is provided by an ADCIRC model for the entire New York Bight. |
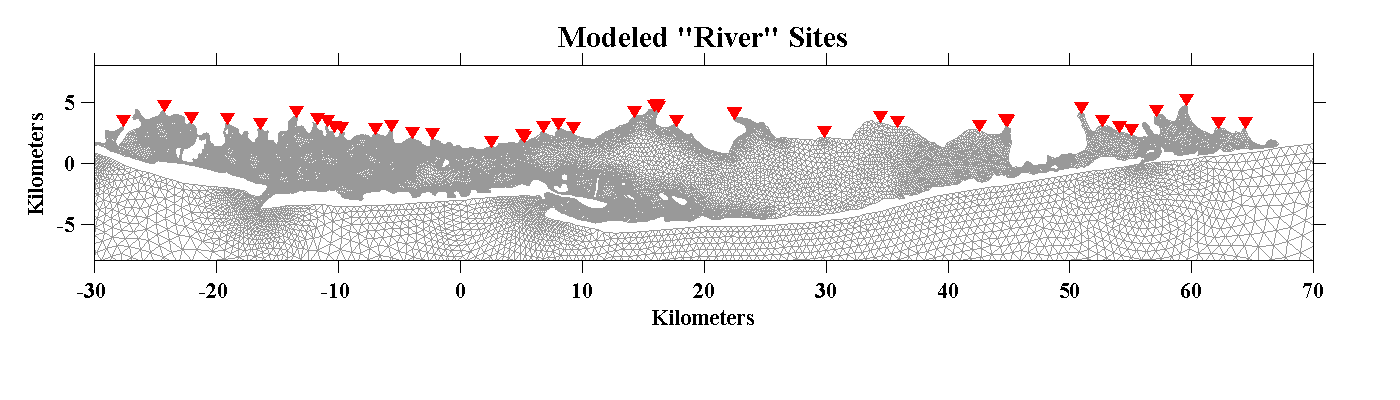
| Rivers - There are two major rivers, Carmens and Connetquot, and innumerable smaller rivers and creeks that flow into the Great South Bay. The USGS (http:nwis.waterdata.usgs.gov/usa/nwis/discharge) maintains daily streamflow guages at approximately 18 locations throughout the Bay from which we have estimated a mean flow rate of approximately 6.2 m3/sec. These stations do not cover all the likely freshwater discharge sites along the northshore of the Bay. We subjectively estimated that another 1.0 m3/sec enter the Bay through these sites for a total of about 7.2 m3/sec on average. This is the number we have been using in our model runs but it must be acknowledged that much more than this can be dumped into the Bay right after a storm event. The locations for the freshwater inflow has been divided (not evenly) among 43 nodal points along the north shore of Great South and Moriches Bays as indicated in the figure below. The salinities of the water flowing into the Bays were set to zero while the temperatures were held fixed at the climatological means. |
 |
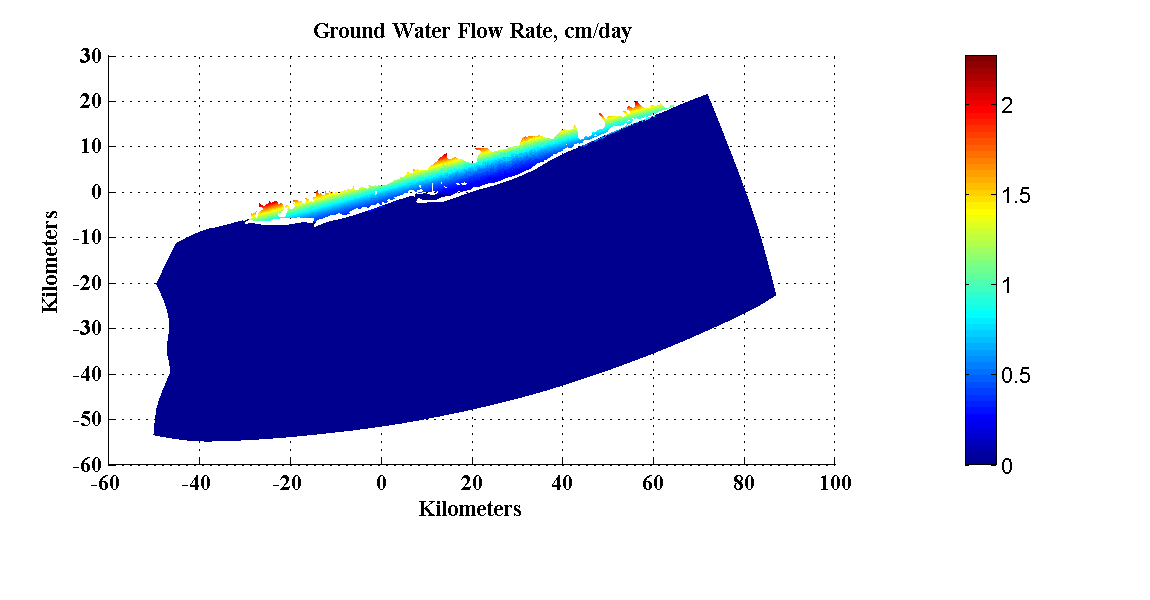
| Bottom Fresh
Water - There is plenty of evidence for groundwater discharge into coastal lagoons (refs) but quantifying the amount and precisely where the discharge enters the lagoons is extremely difficult. Anywhere from 20 to 80 percent of the fresh water that enters coastal lagoons along the U.S. eastern seaboard is thought to enter through ground water discharge (refs). Lacking any clear evidence for specifying the groundwater discharge into the Great South Bay, we have taken an ad hoc approach and assumed that the groundwater flowing into the Bays equals that of the estimated surface water discharge through the rivers and creeks, or another 7.2 m3/sec. Assuming that we are faced with specifying exactly where this discharge occurs. Here we have made the assumption that the flow rate decreases exponentiallt away from the north shore of the Bays. The figure below shows the bottom fresh water discharge rate in units of cm/day. In FVCOM bottom fresh water is treated as a flux of salt out of the lower sigma layer rather than as a flux of zero salinity water into the region. This methodlogy has minimal effect on the salt balance of the model while the impact of the additional water volume is assumed small. |
 |
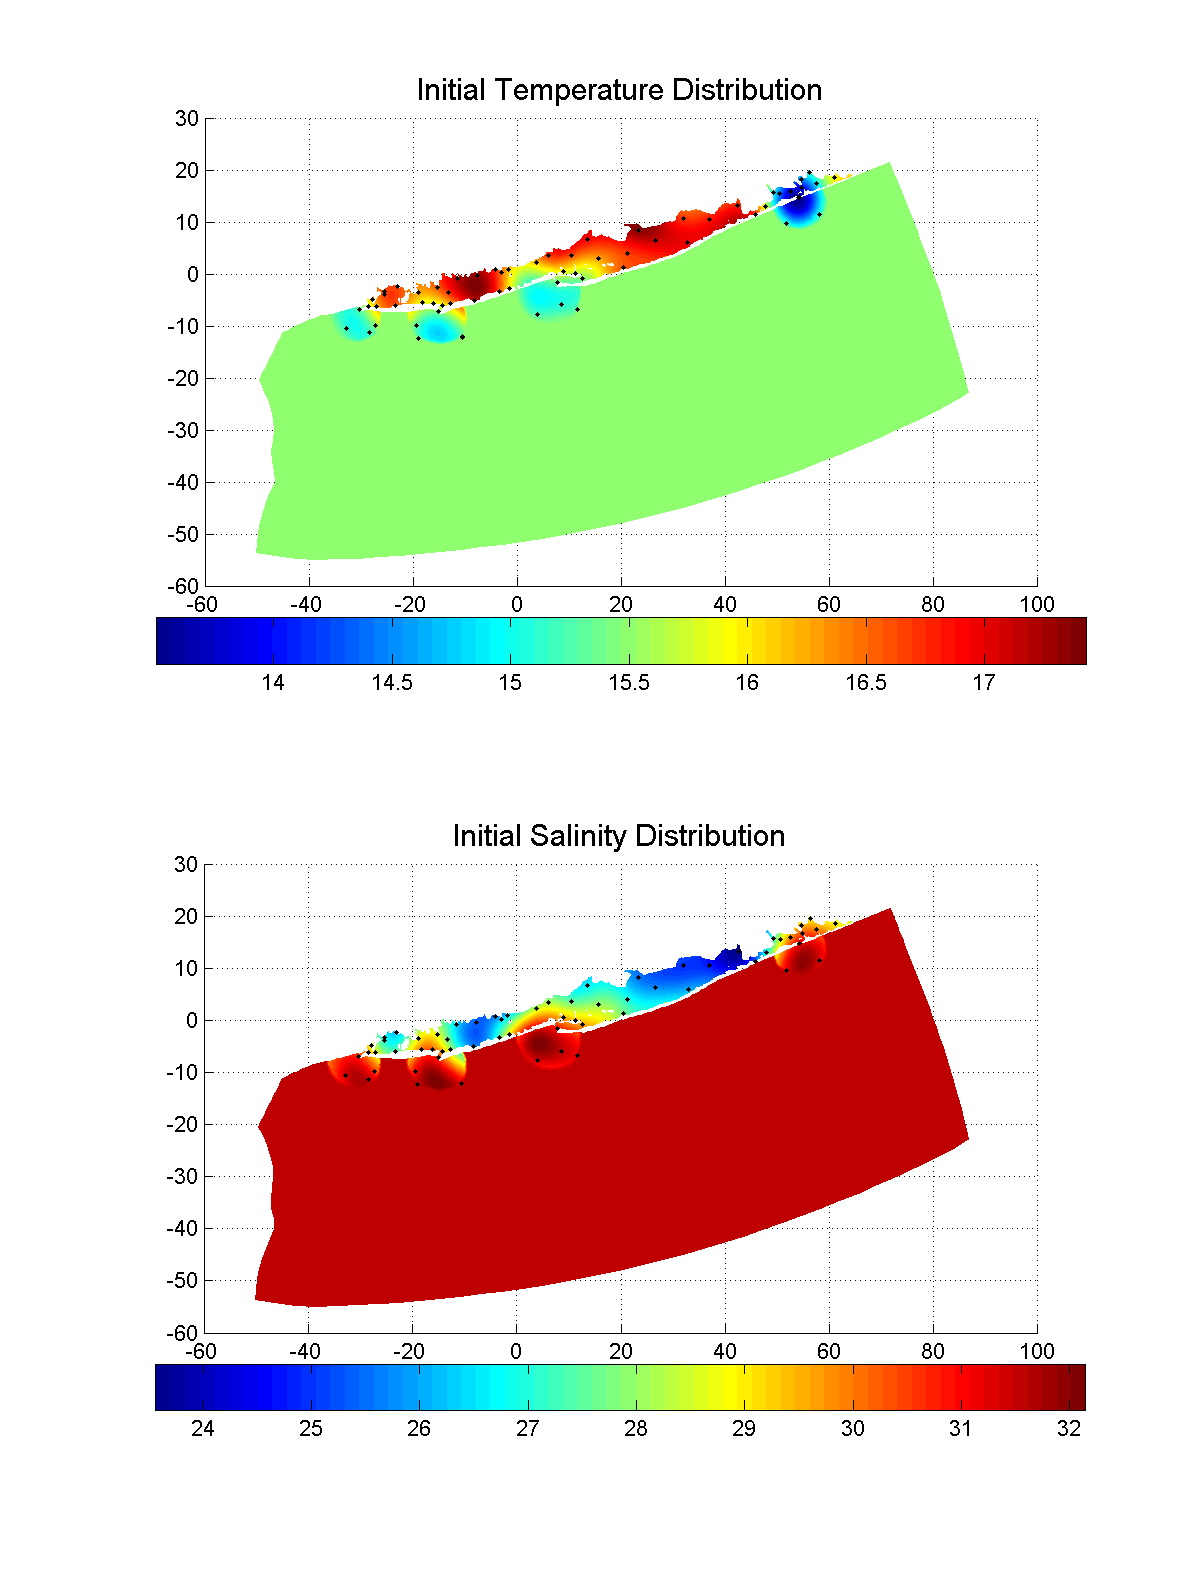
| Initial
Conditions - All the model runs started with the waters at rest. Initial temperatures and salinities were derived from the Suffolk County DEC observations at 21 stations in the Great South Bay and Moriches Bay (courtesy of Robert Nuzzi). The data for these stations were simply averaged to produce what was assumed to be climatological mean conditions even though the sampling was not uniform throughout the years or seasons. We do not have similar observations from Nassau County and so estimates of initial there were subjectively extrapolated from the Suffolk County data. In the offshore region outside the inlets the salinity and temperature were assumed uniform and set to 15.5oC and 31.5psu approximating the mean climatological conditions just outside Fire Island Inlet which was the only coastal location with long-term observations. |
 |

