![]()
![]()

![]()


This page has been moved. If you are not redirected, click here to go to the Great South Bay Project homepage.
|
|
|
|
|
|
|
|
Charles N. Flagg E-mail: Charles.Flagg@stonybrook.edu
E-mail: Lucas.Merlo@stonybrook.edu Maggie Lang E-mail: Lang.Ming@stonybrook.edu School of Marine and Atmospheric Sciences Stony Brook University Stony Brook, NY 11794-5000 |
The Great South Bay Project
|
Introduction
The goal of
the Great South Bay program is to gain a thorough understanding
of the biogeochemistry of the Bay and its effect on pelagic and
benthic communities. Currently this effort is supported by
the NY Department of State in which observations and models are
combined in support of the development of an ecosystem based
management approach to address the ecological problems besetting
the Bay. This webpage shows some of the hydrodynamic model
results to date and presents physical observational data
collected over the past several years. Currently,
the hydrodynamic model is undergoing a major upgrade so as to
deal more effectively with the complex topography of the western
portions of the Bay. The model results presented below
deal with one aspect of the Bay, that is the potential impact of
a large breach in Fire Island. The model is also being
used to study the impact of tides and winds on the distribution
and dispersal of passive tracers and plankton. This
page also presents much of the observational data from
temperature and salinity sensors that have been deployed around
the eastern portion of the Bay since 2004. Since 2010 some
of these instruments have been enhanced to measure sea level,
chlorophyll and turbidity. And since the middle of 2010
real-time data from the Smith Point bridge and a telemetering
buoy south of Sayville have also become available. All the
observational data are available below.
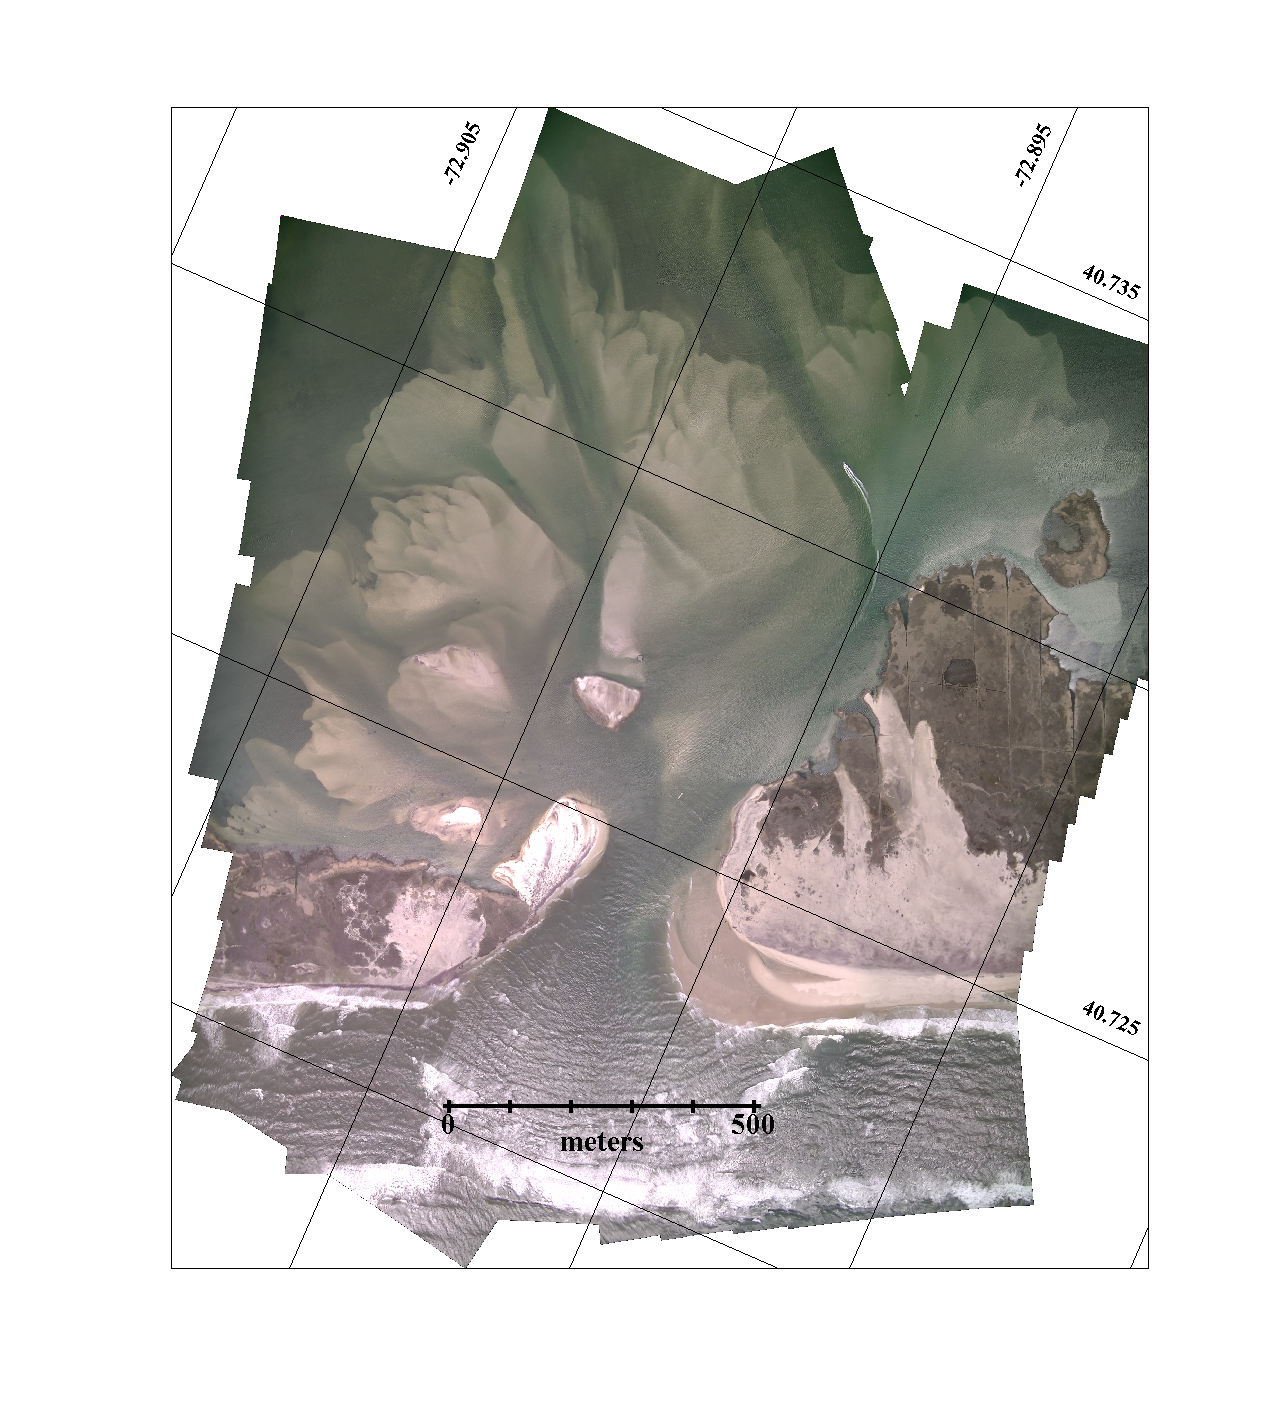
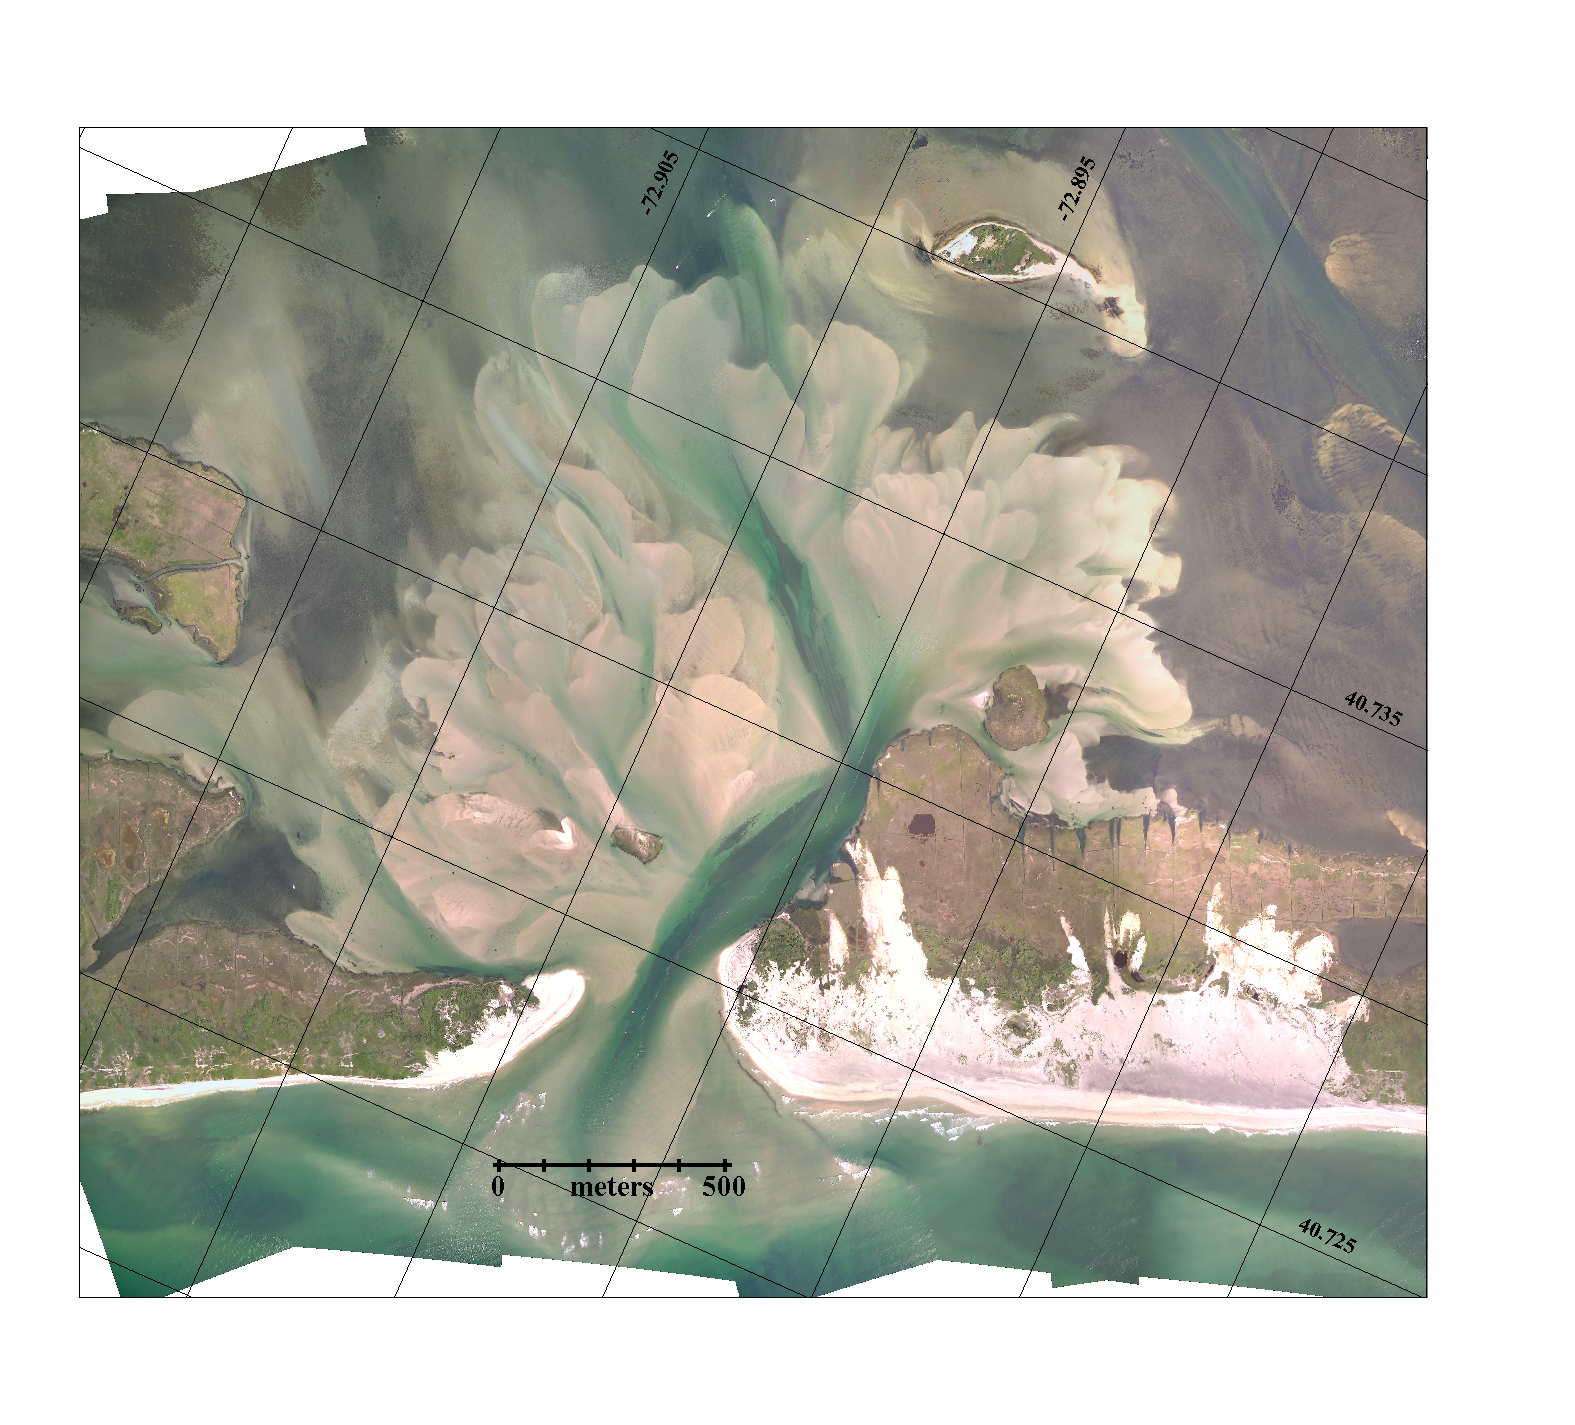
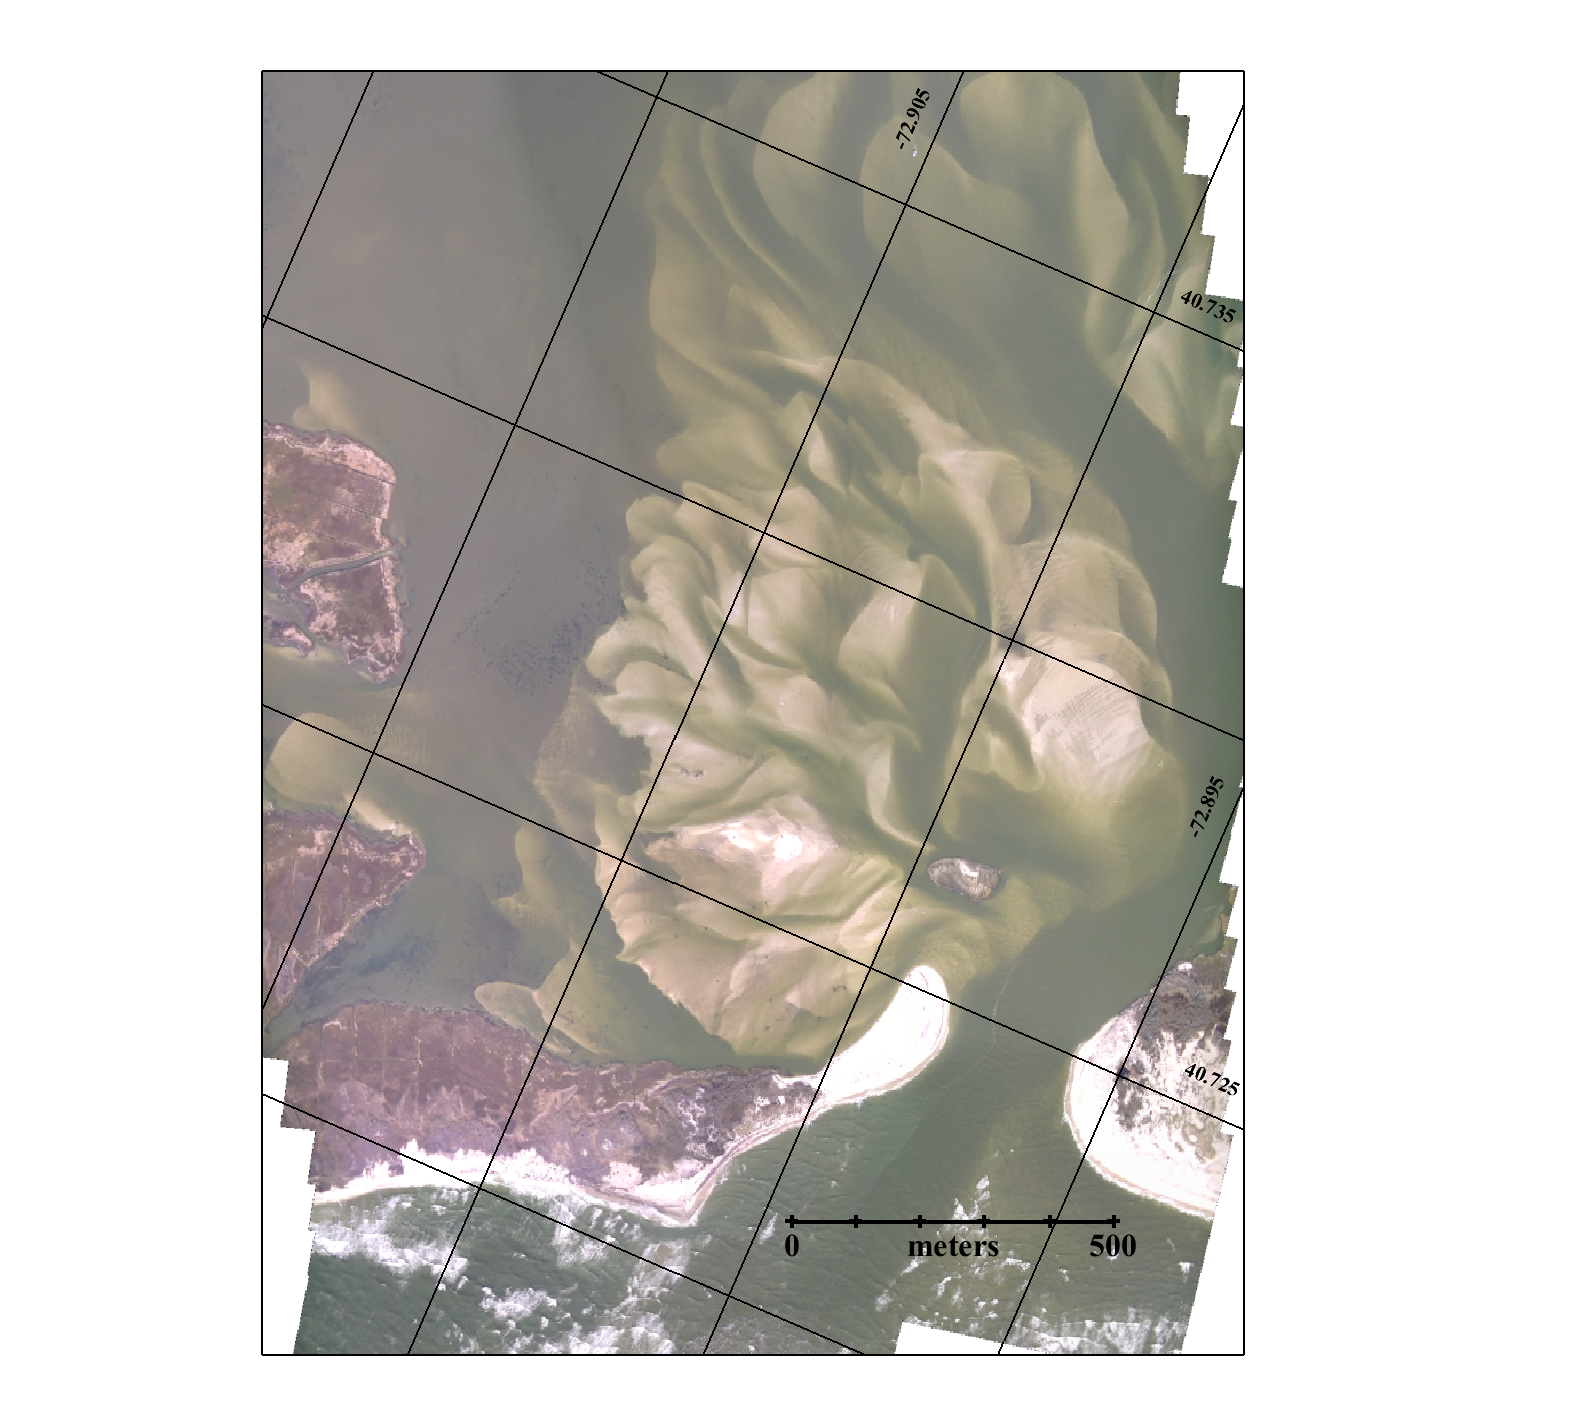
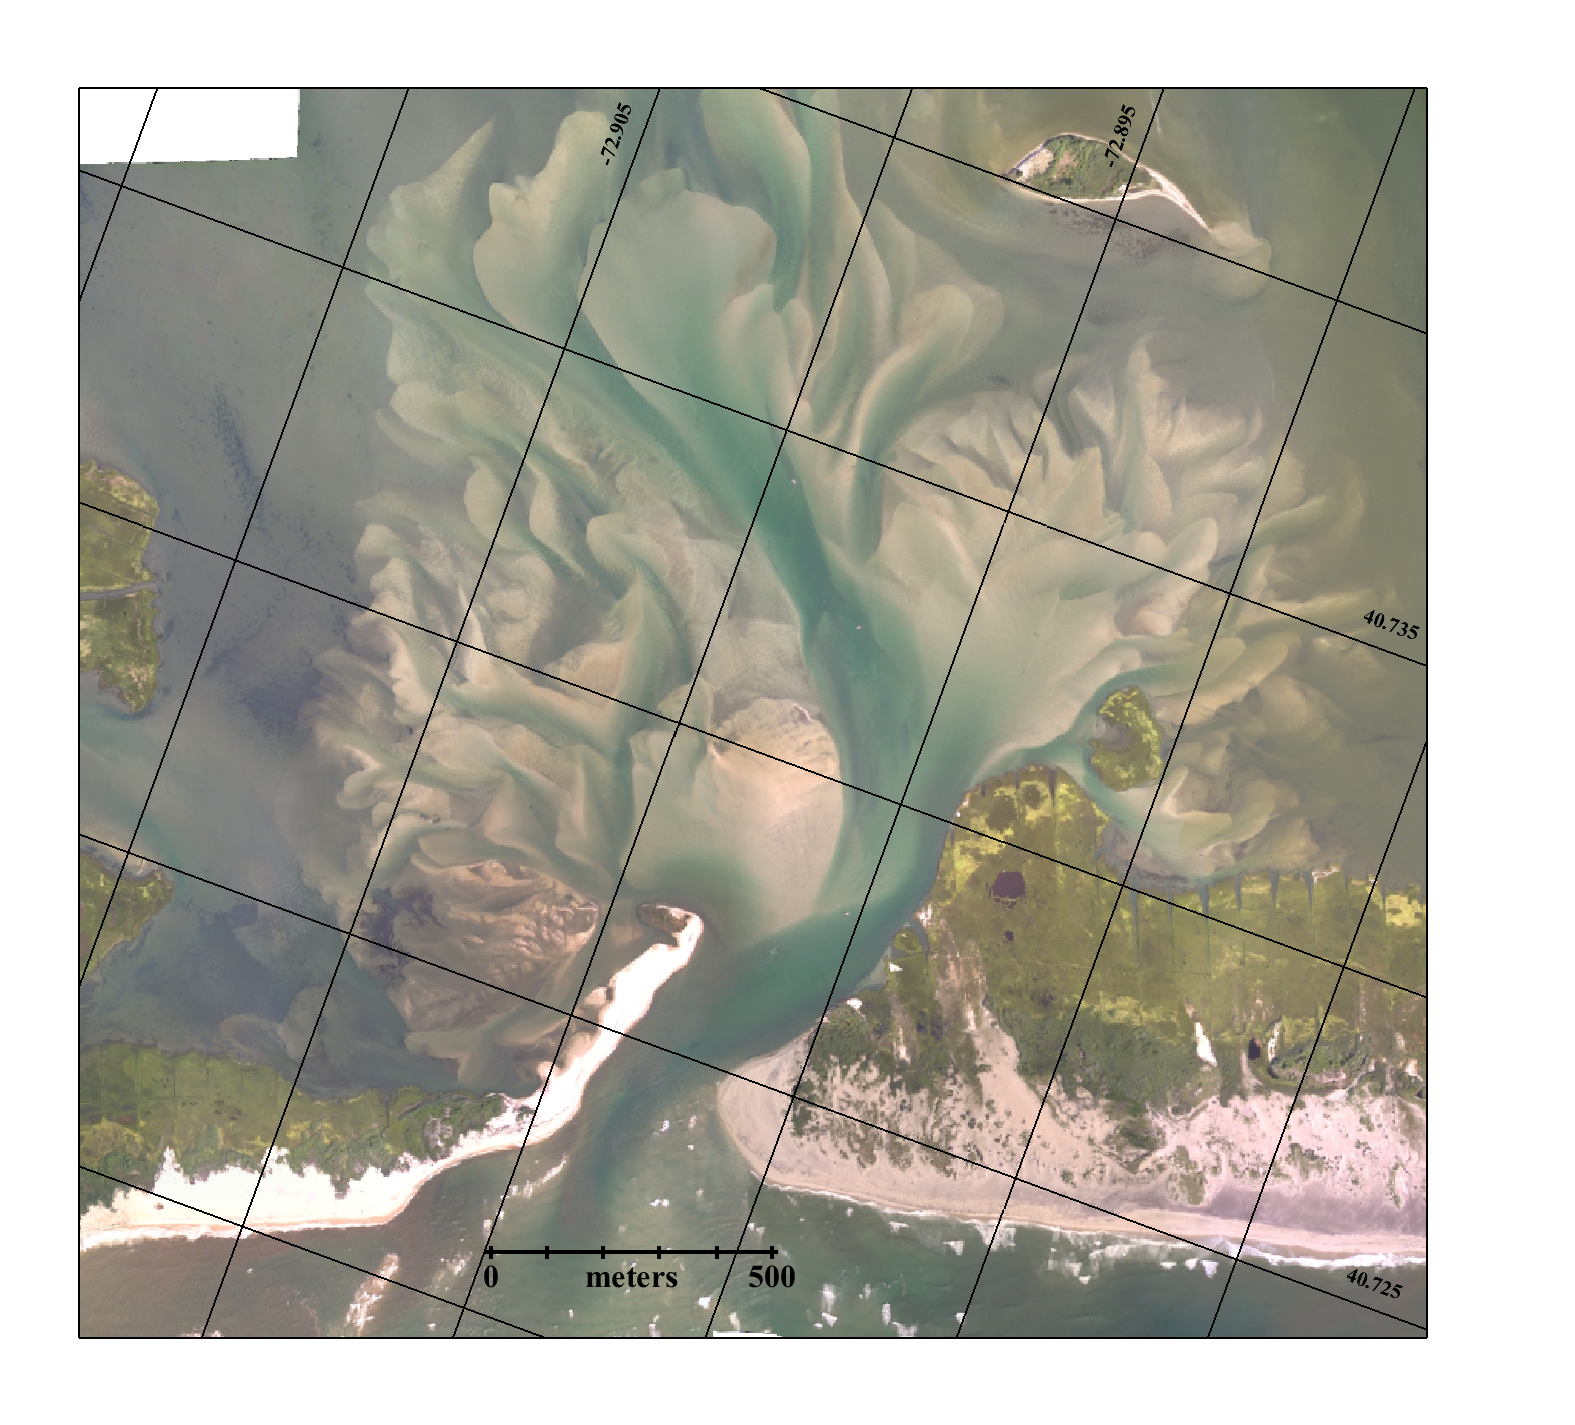
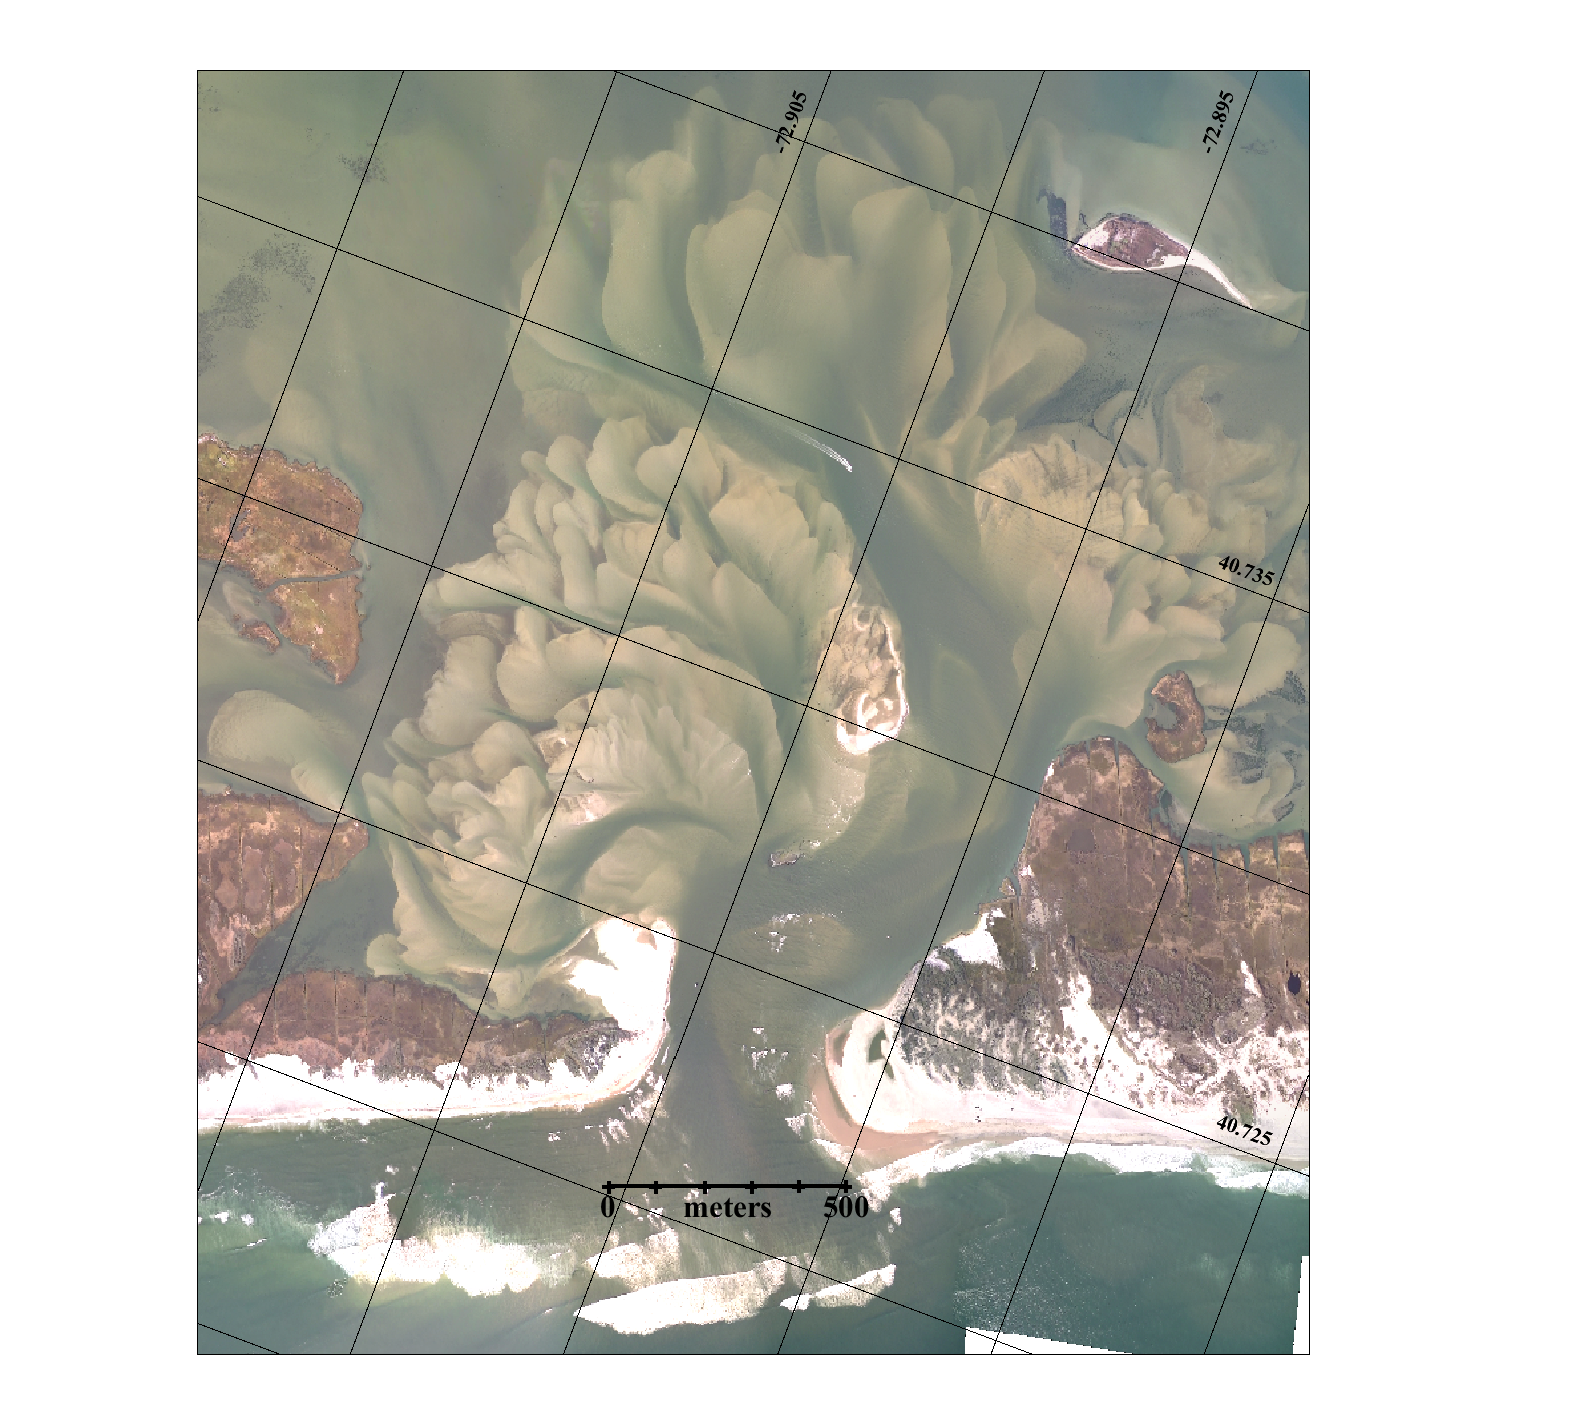
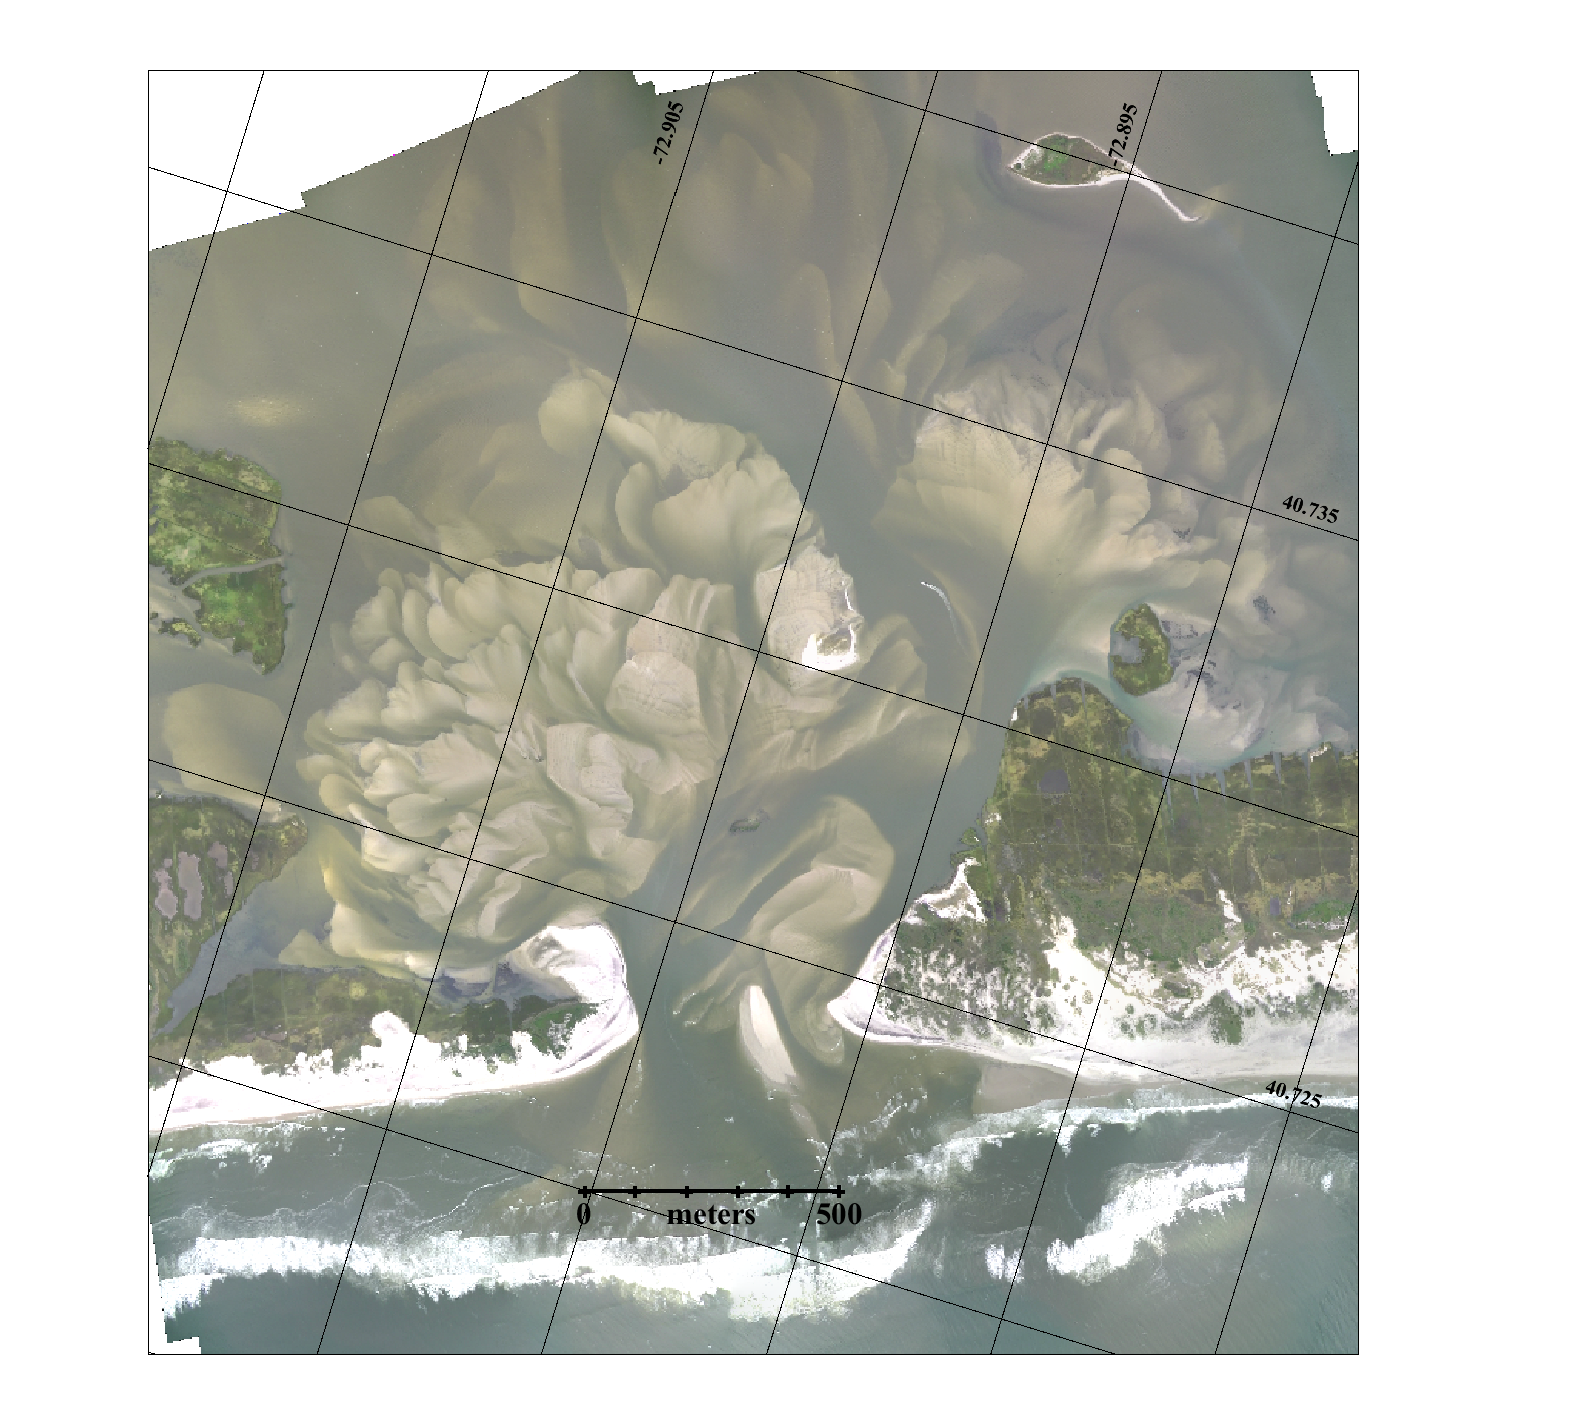
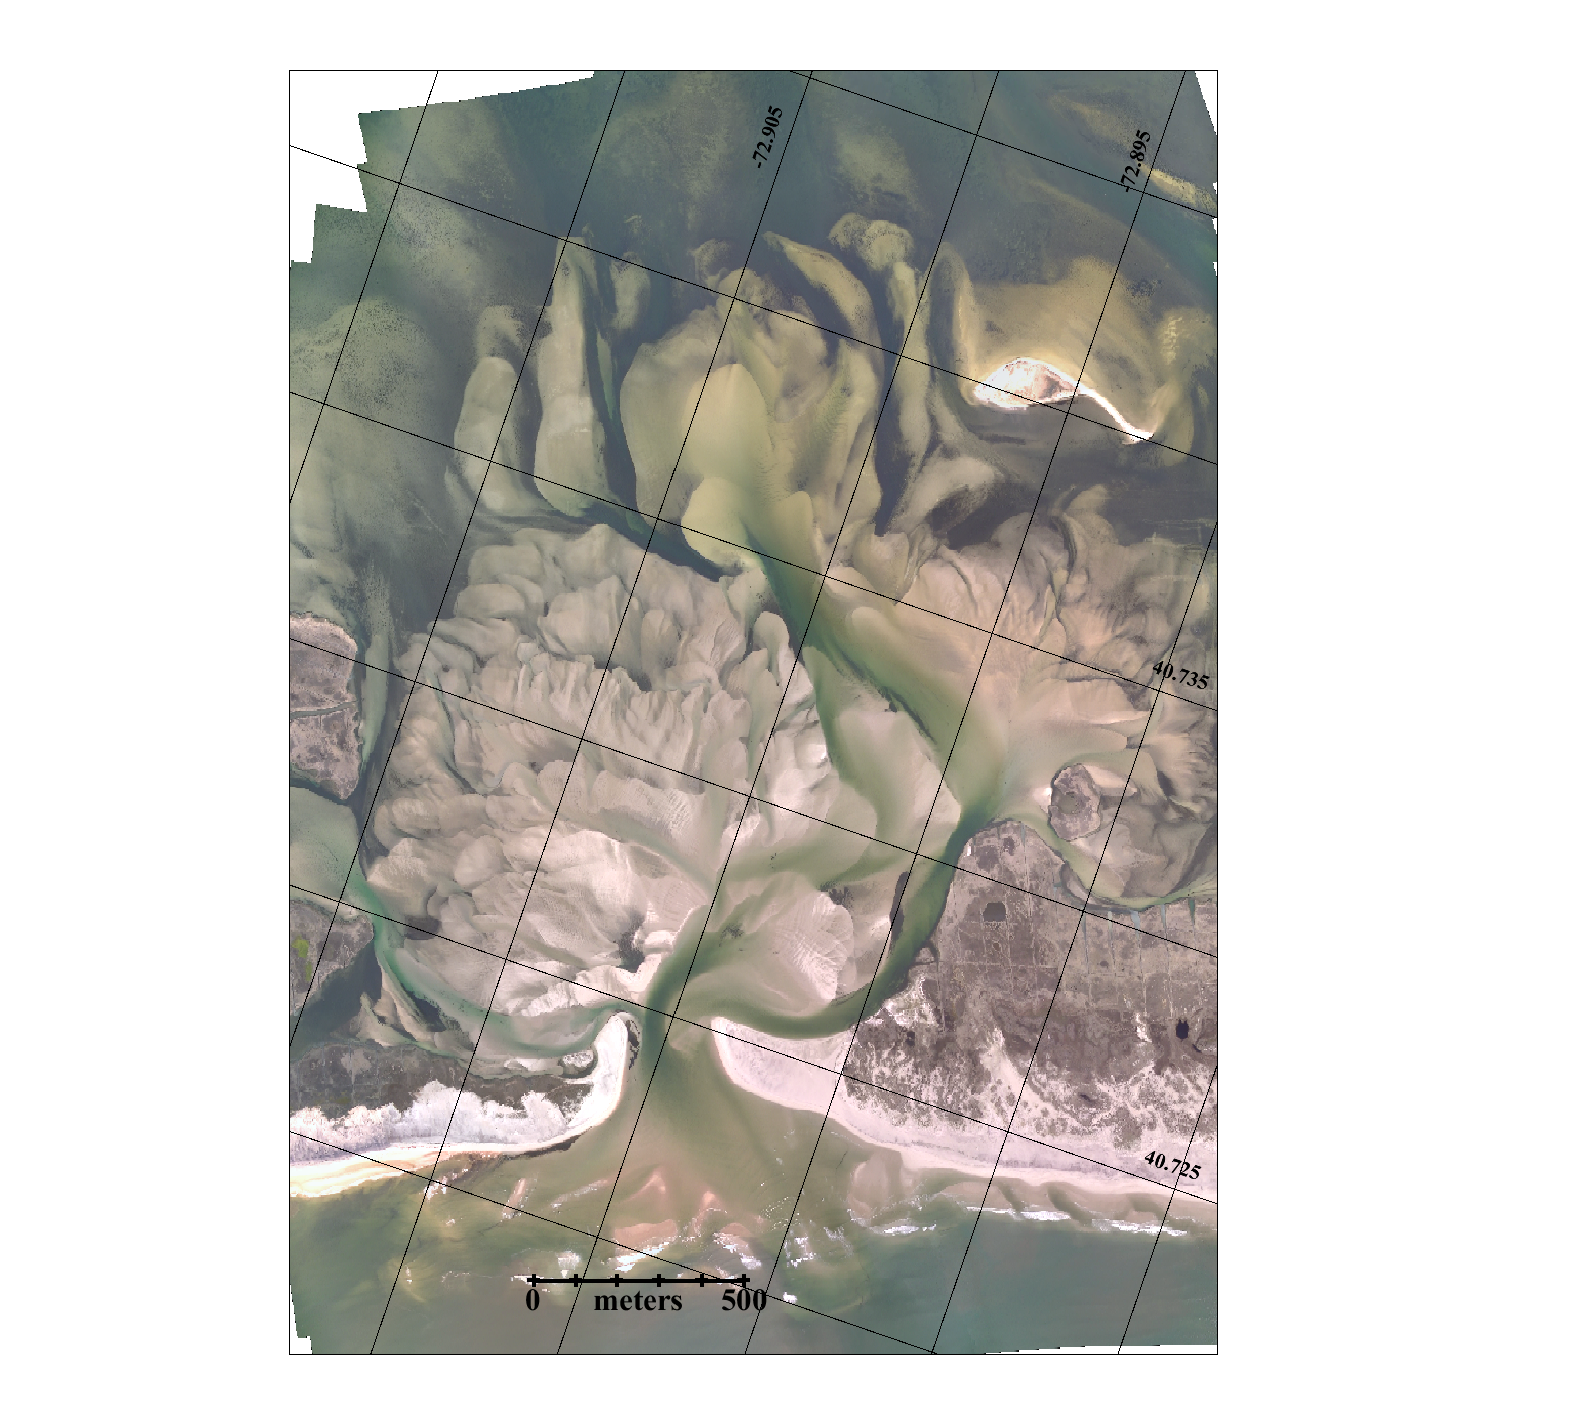
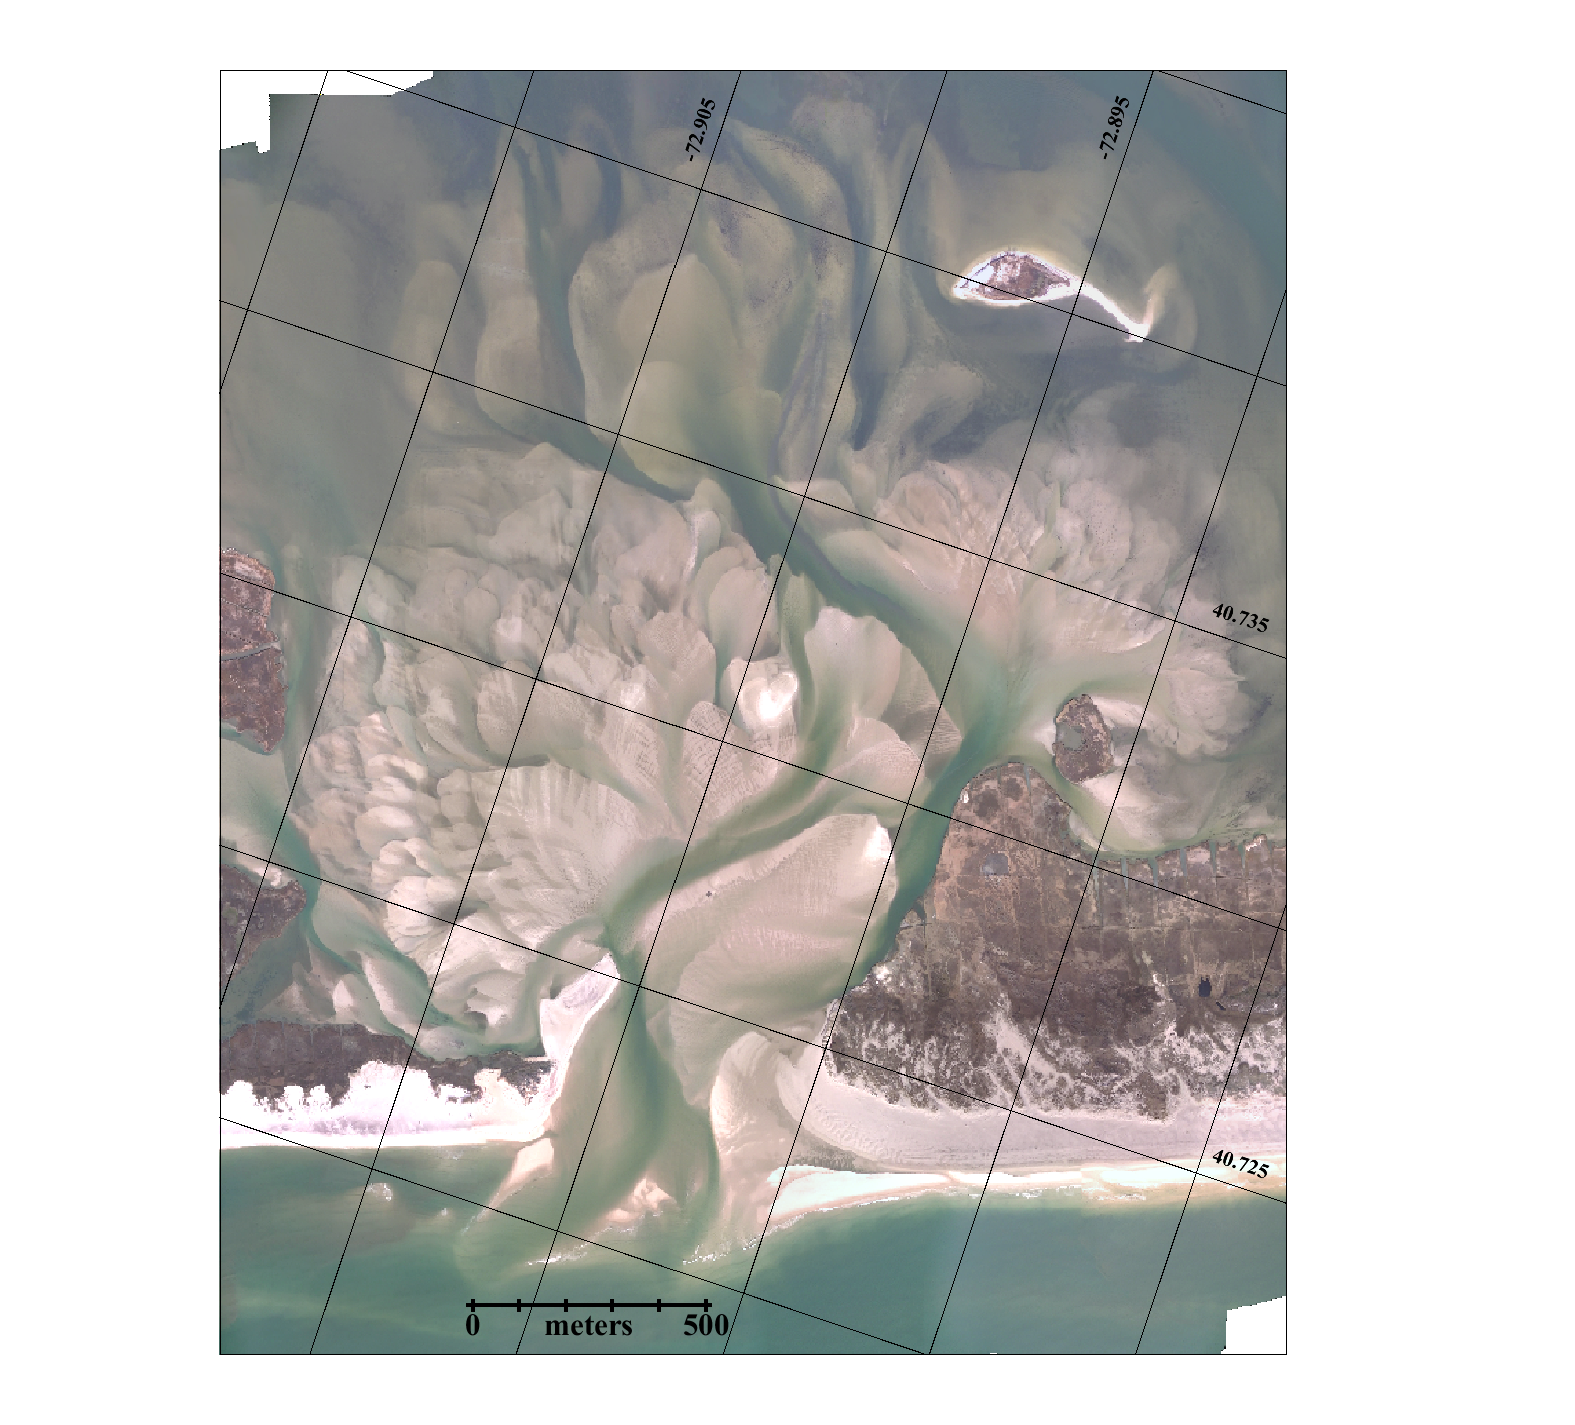
Hurricane Sandy
and breaches at Old Inlet, Coast Guard Cut, and Moriches
Inlet
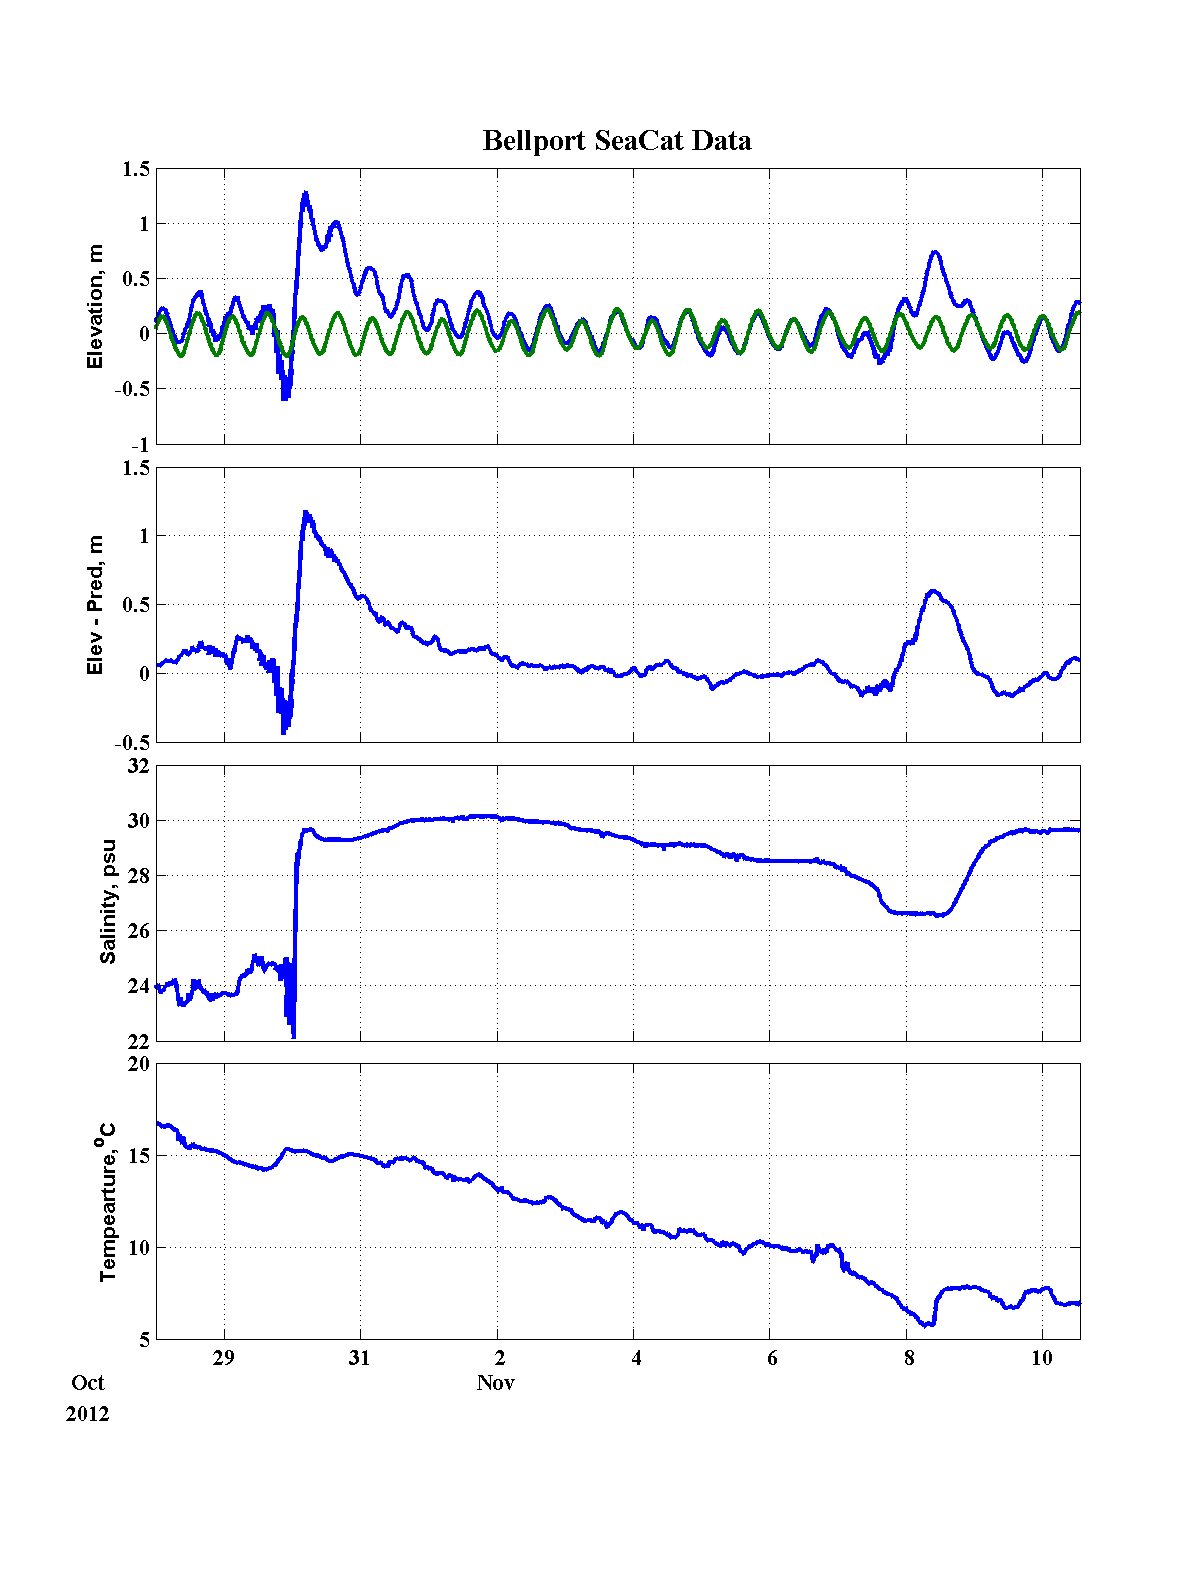
Real time data from the Bellport dock is presented below in the Great South Bay Observatory section.
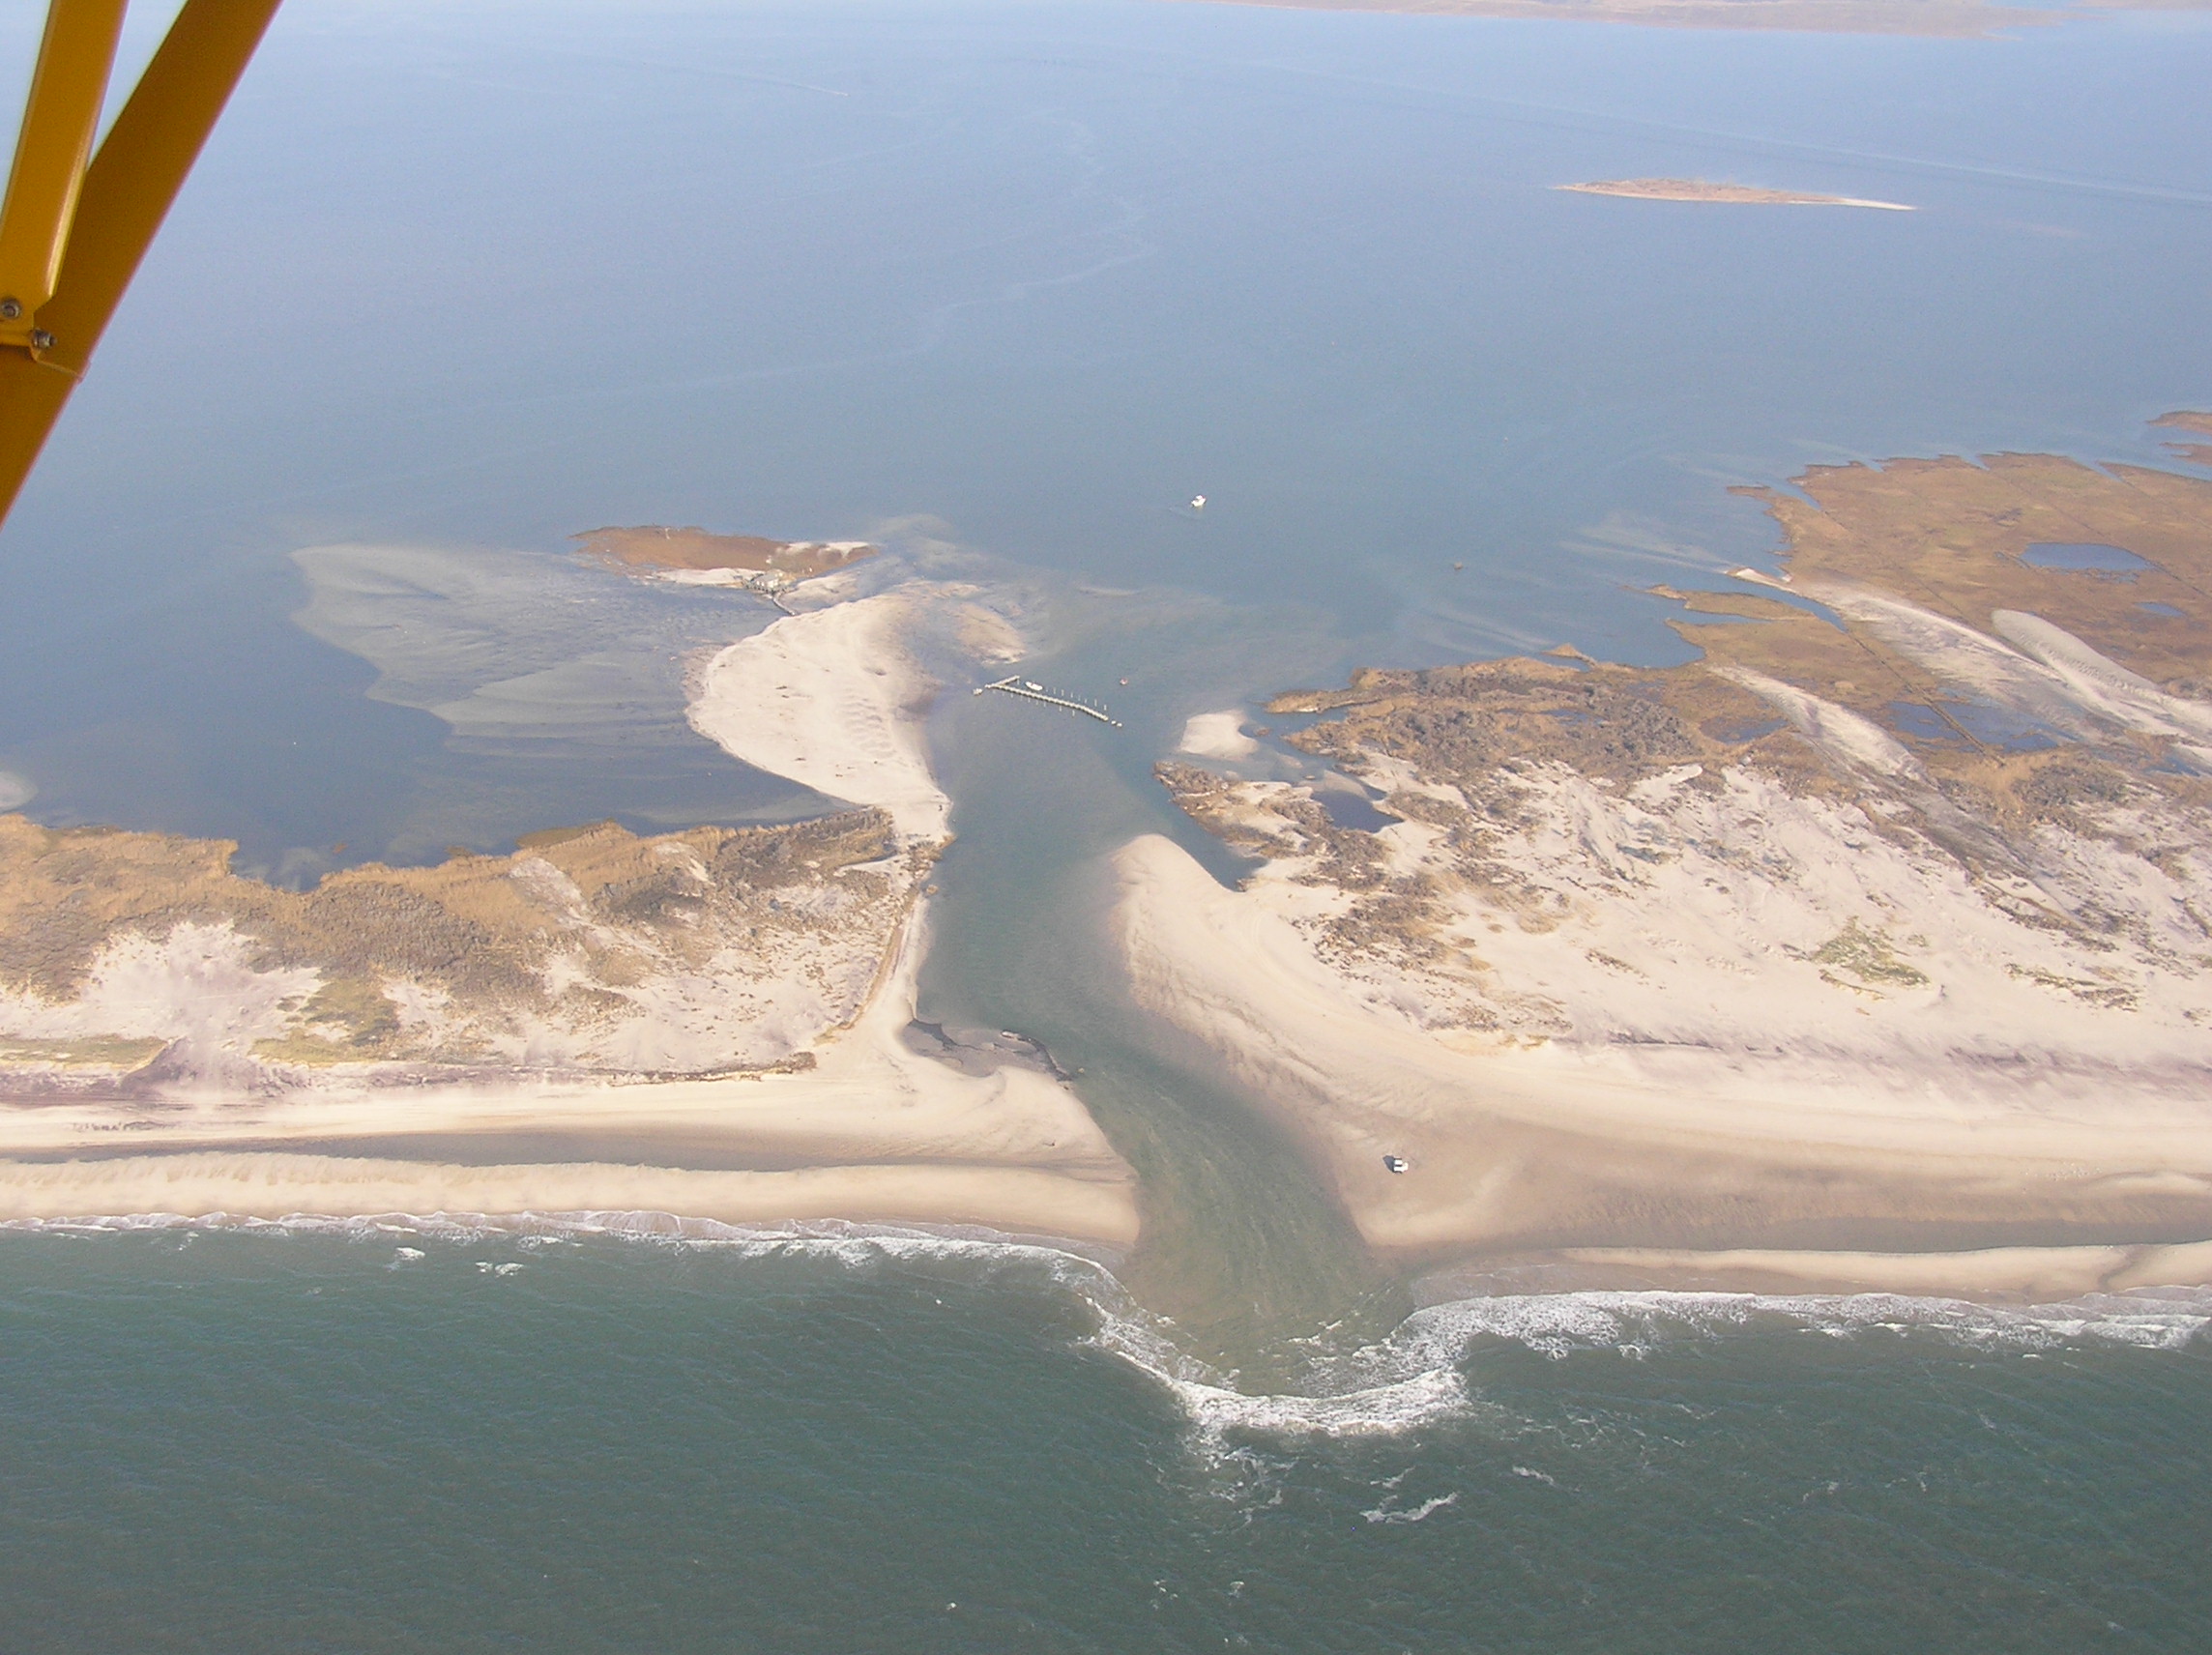
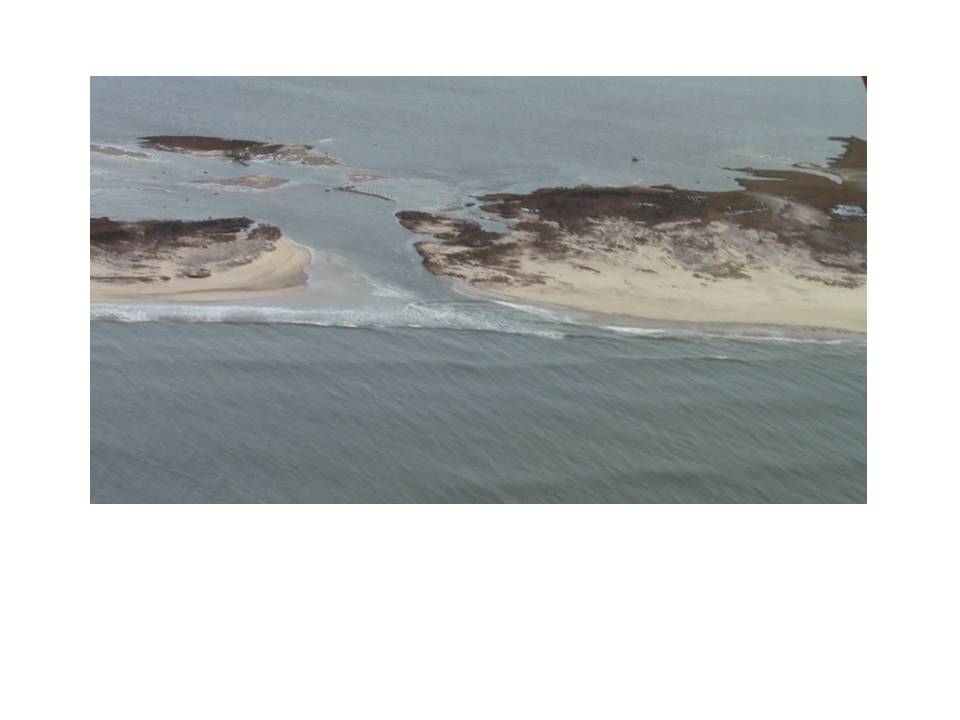
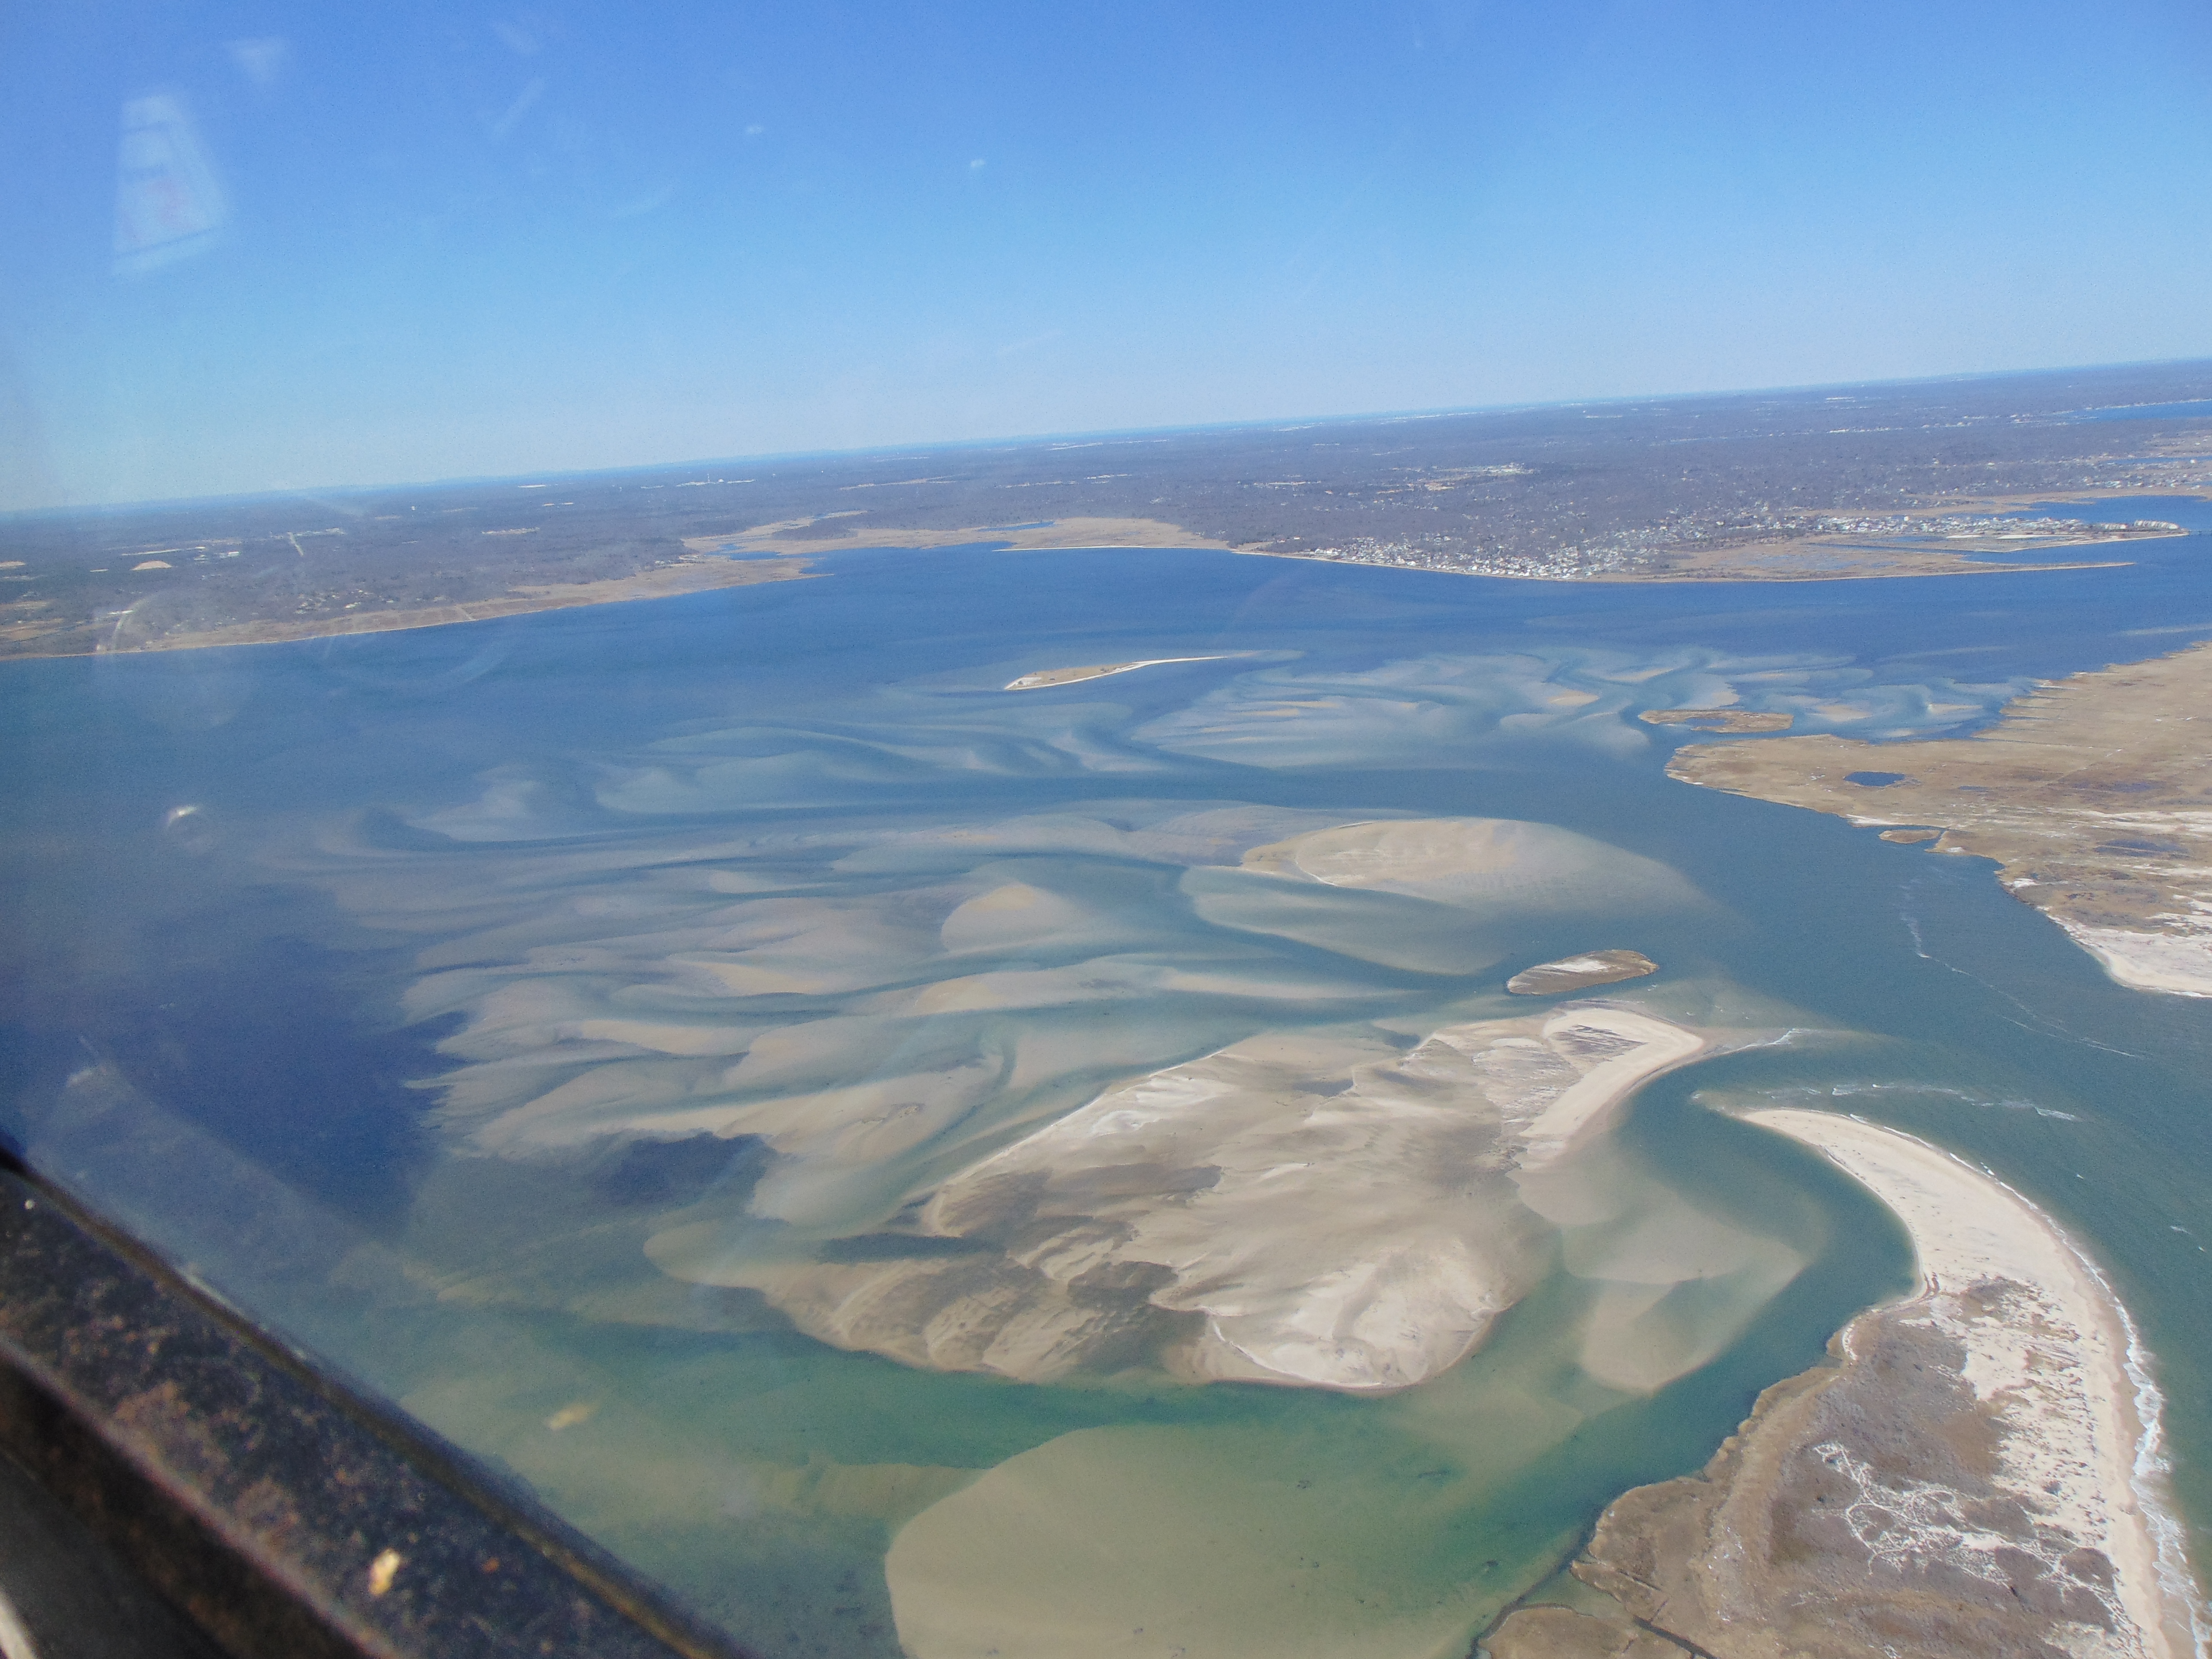
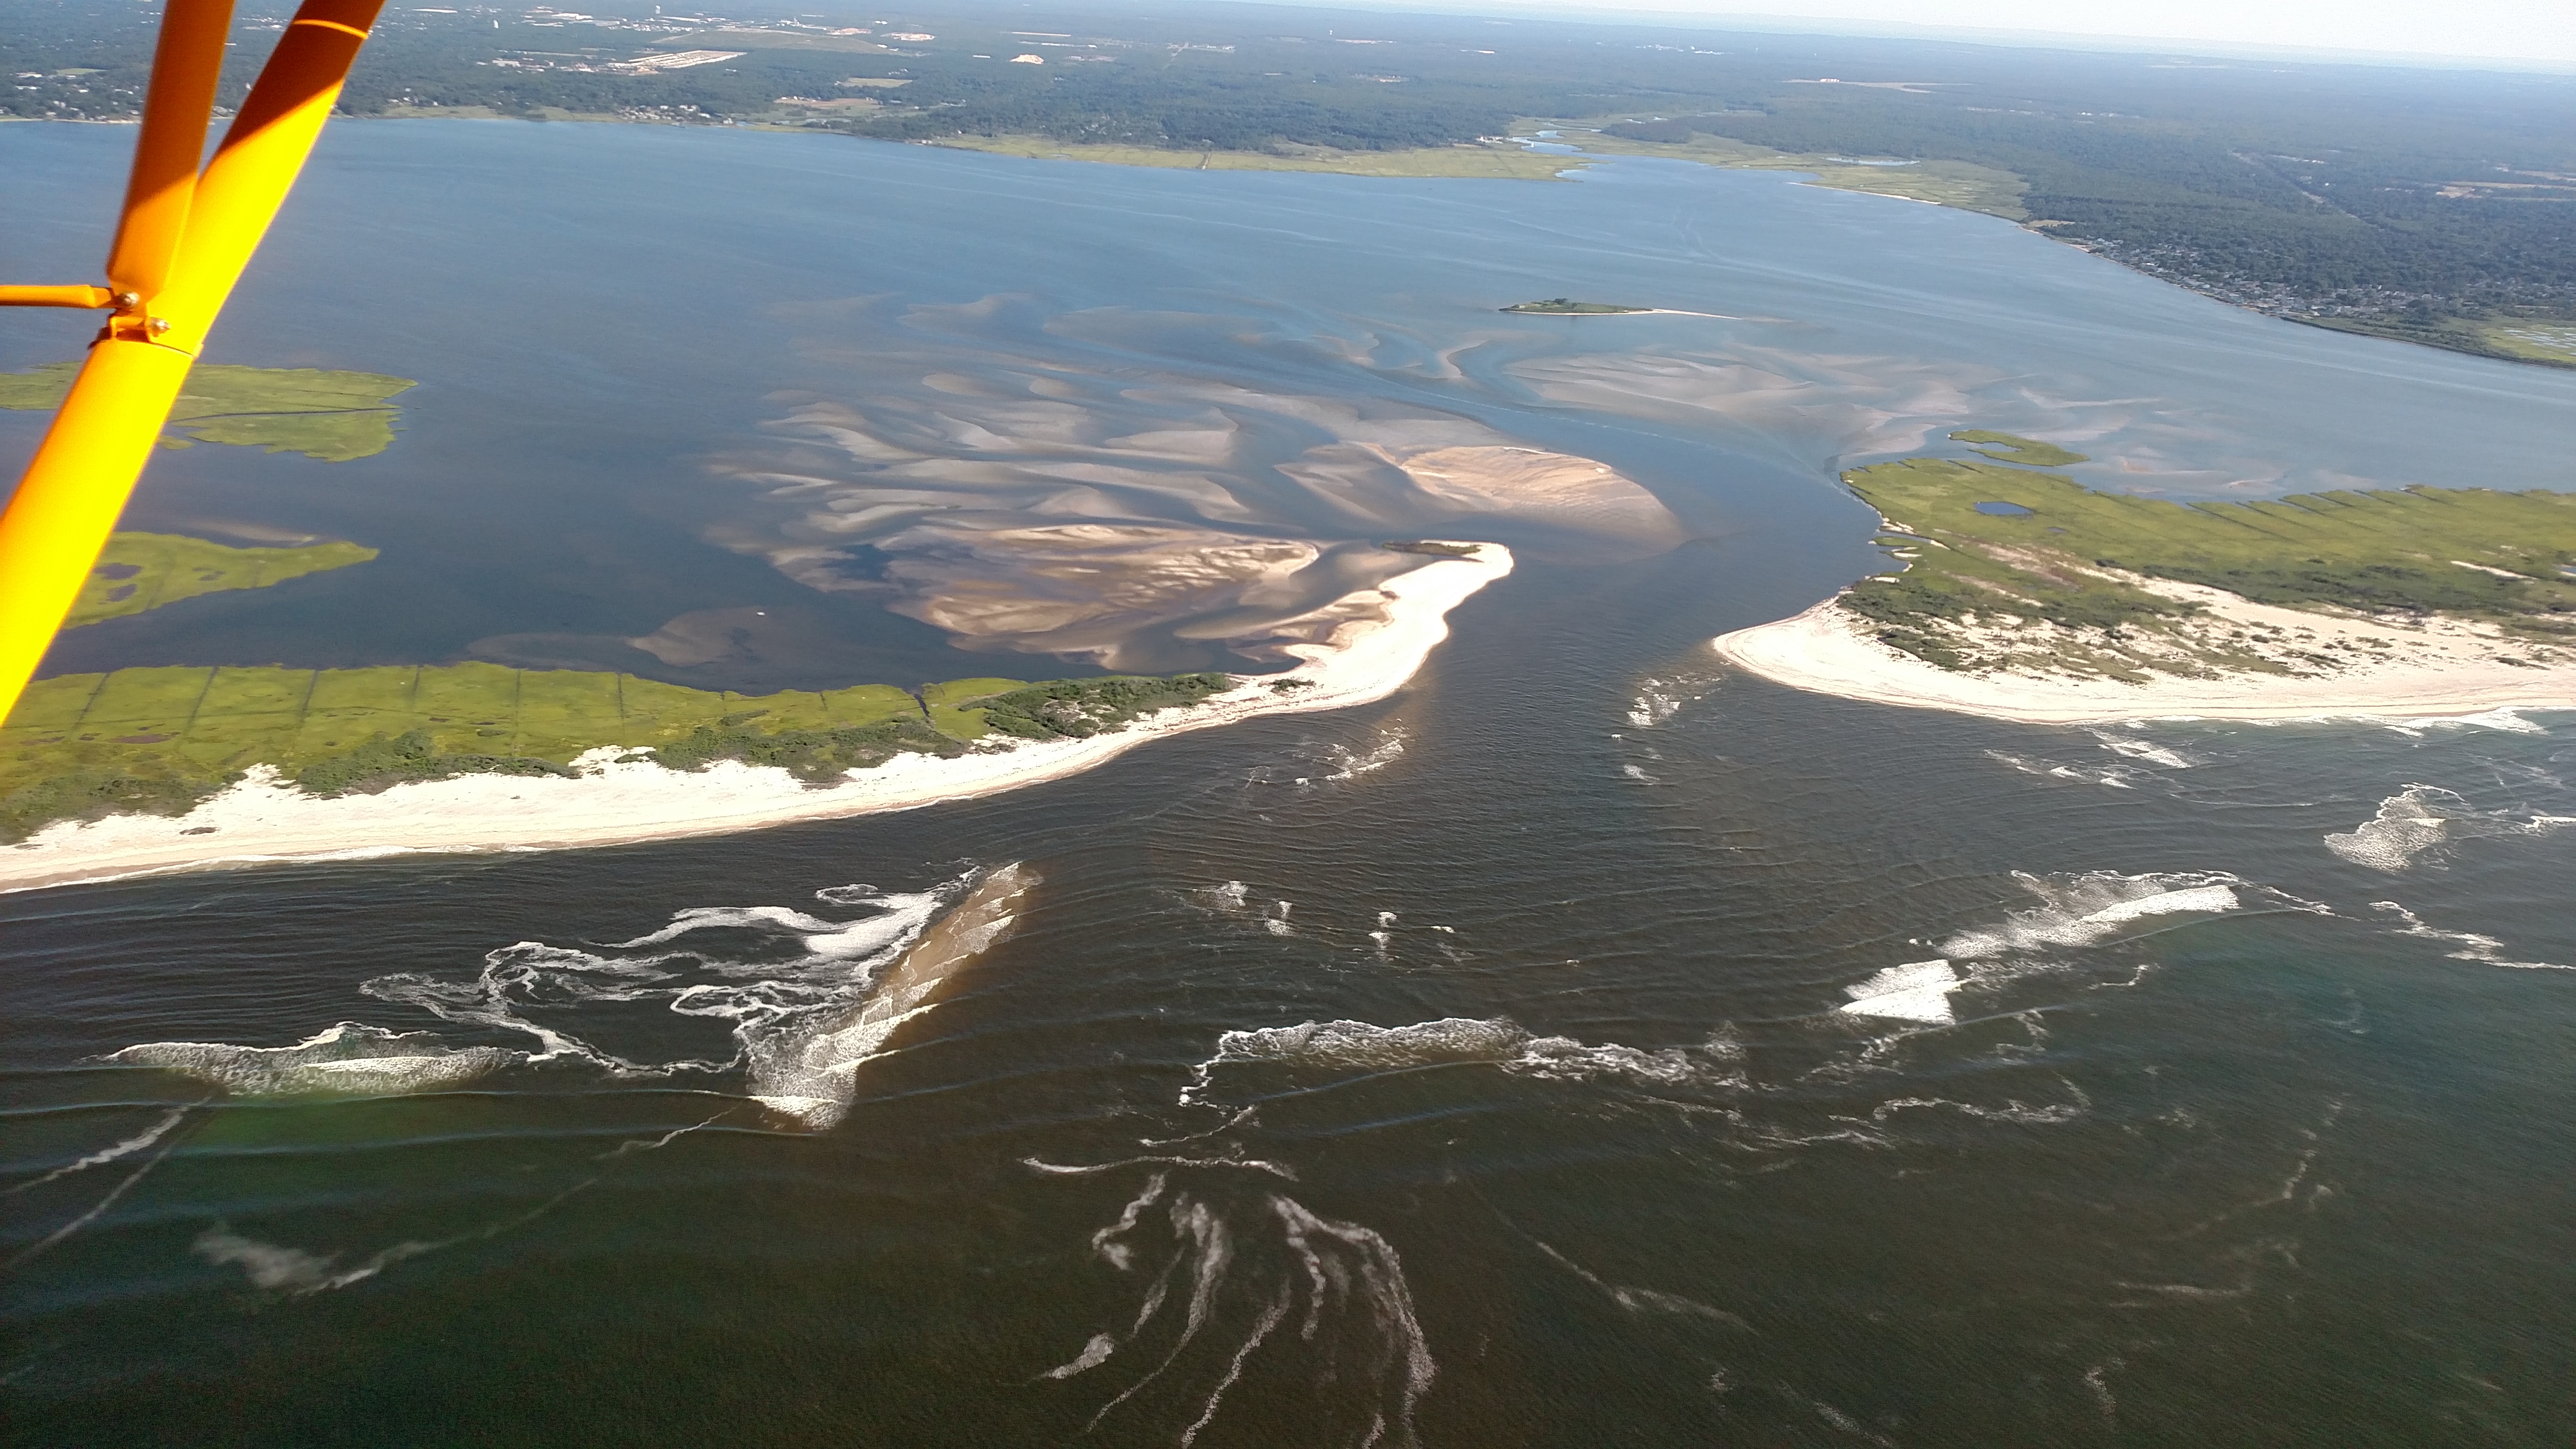
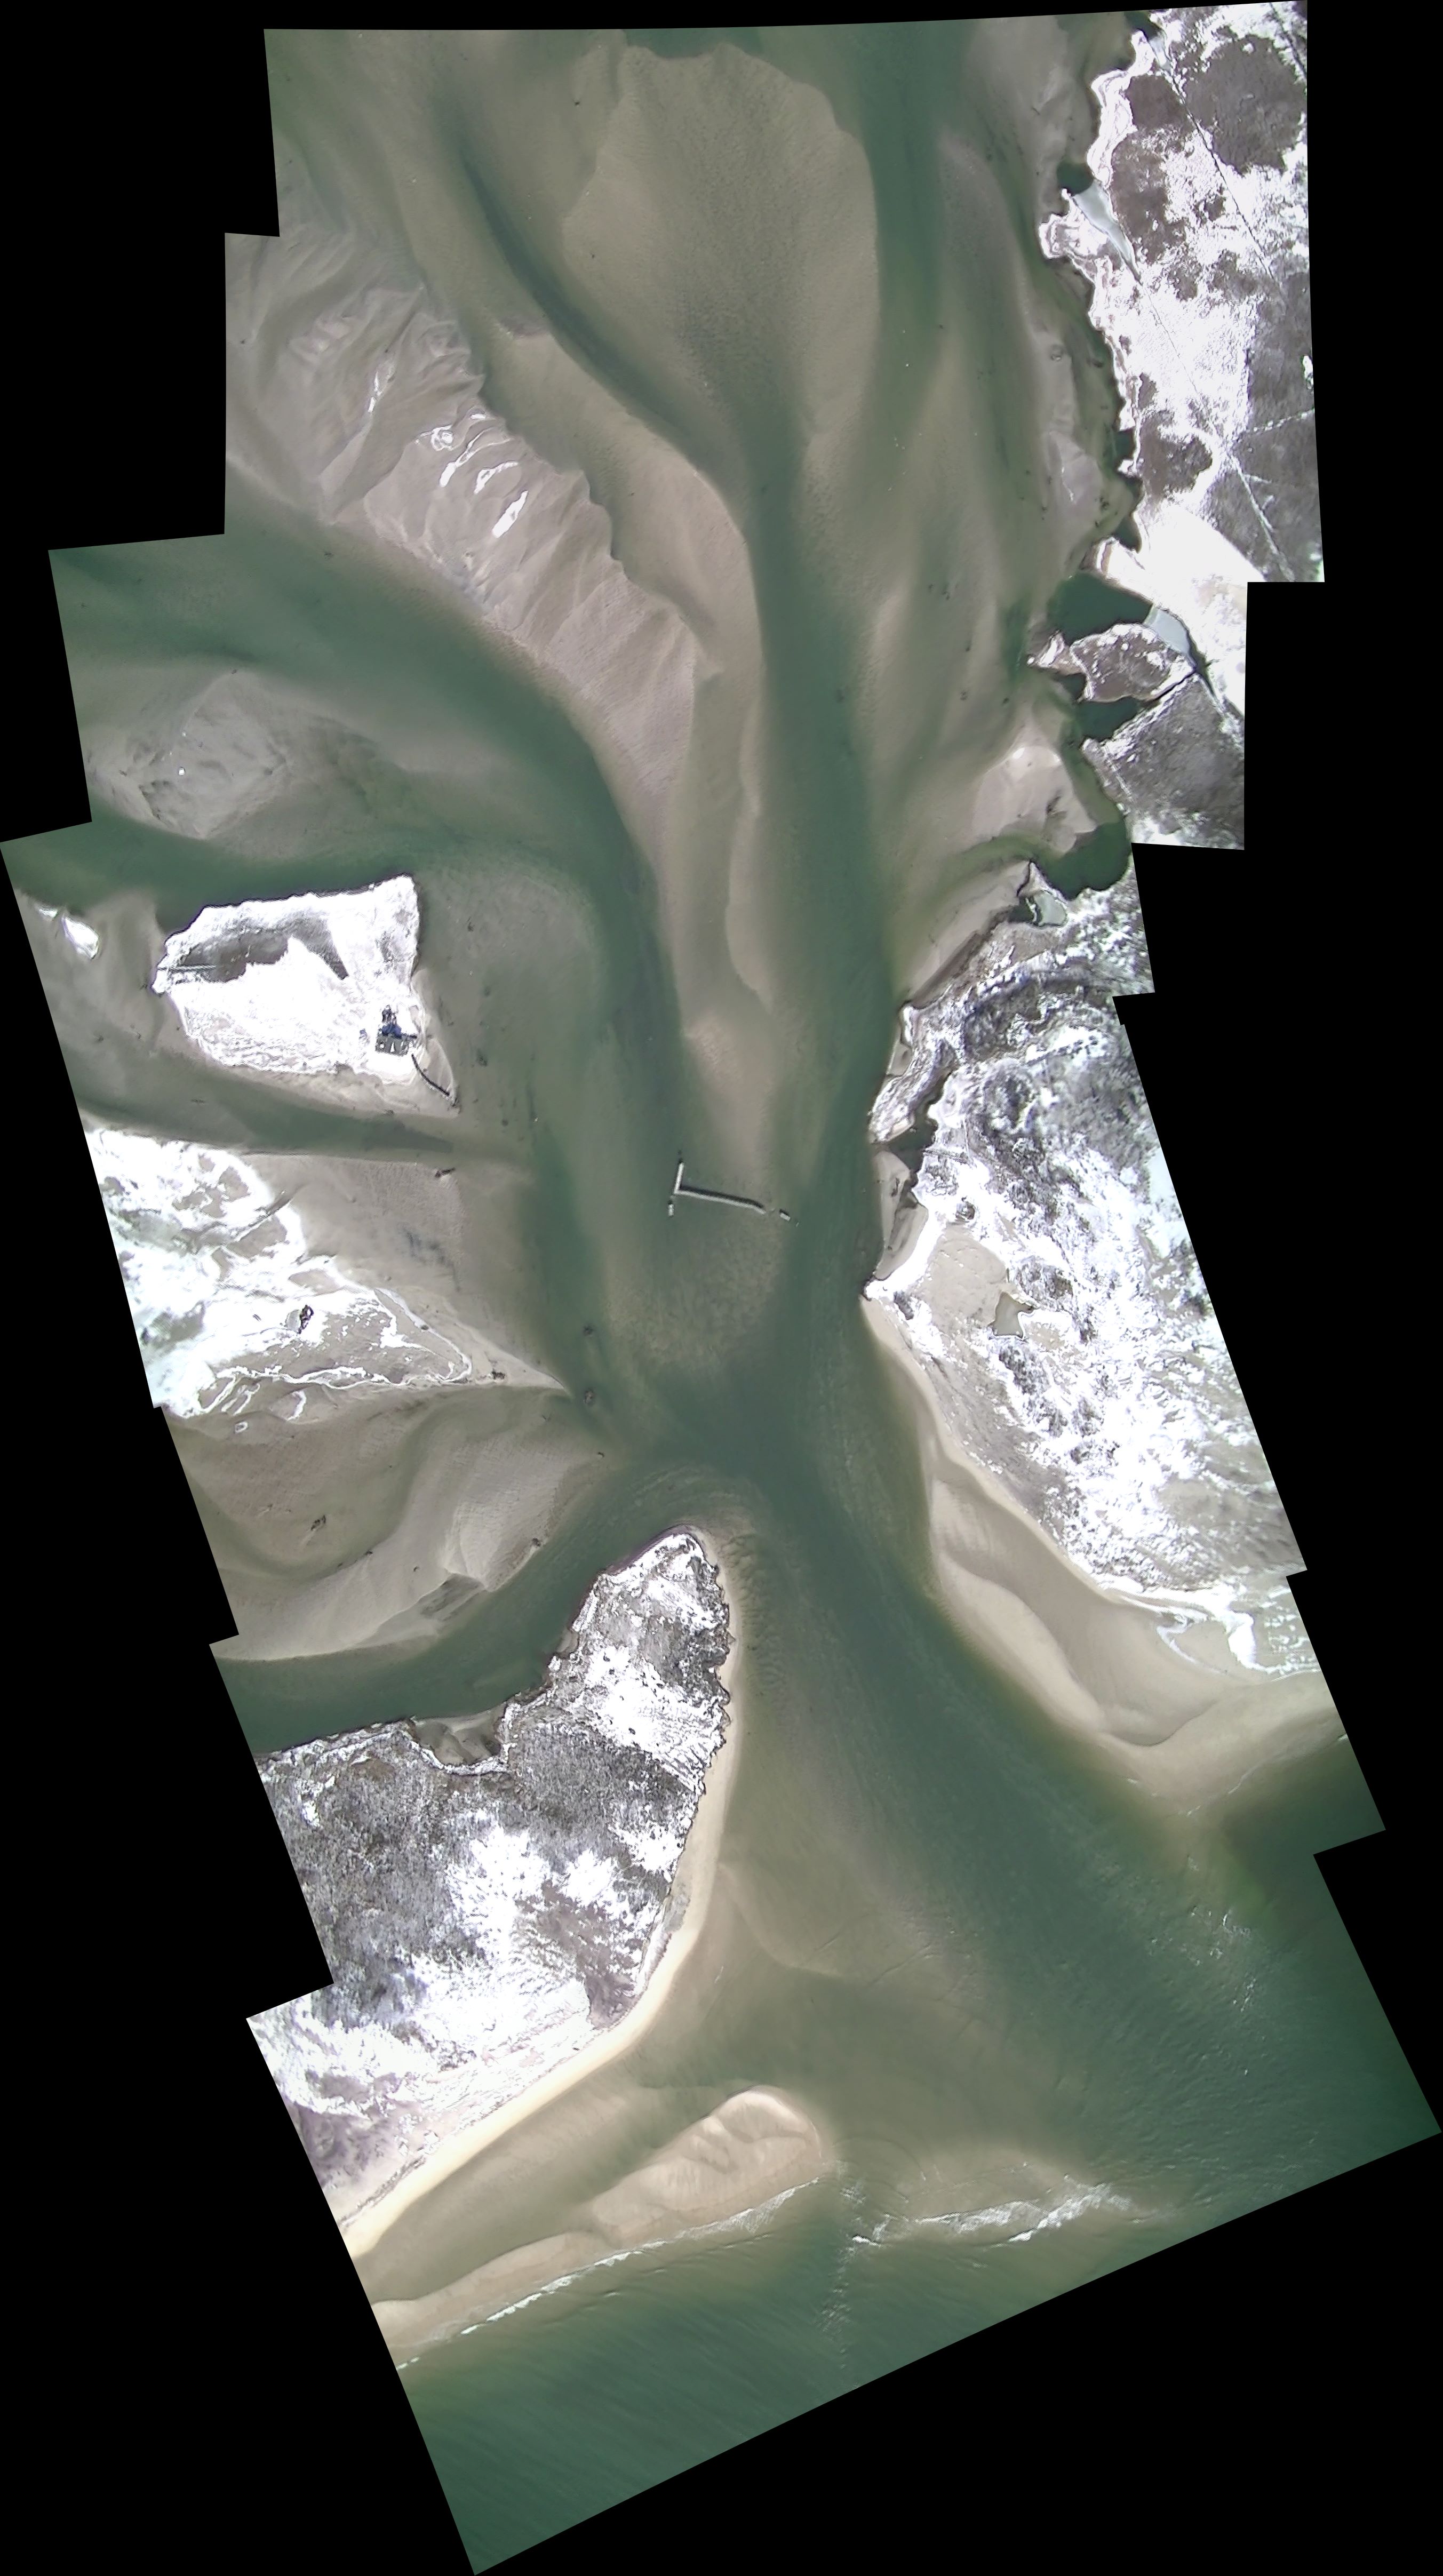
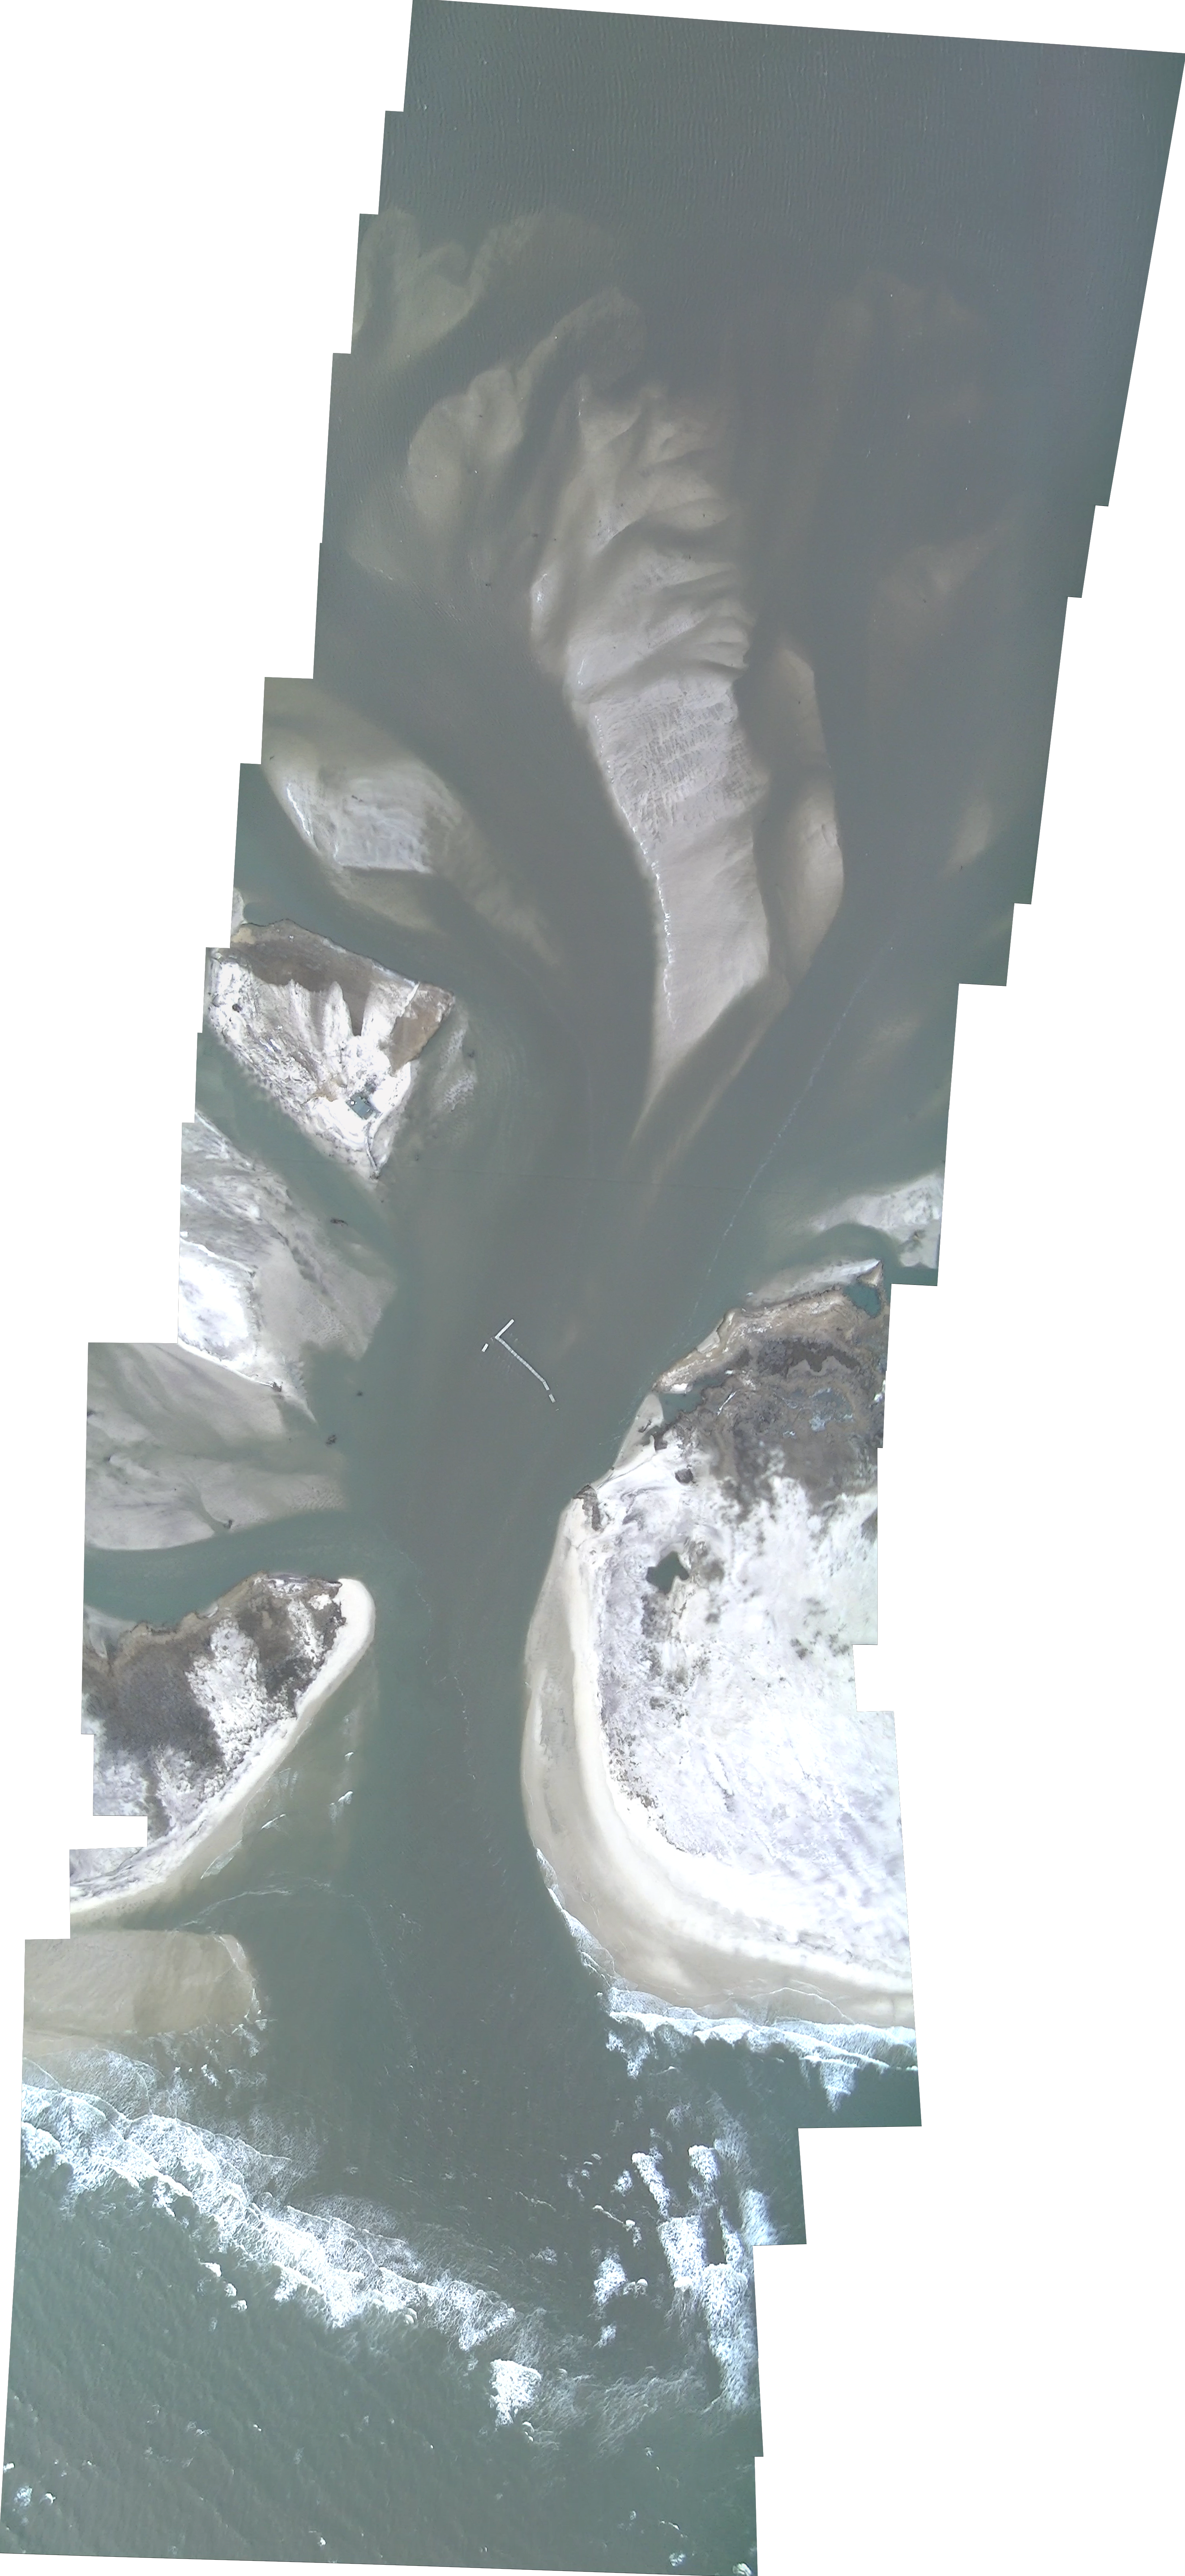
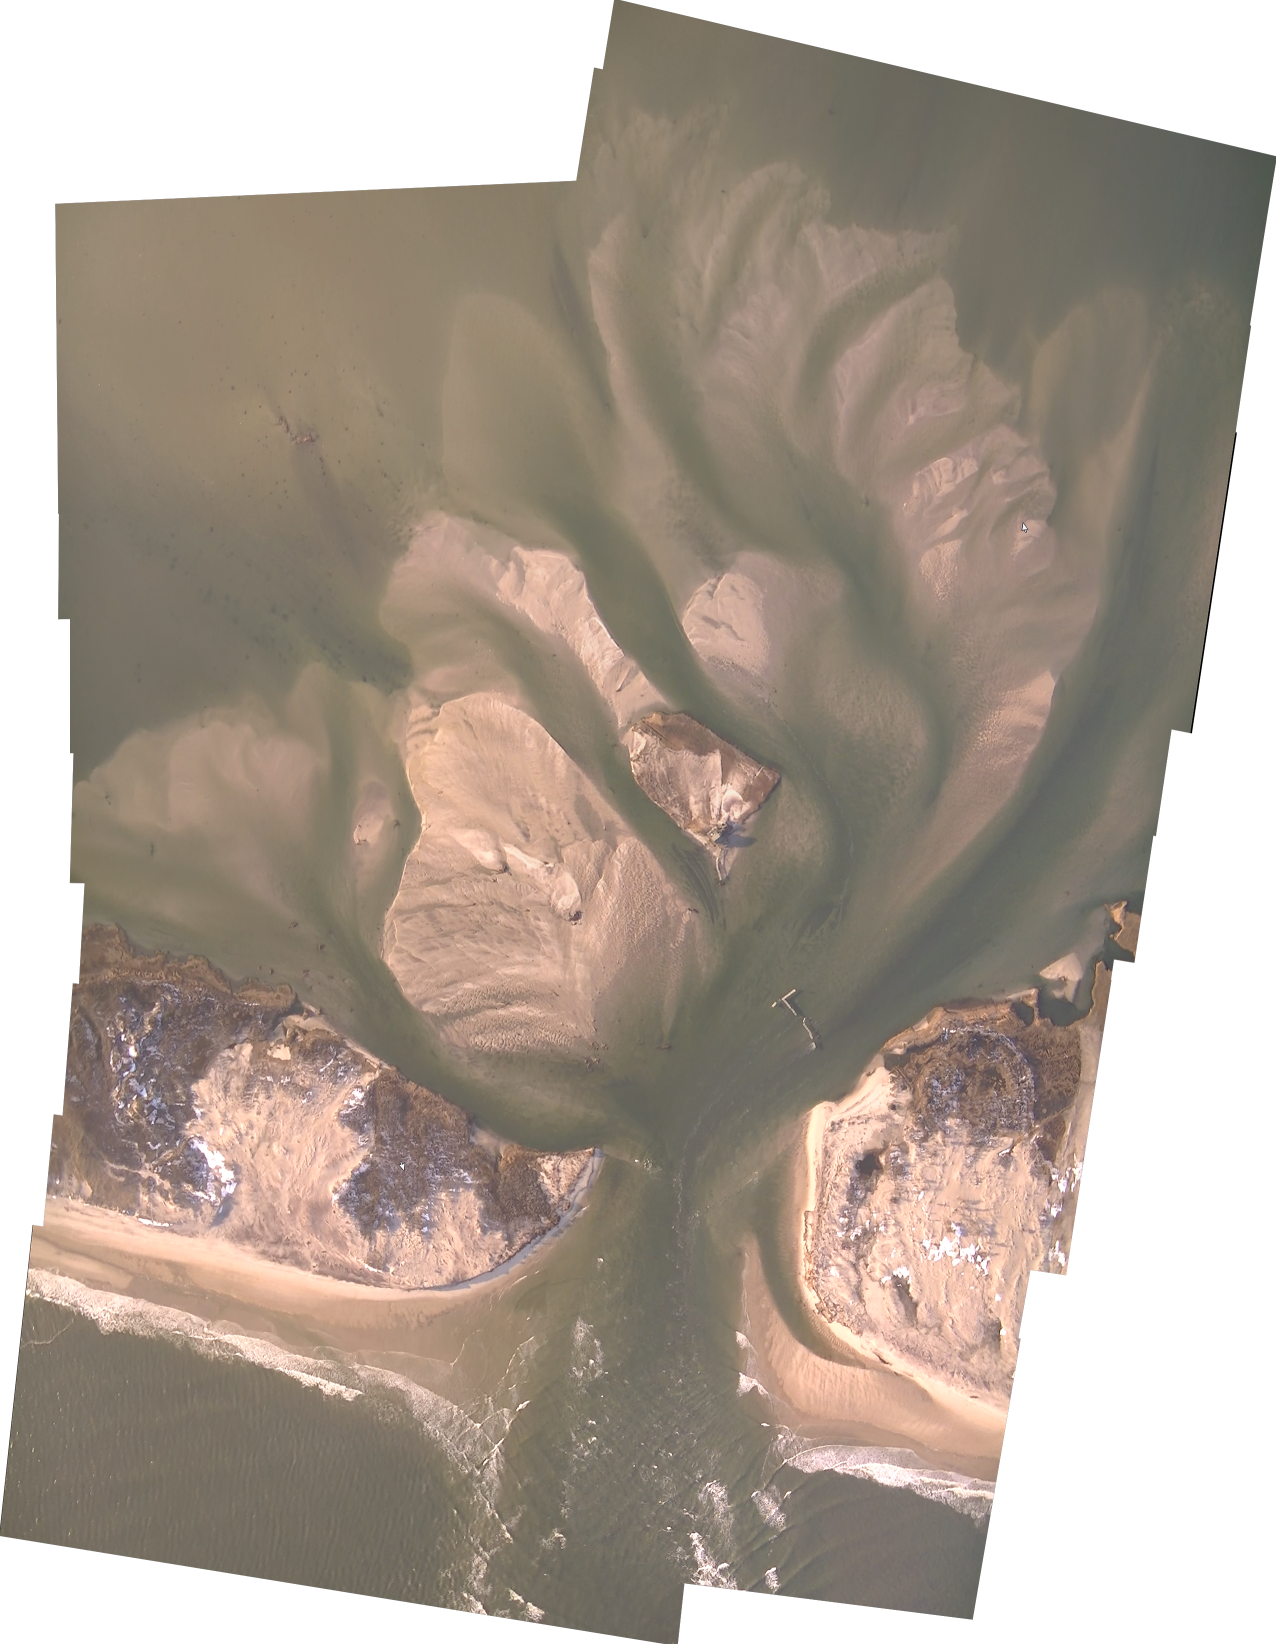
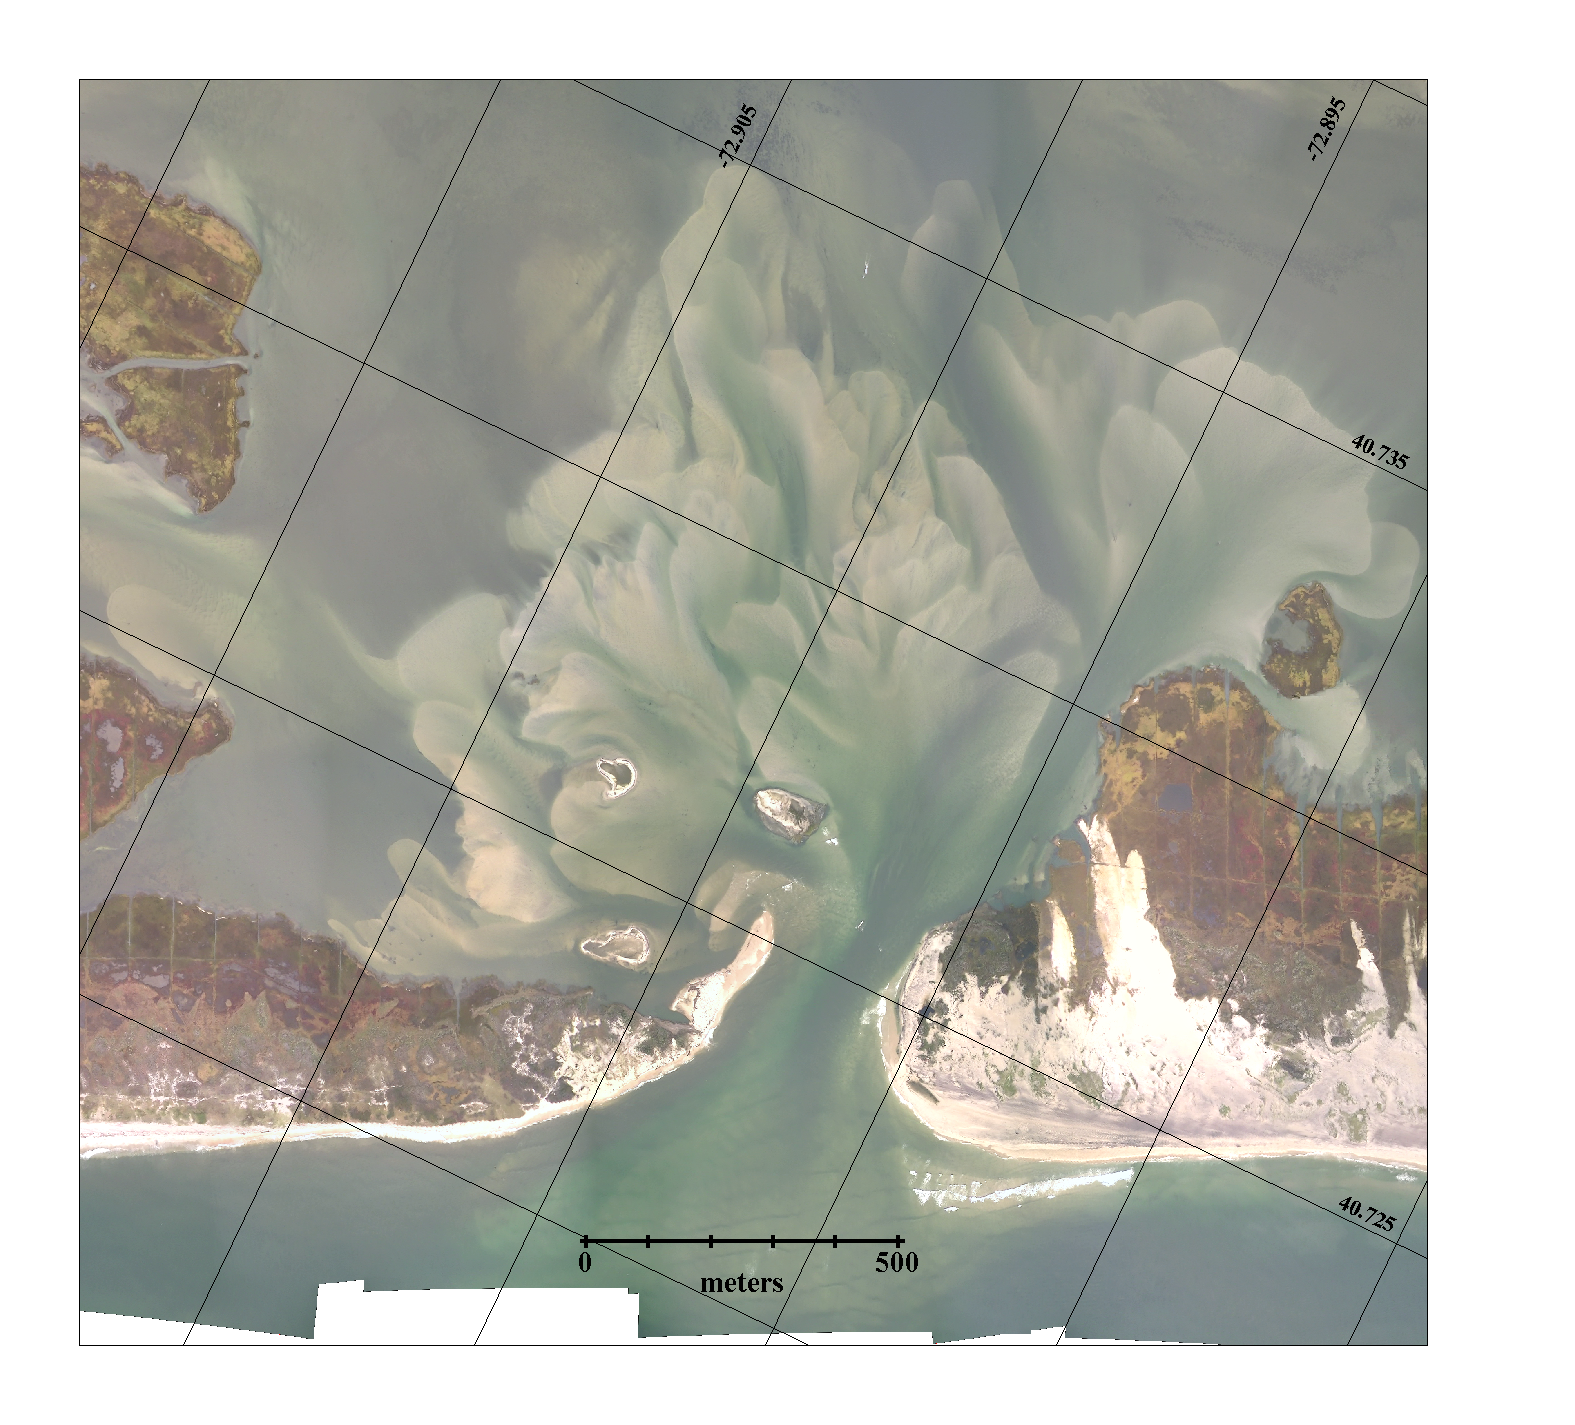
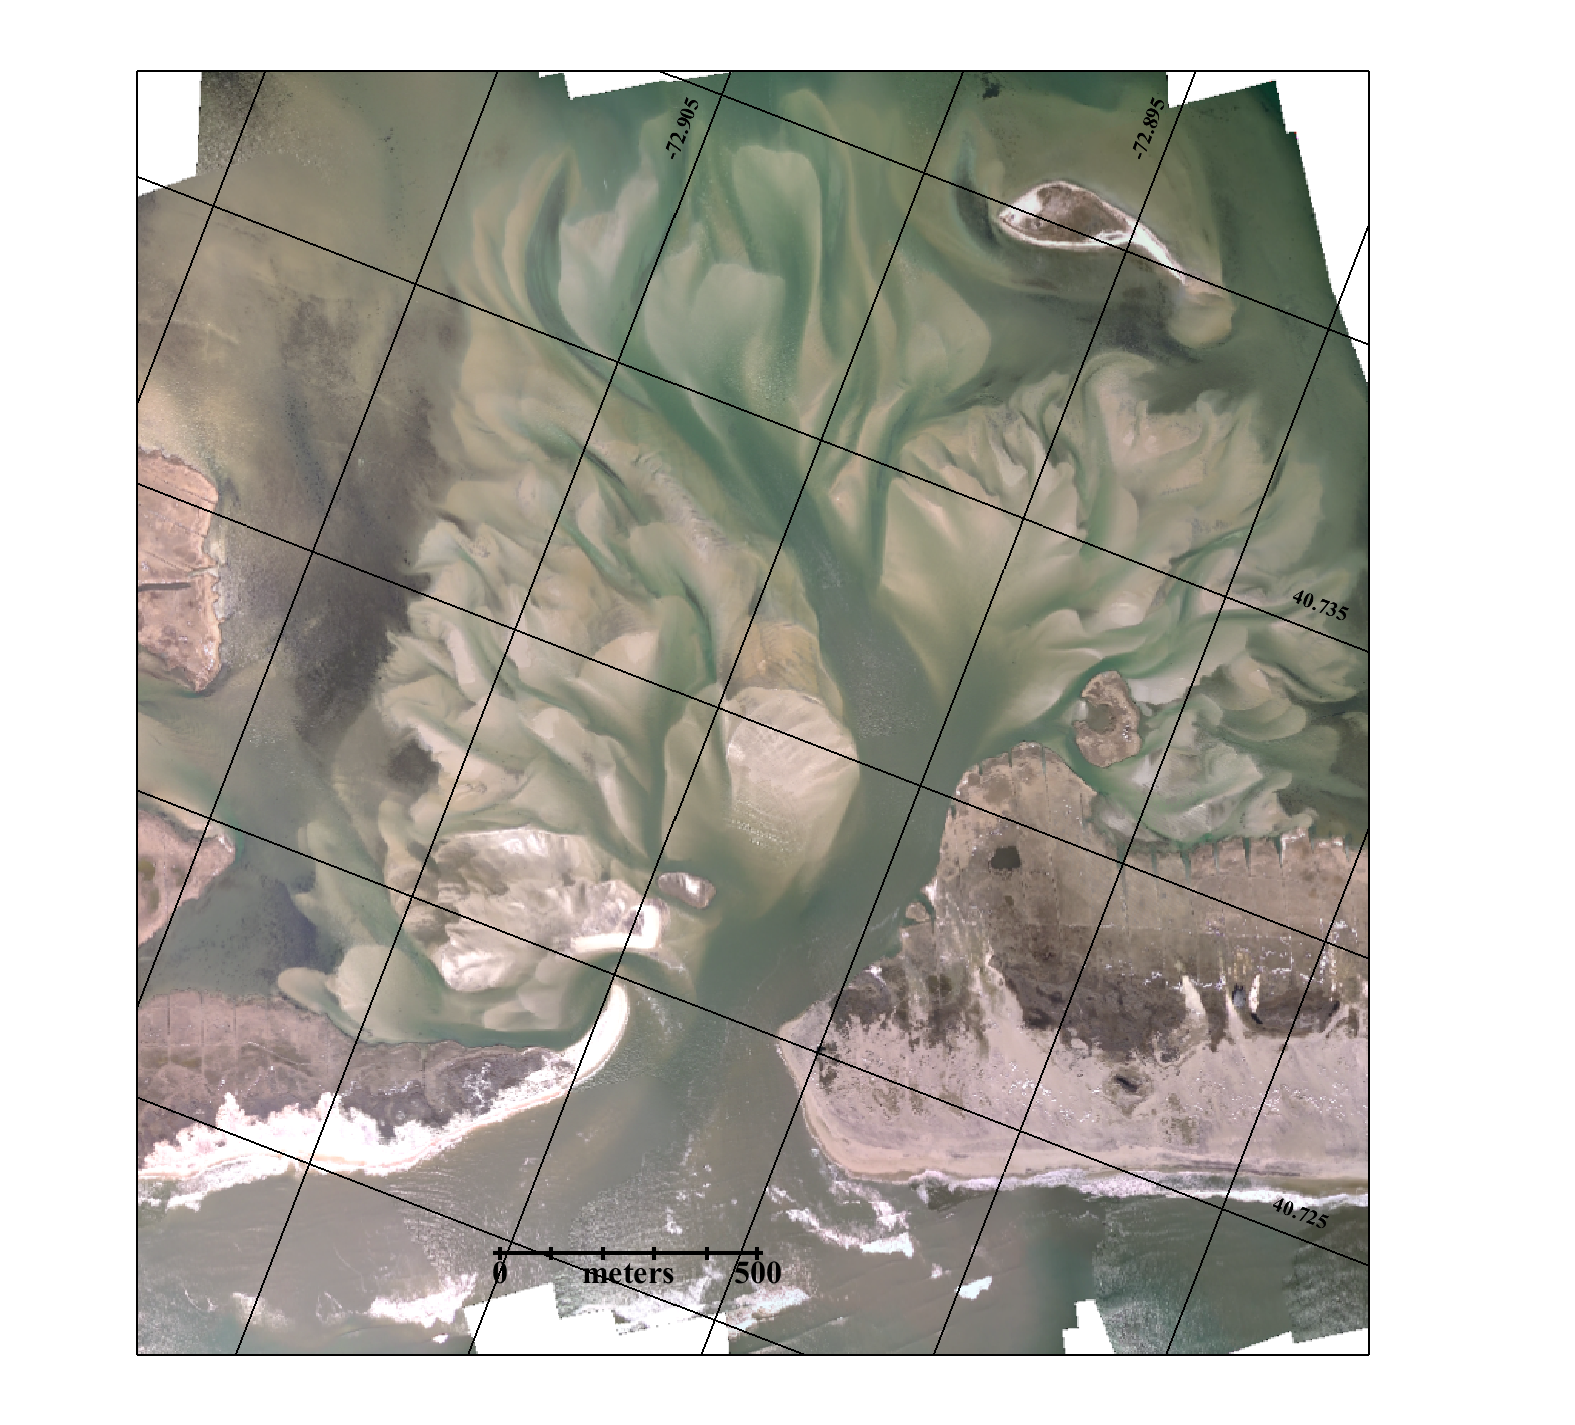
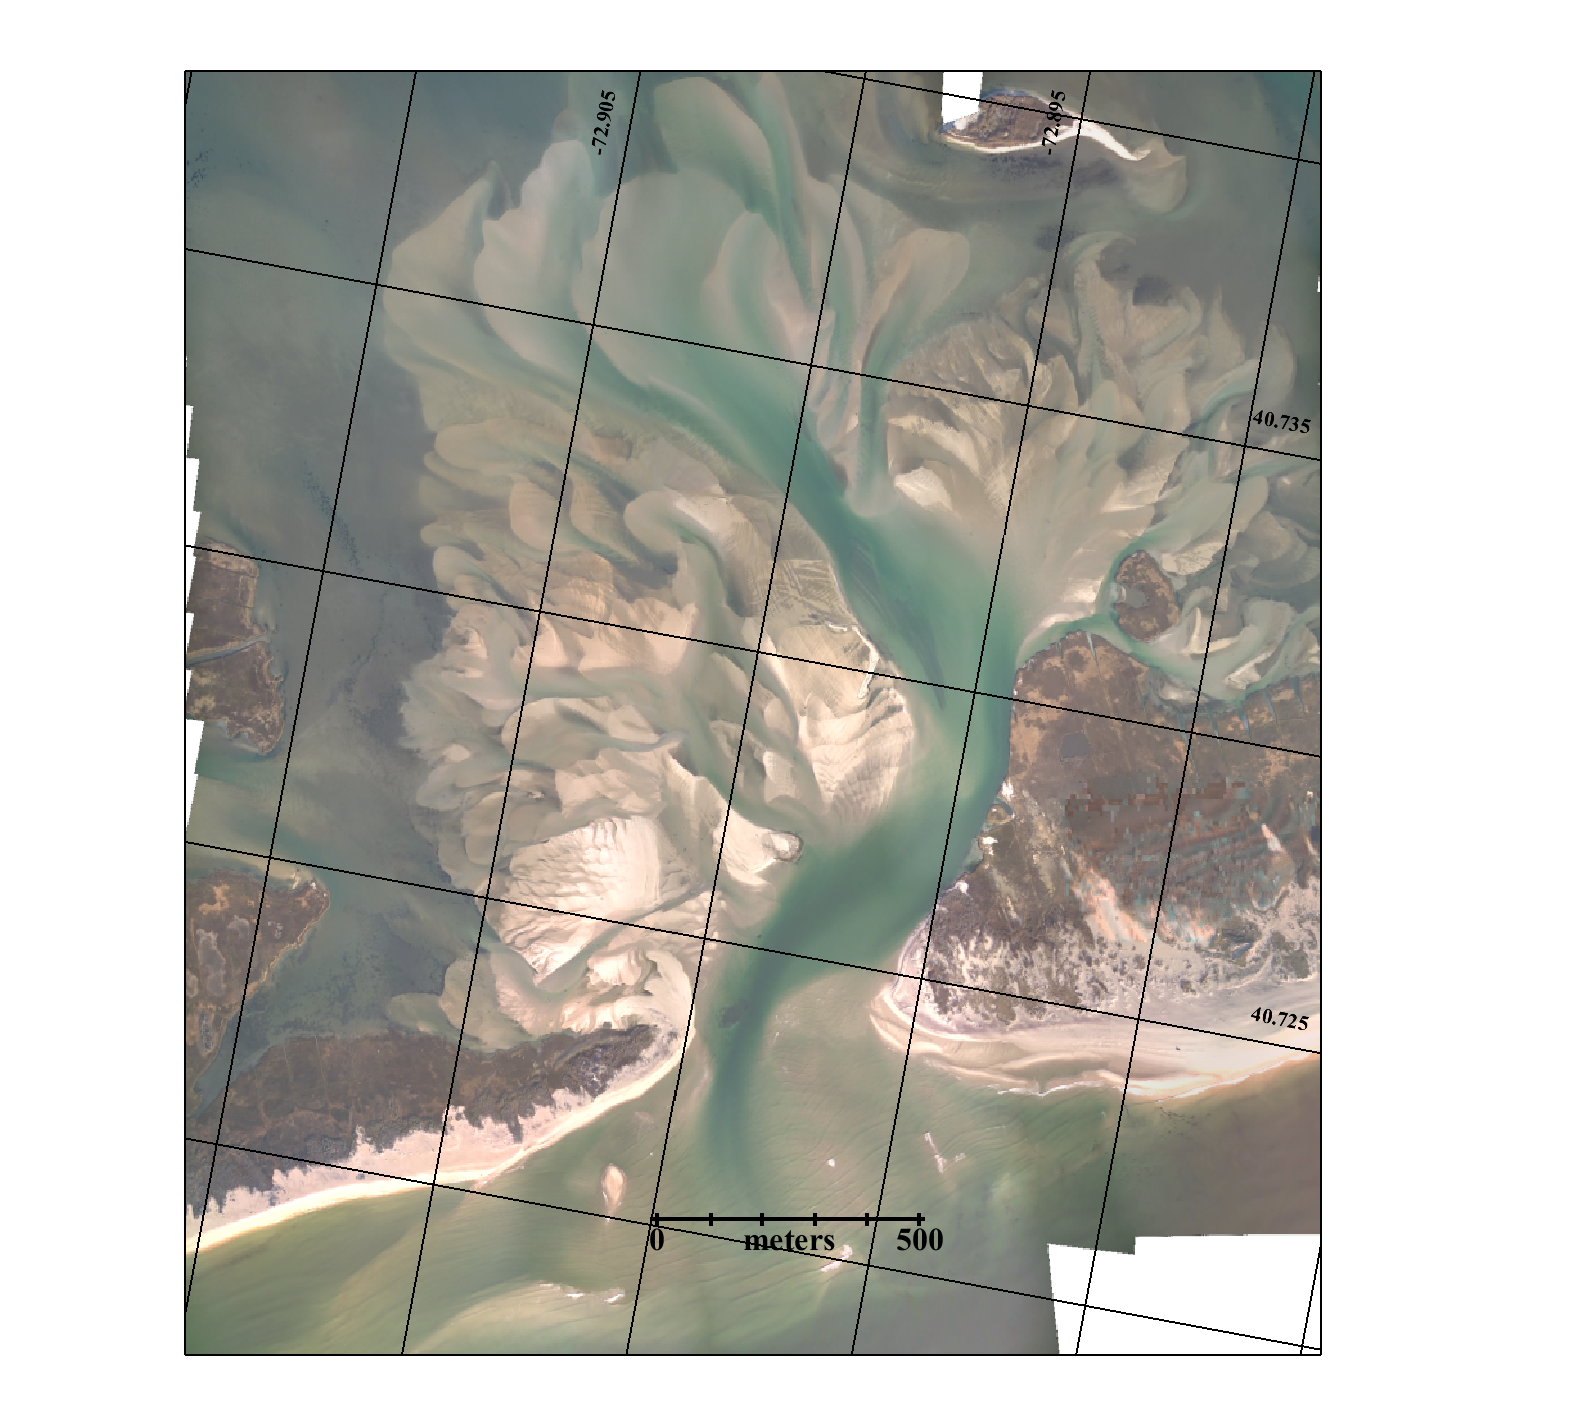
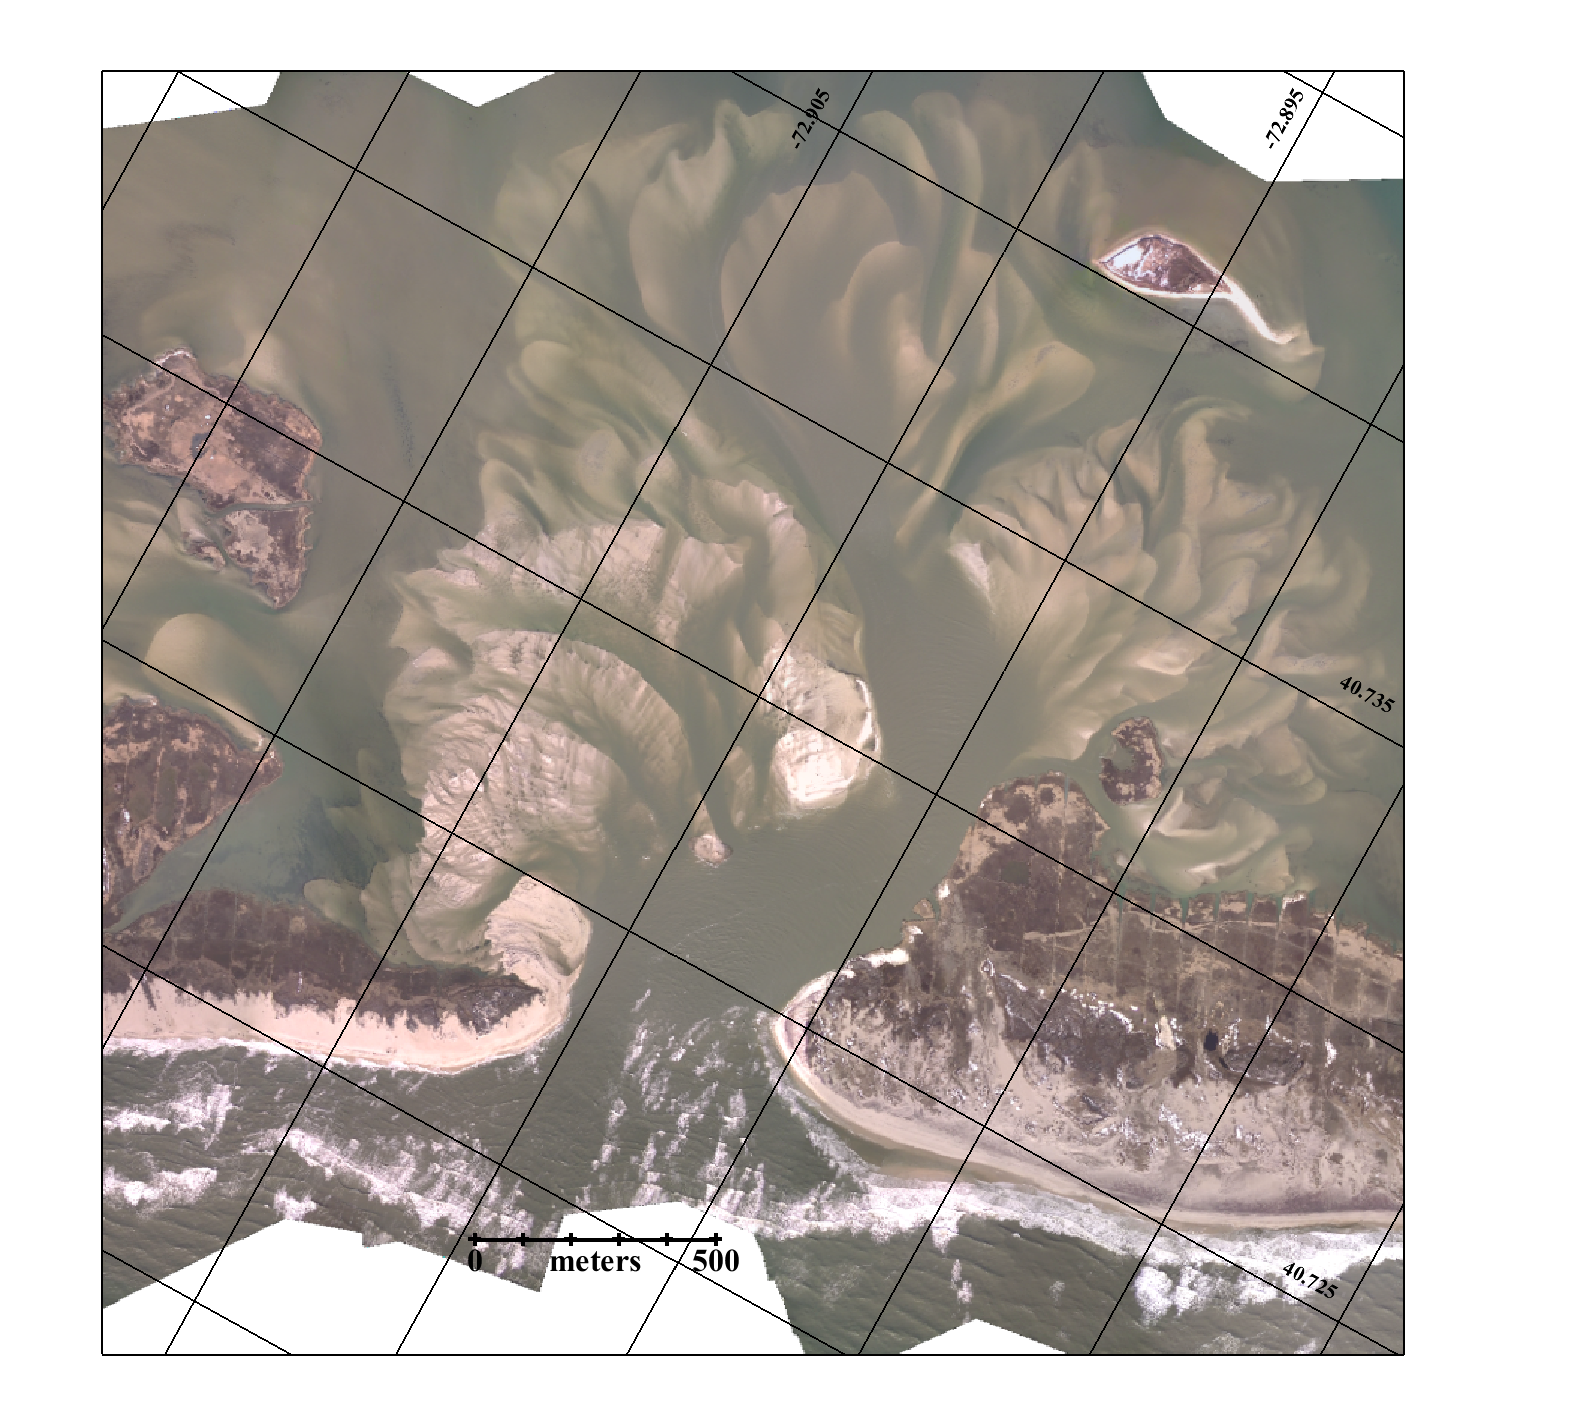
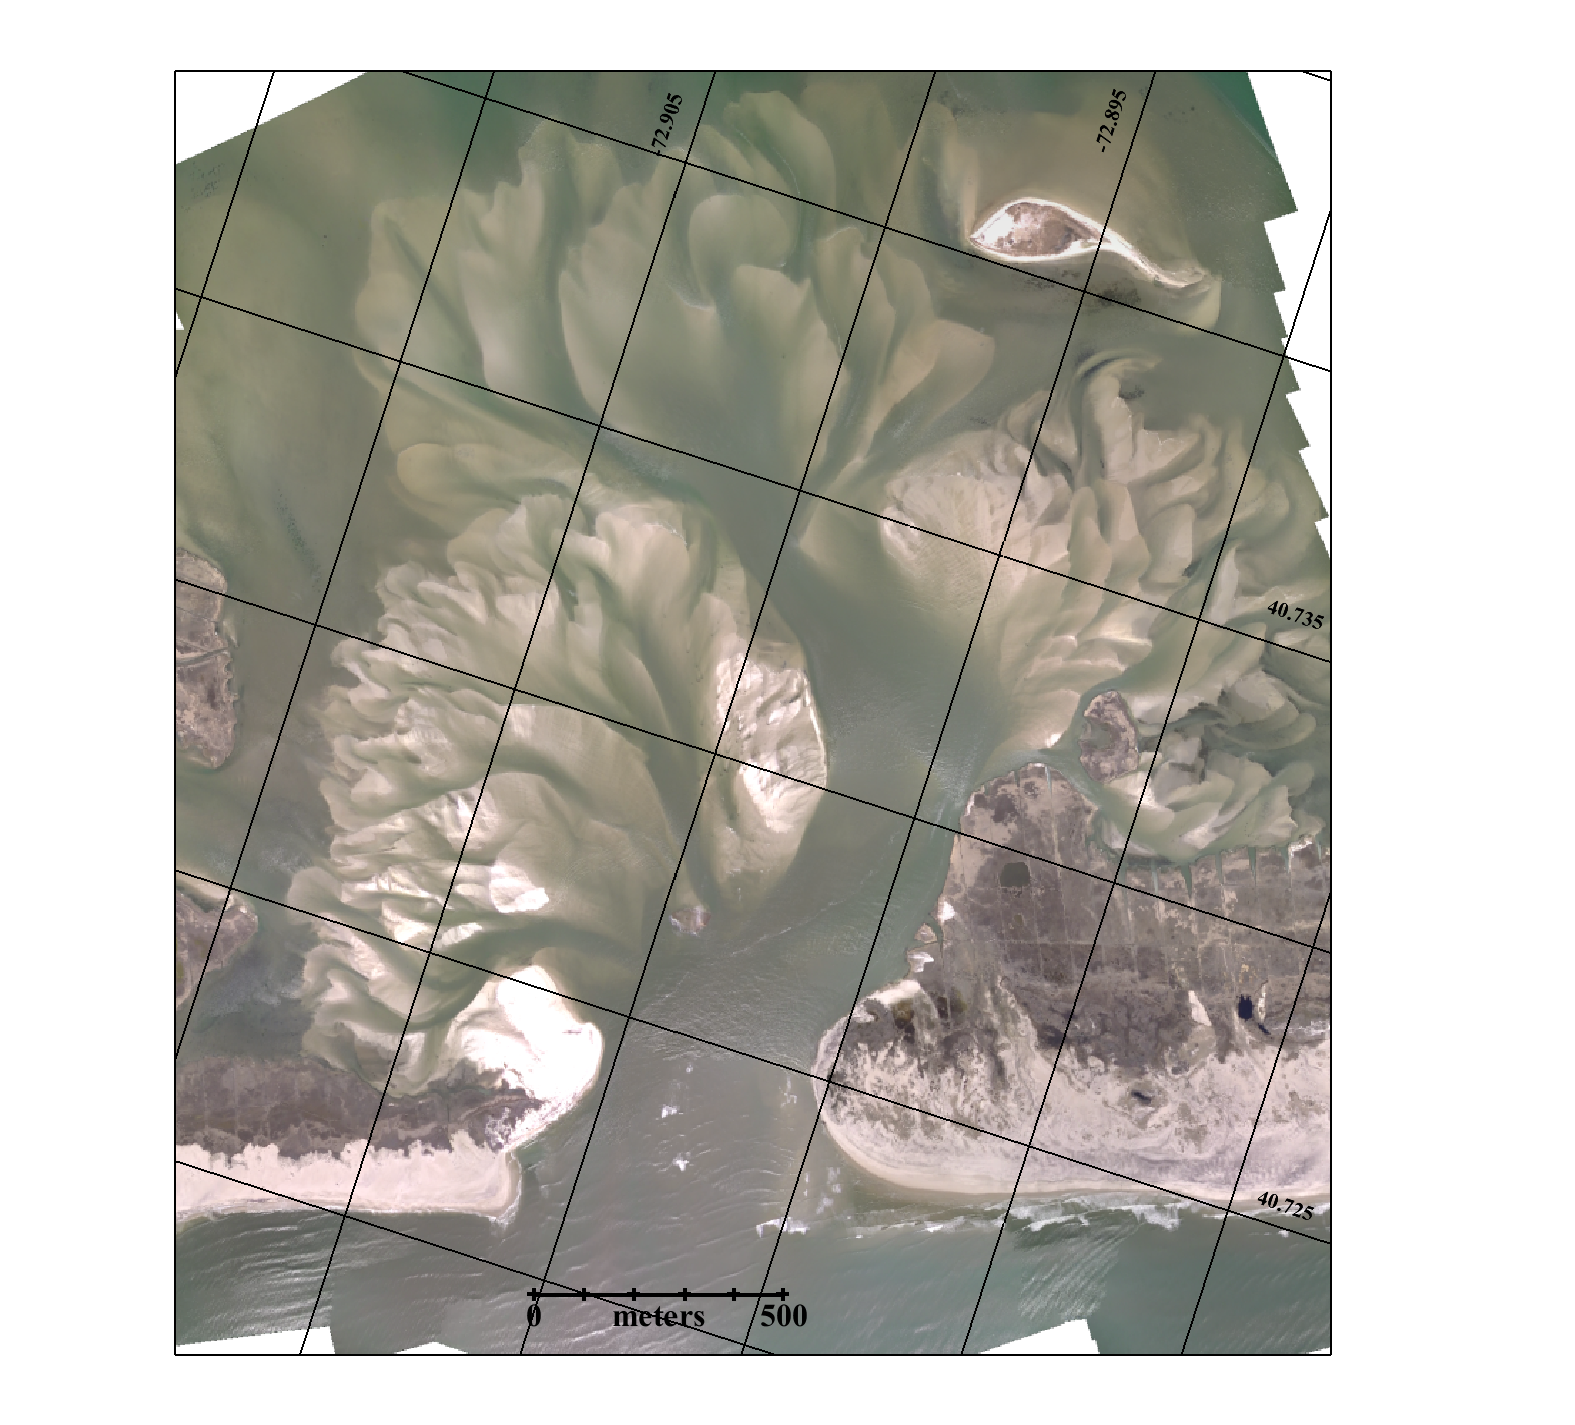
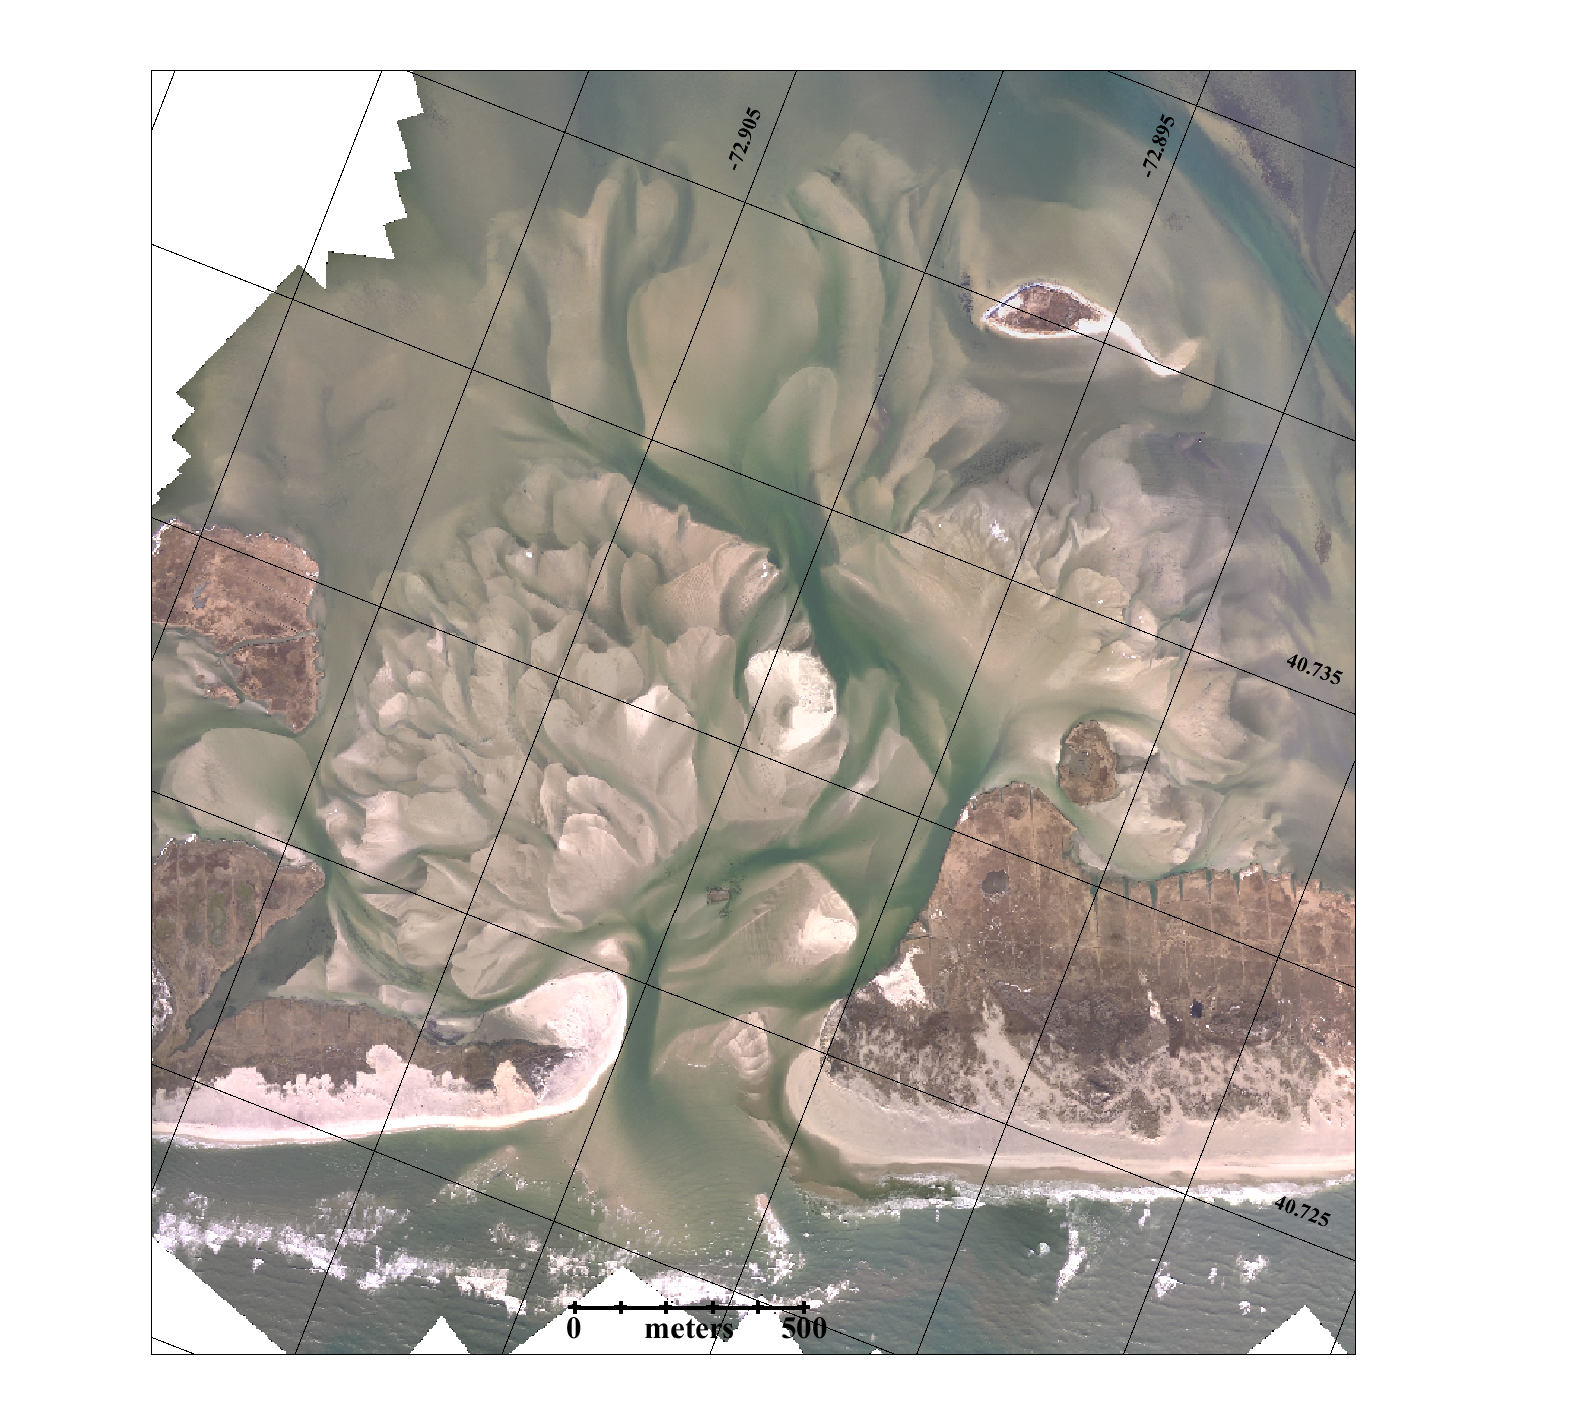
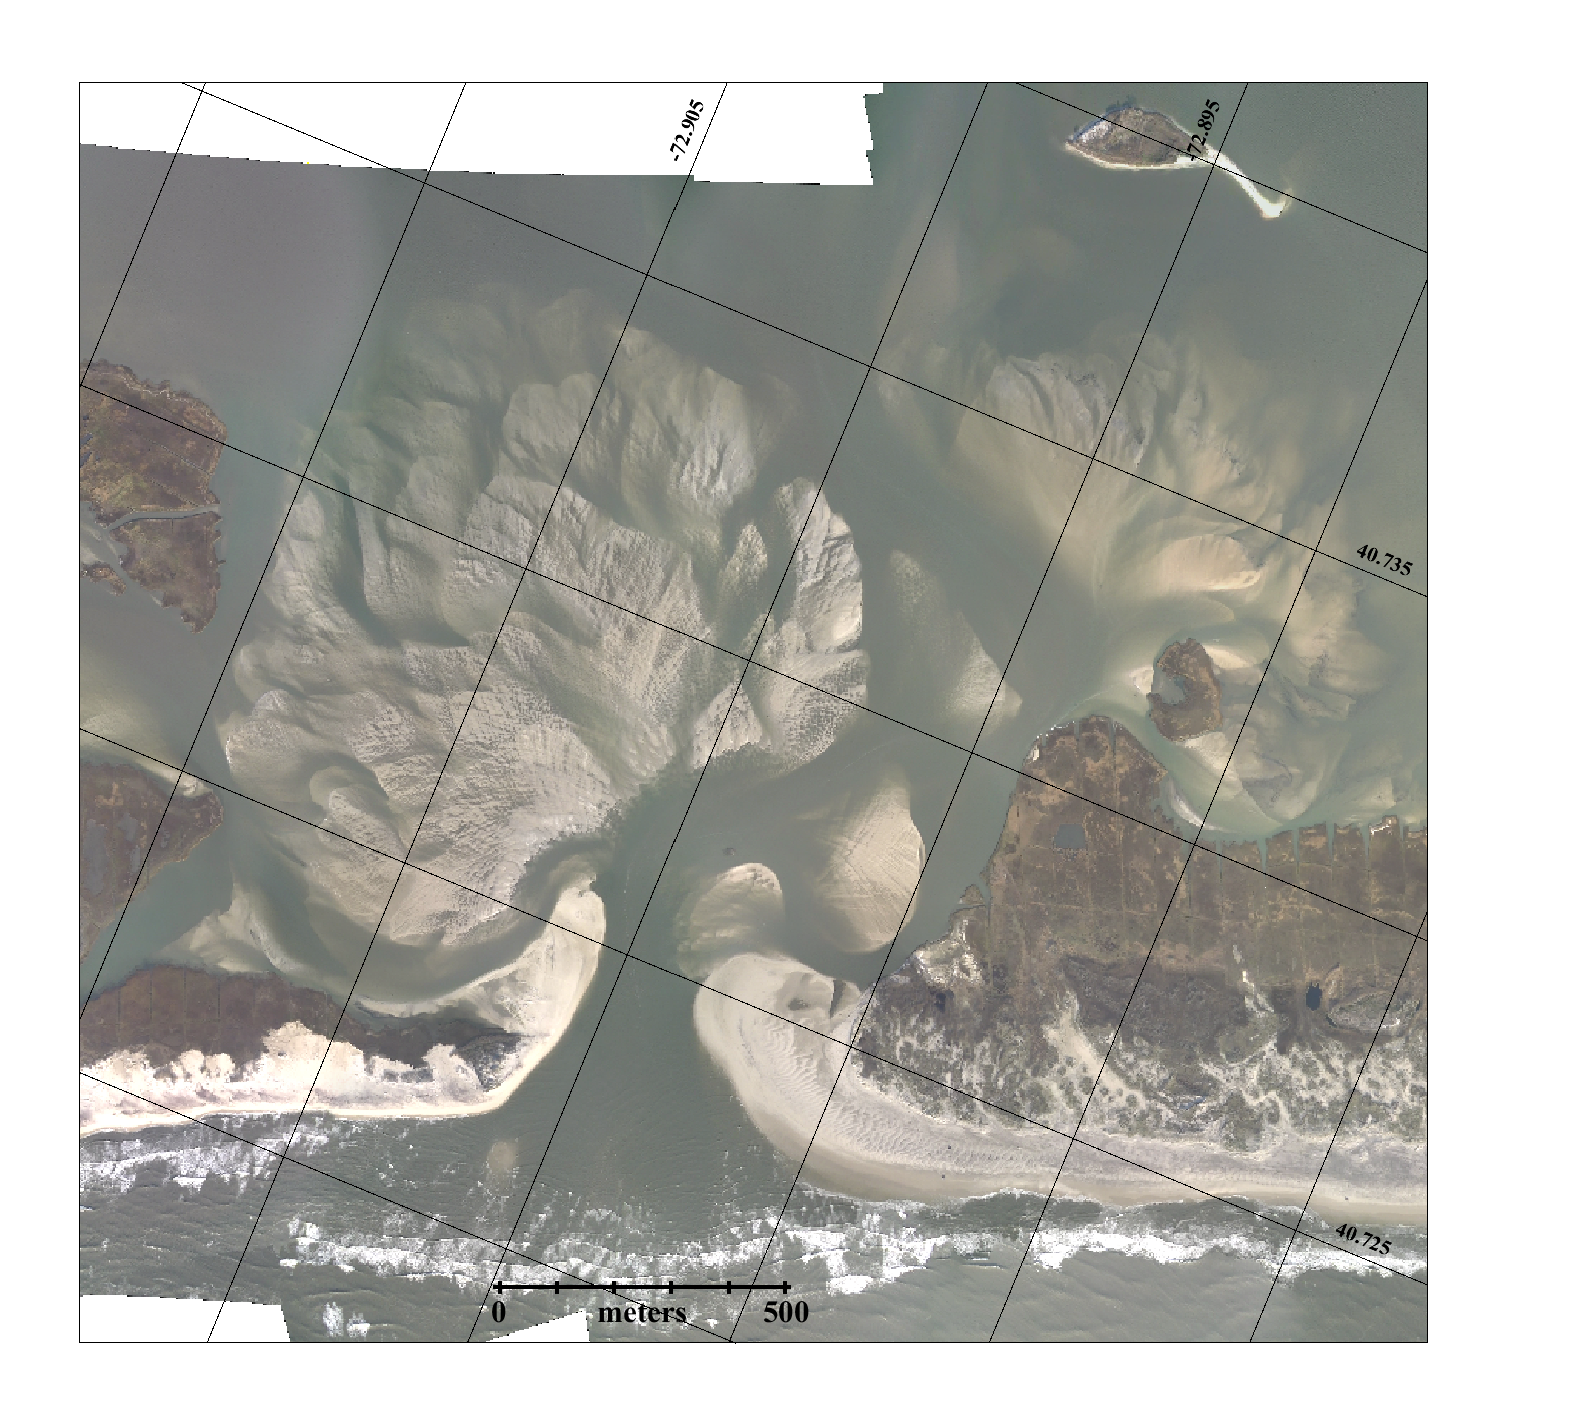
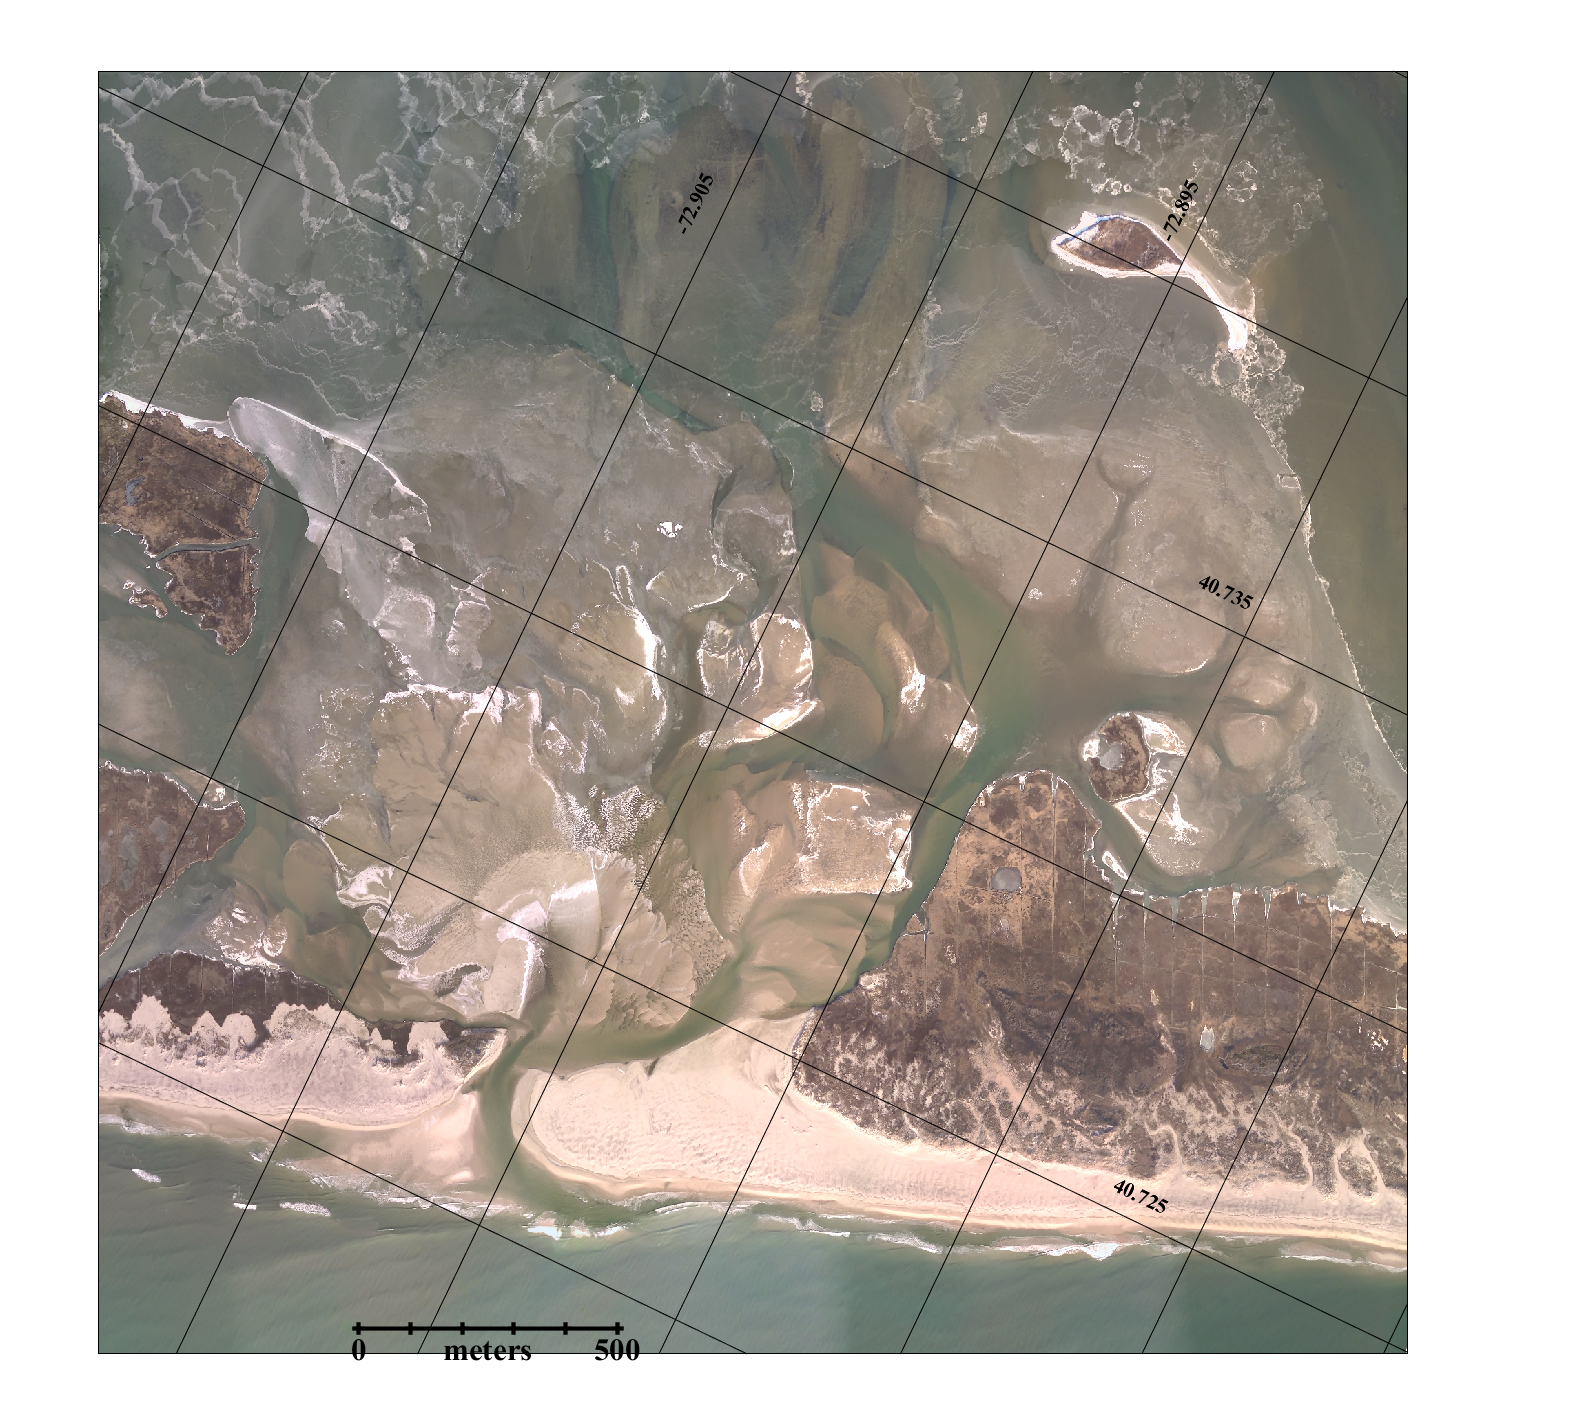
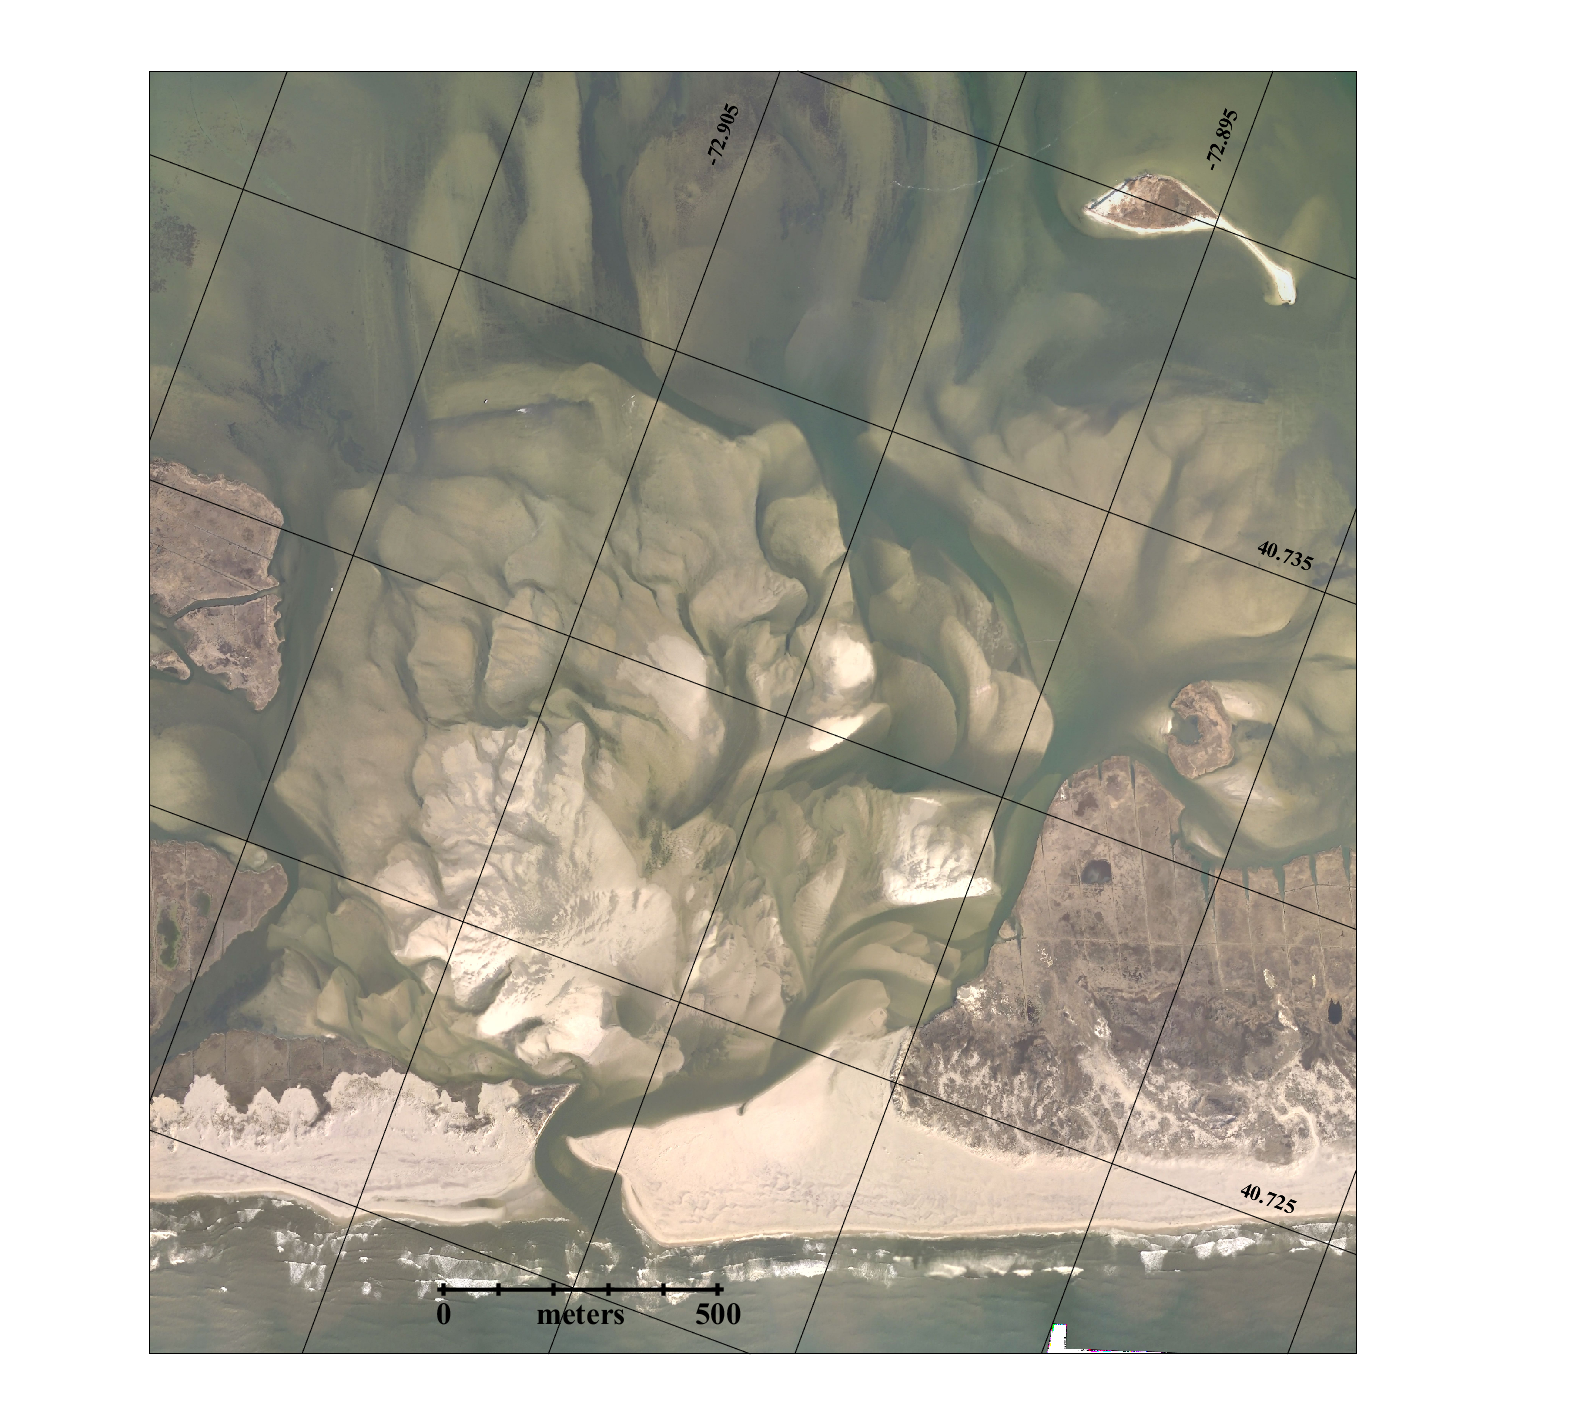
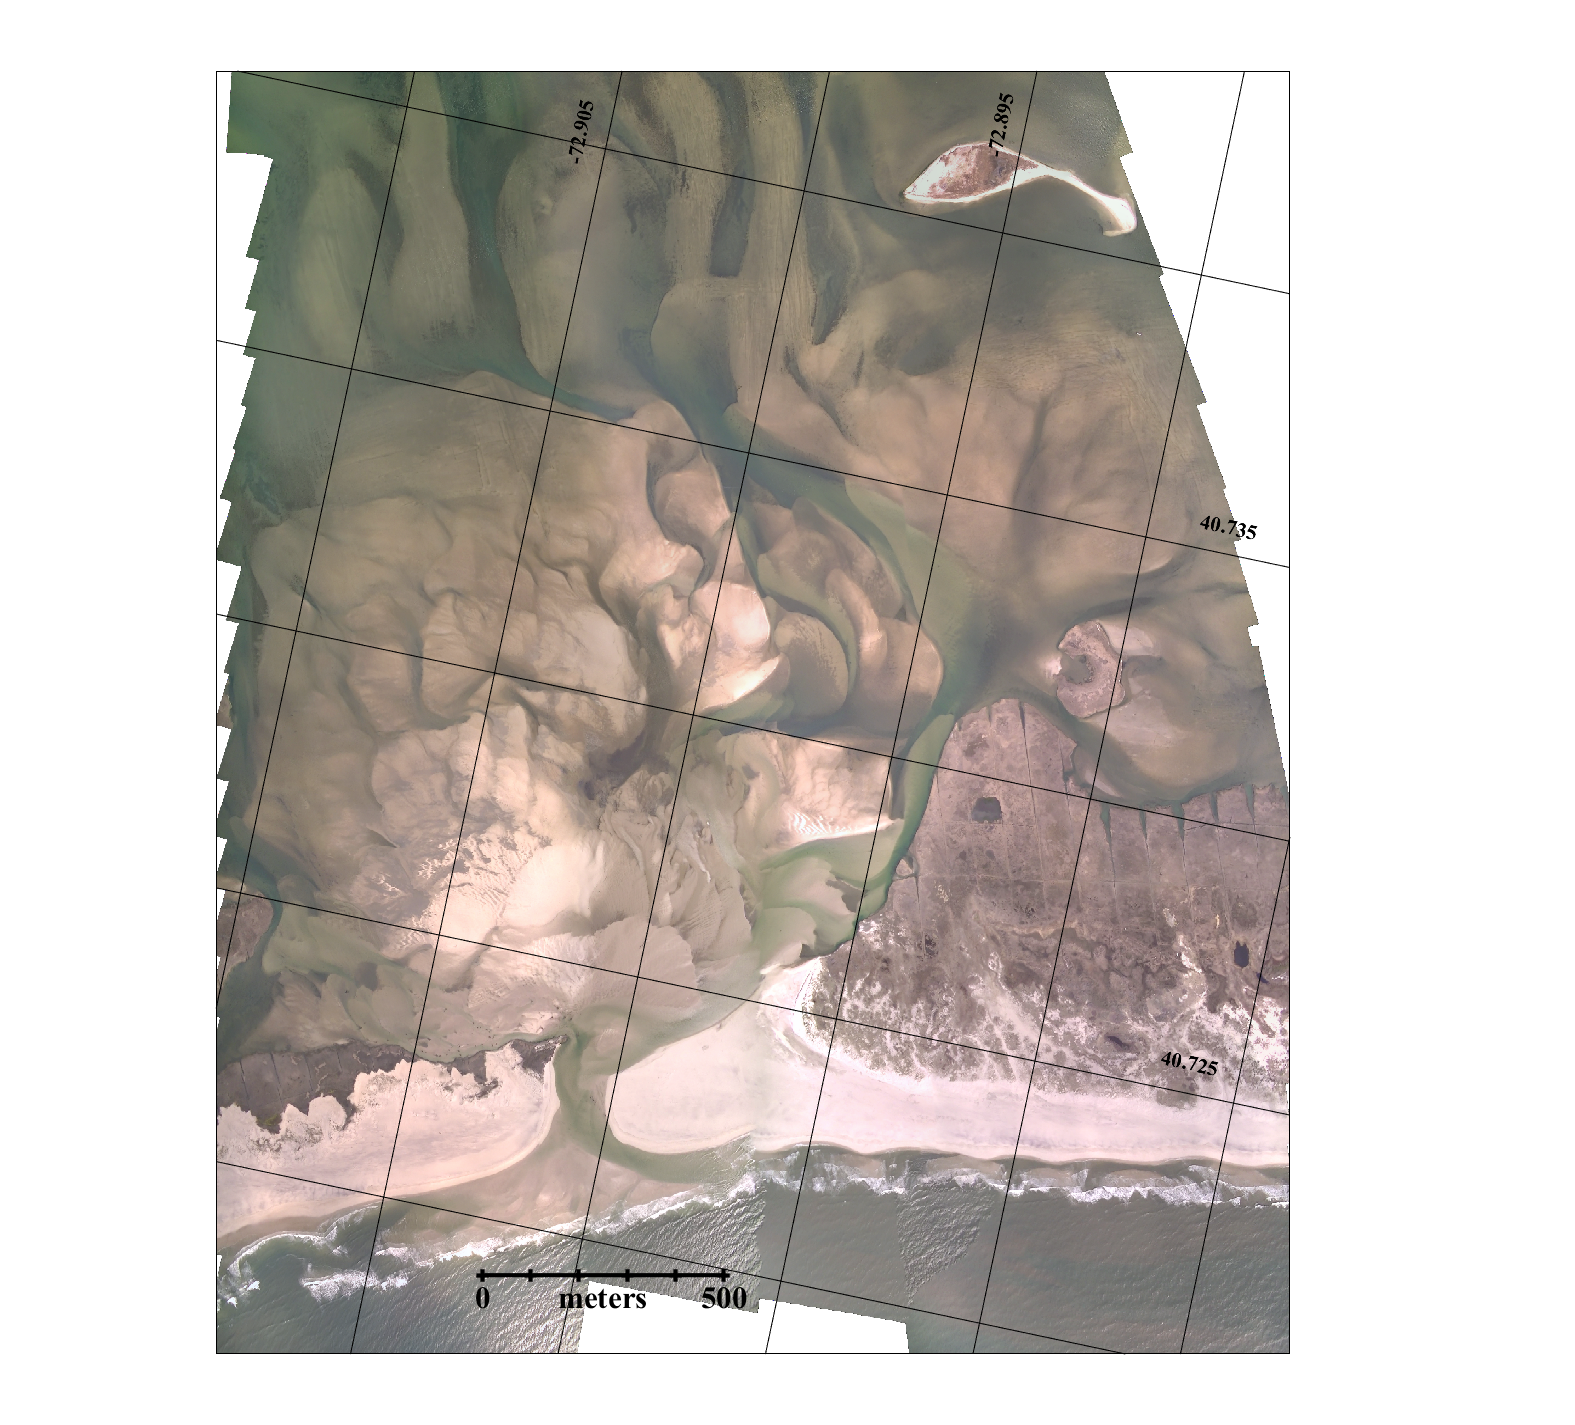
| Hurricane Sandy caused significant over washes and
three breaches in Fire Island in the area between the
historic Old Inlet area and Moriches Inlet. Aerial
video and photos were obtained Saturday, November 3rd, 5
days after the storm's passage. A short description
and photos of the breaches is available here while youtube videos are
listed below. |
||
| https://www.youtube.com/watch?v=yqbMjXQjJ9Y https://www.youtube.com/watch?v=joDI6ftKsxA https://www.youtube.com/watch?v=VbxrjOqnYFA https://www.youtube.com/watch?v=_UQWDLYgYMg |
||
|
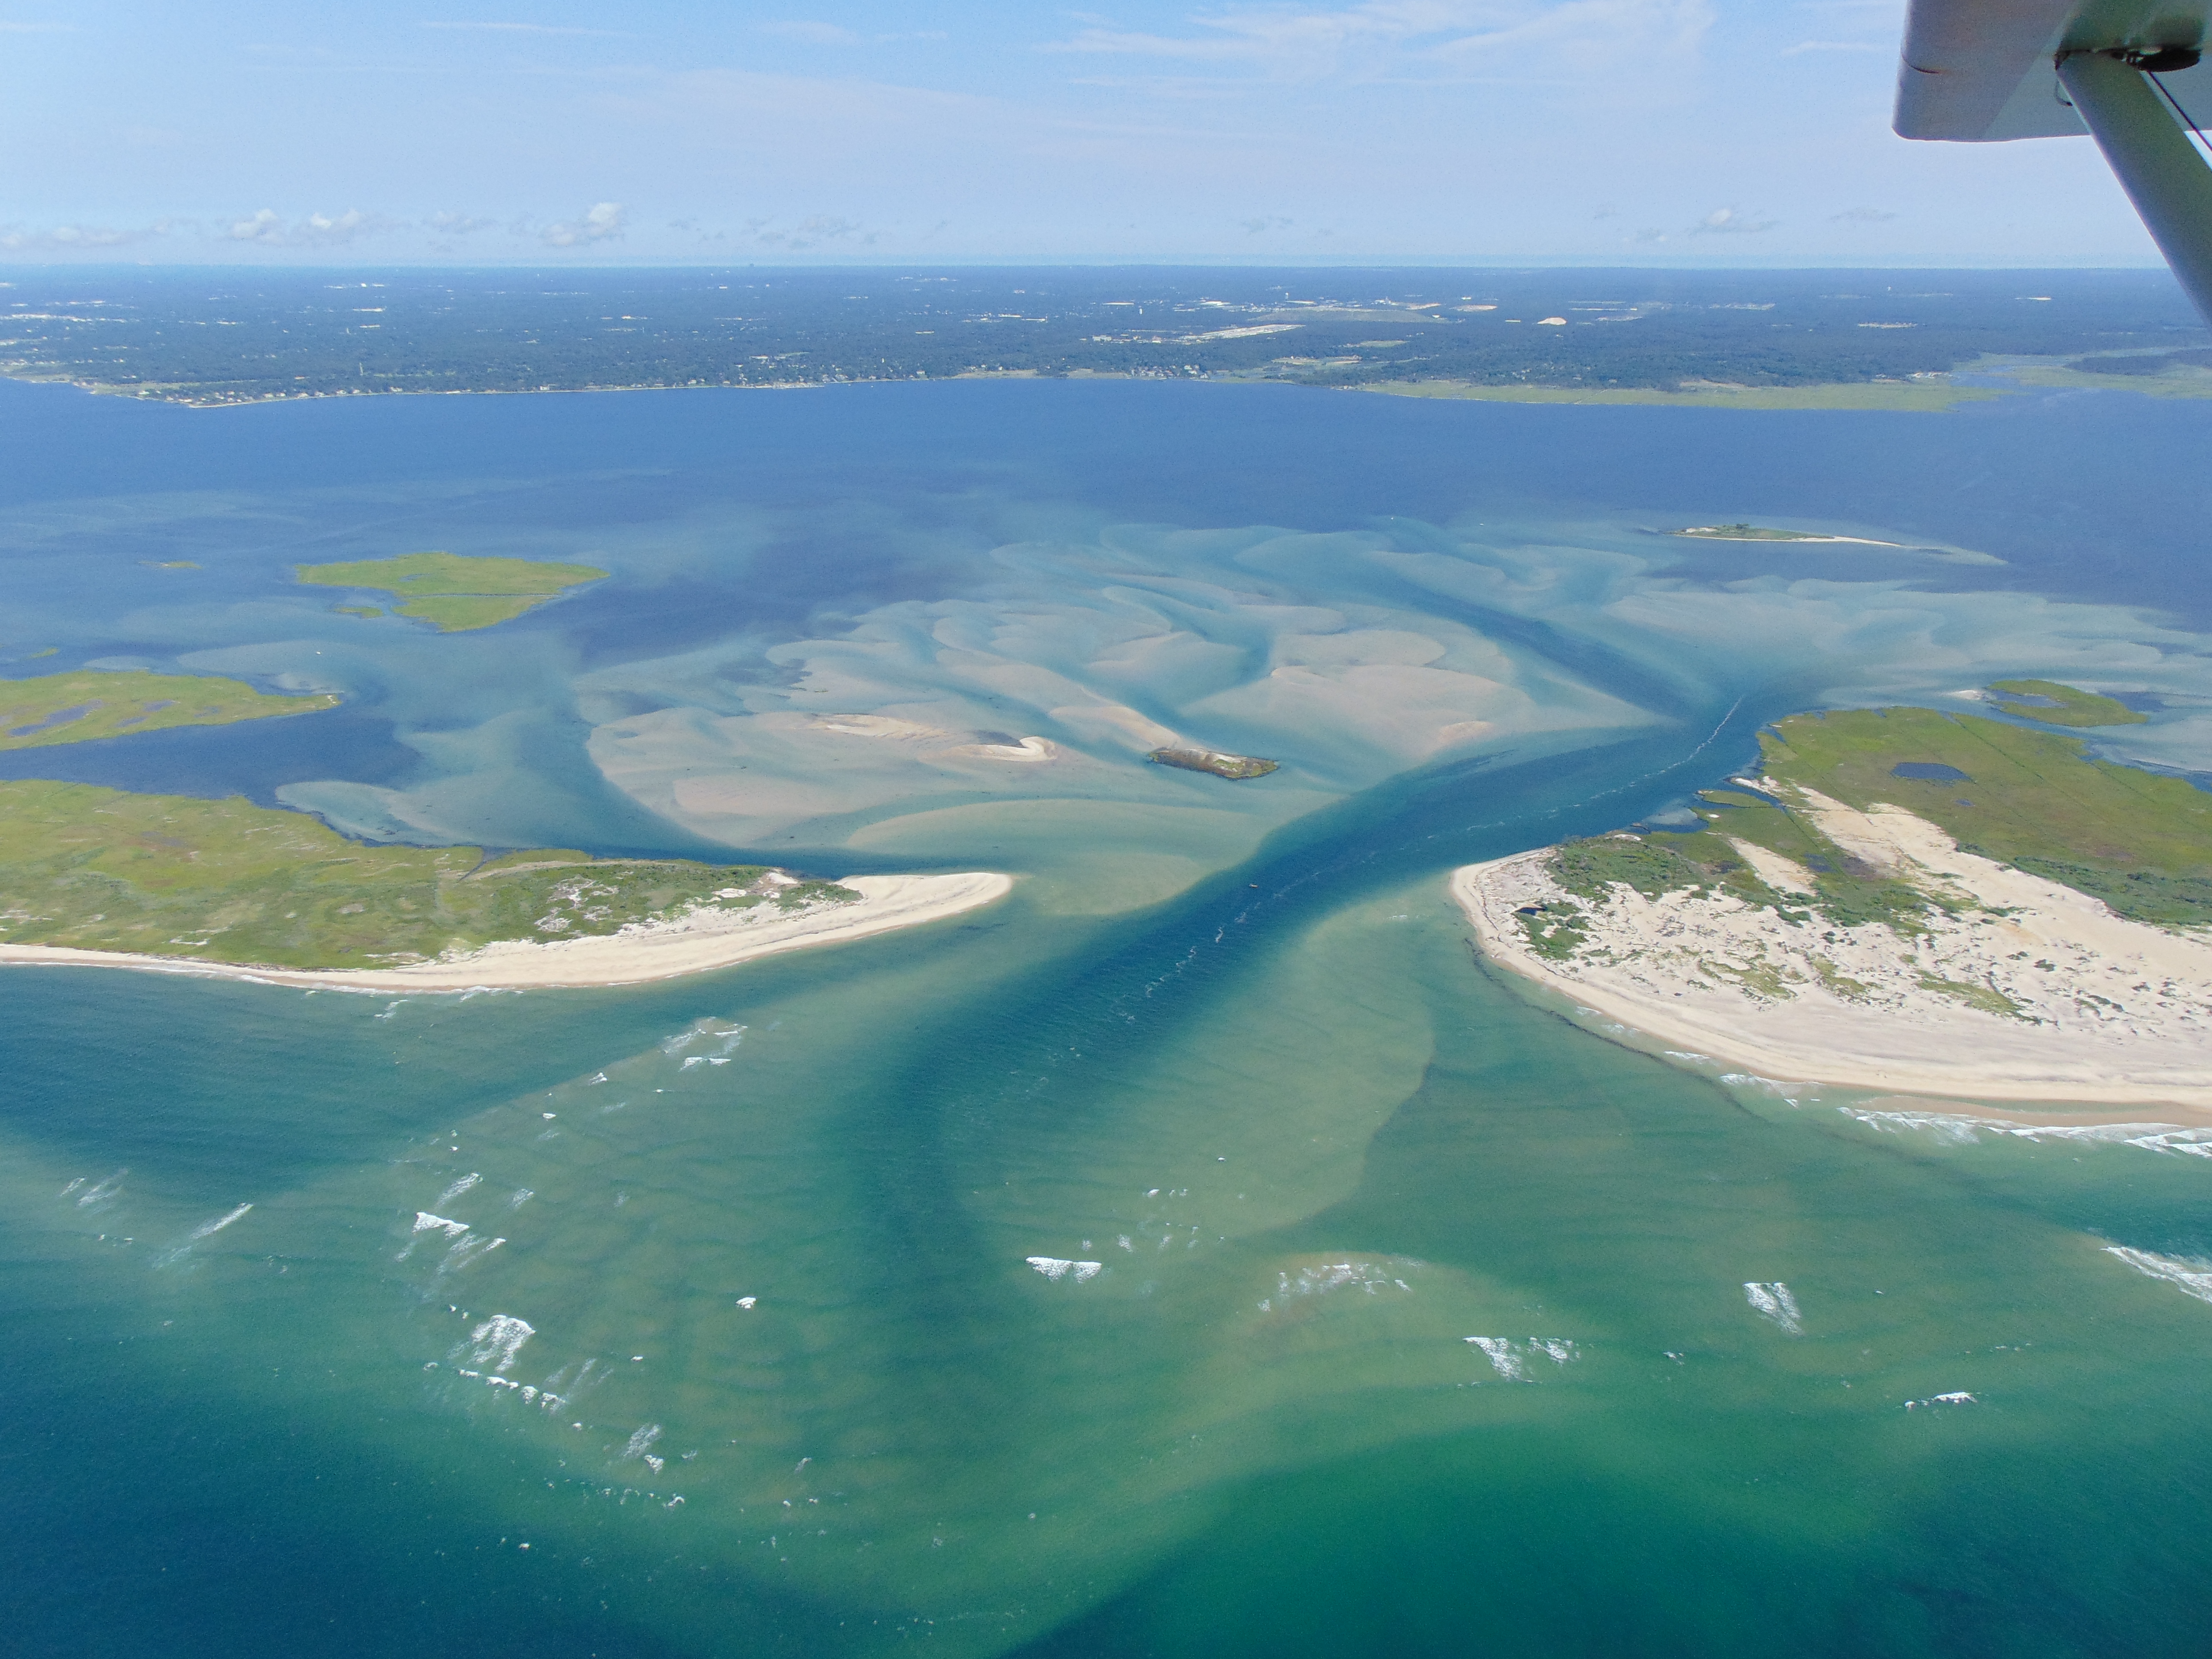
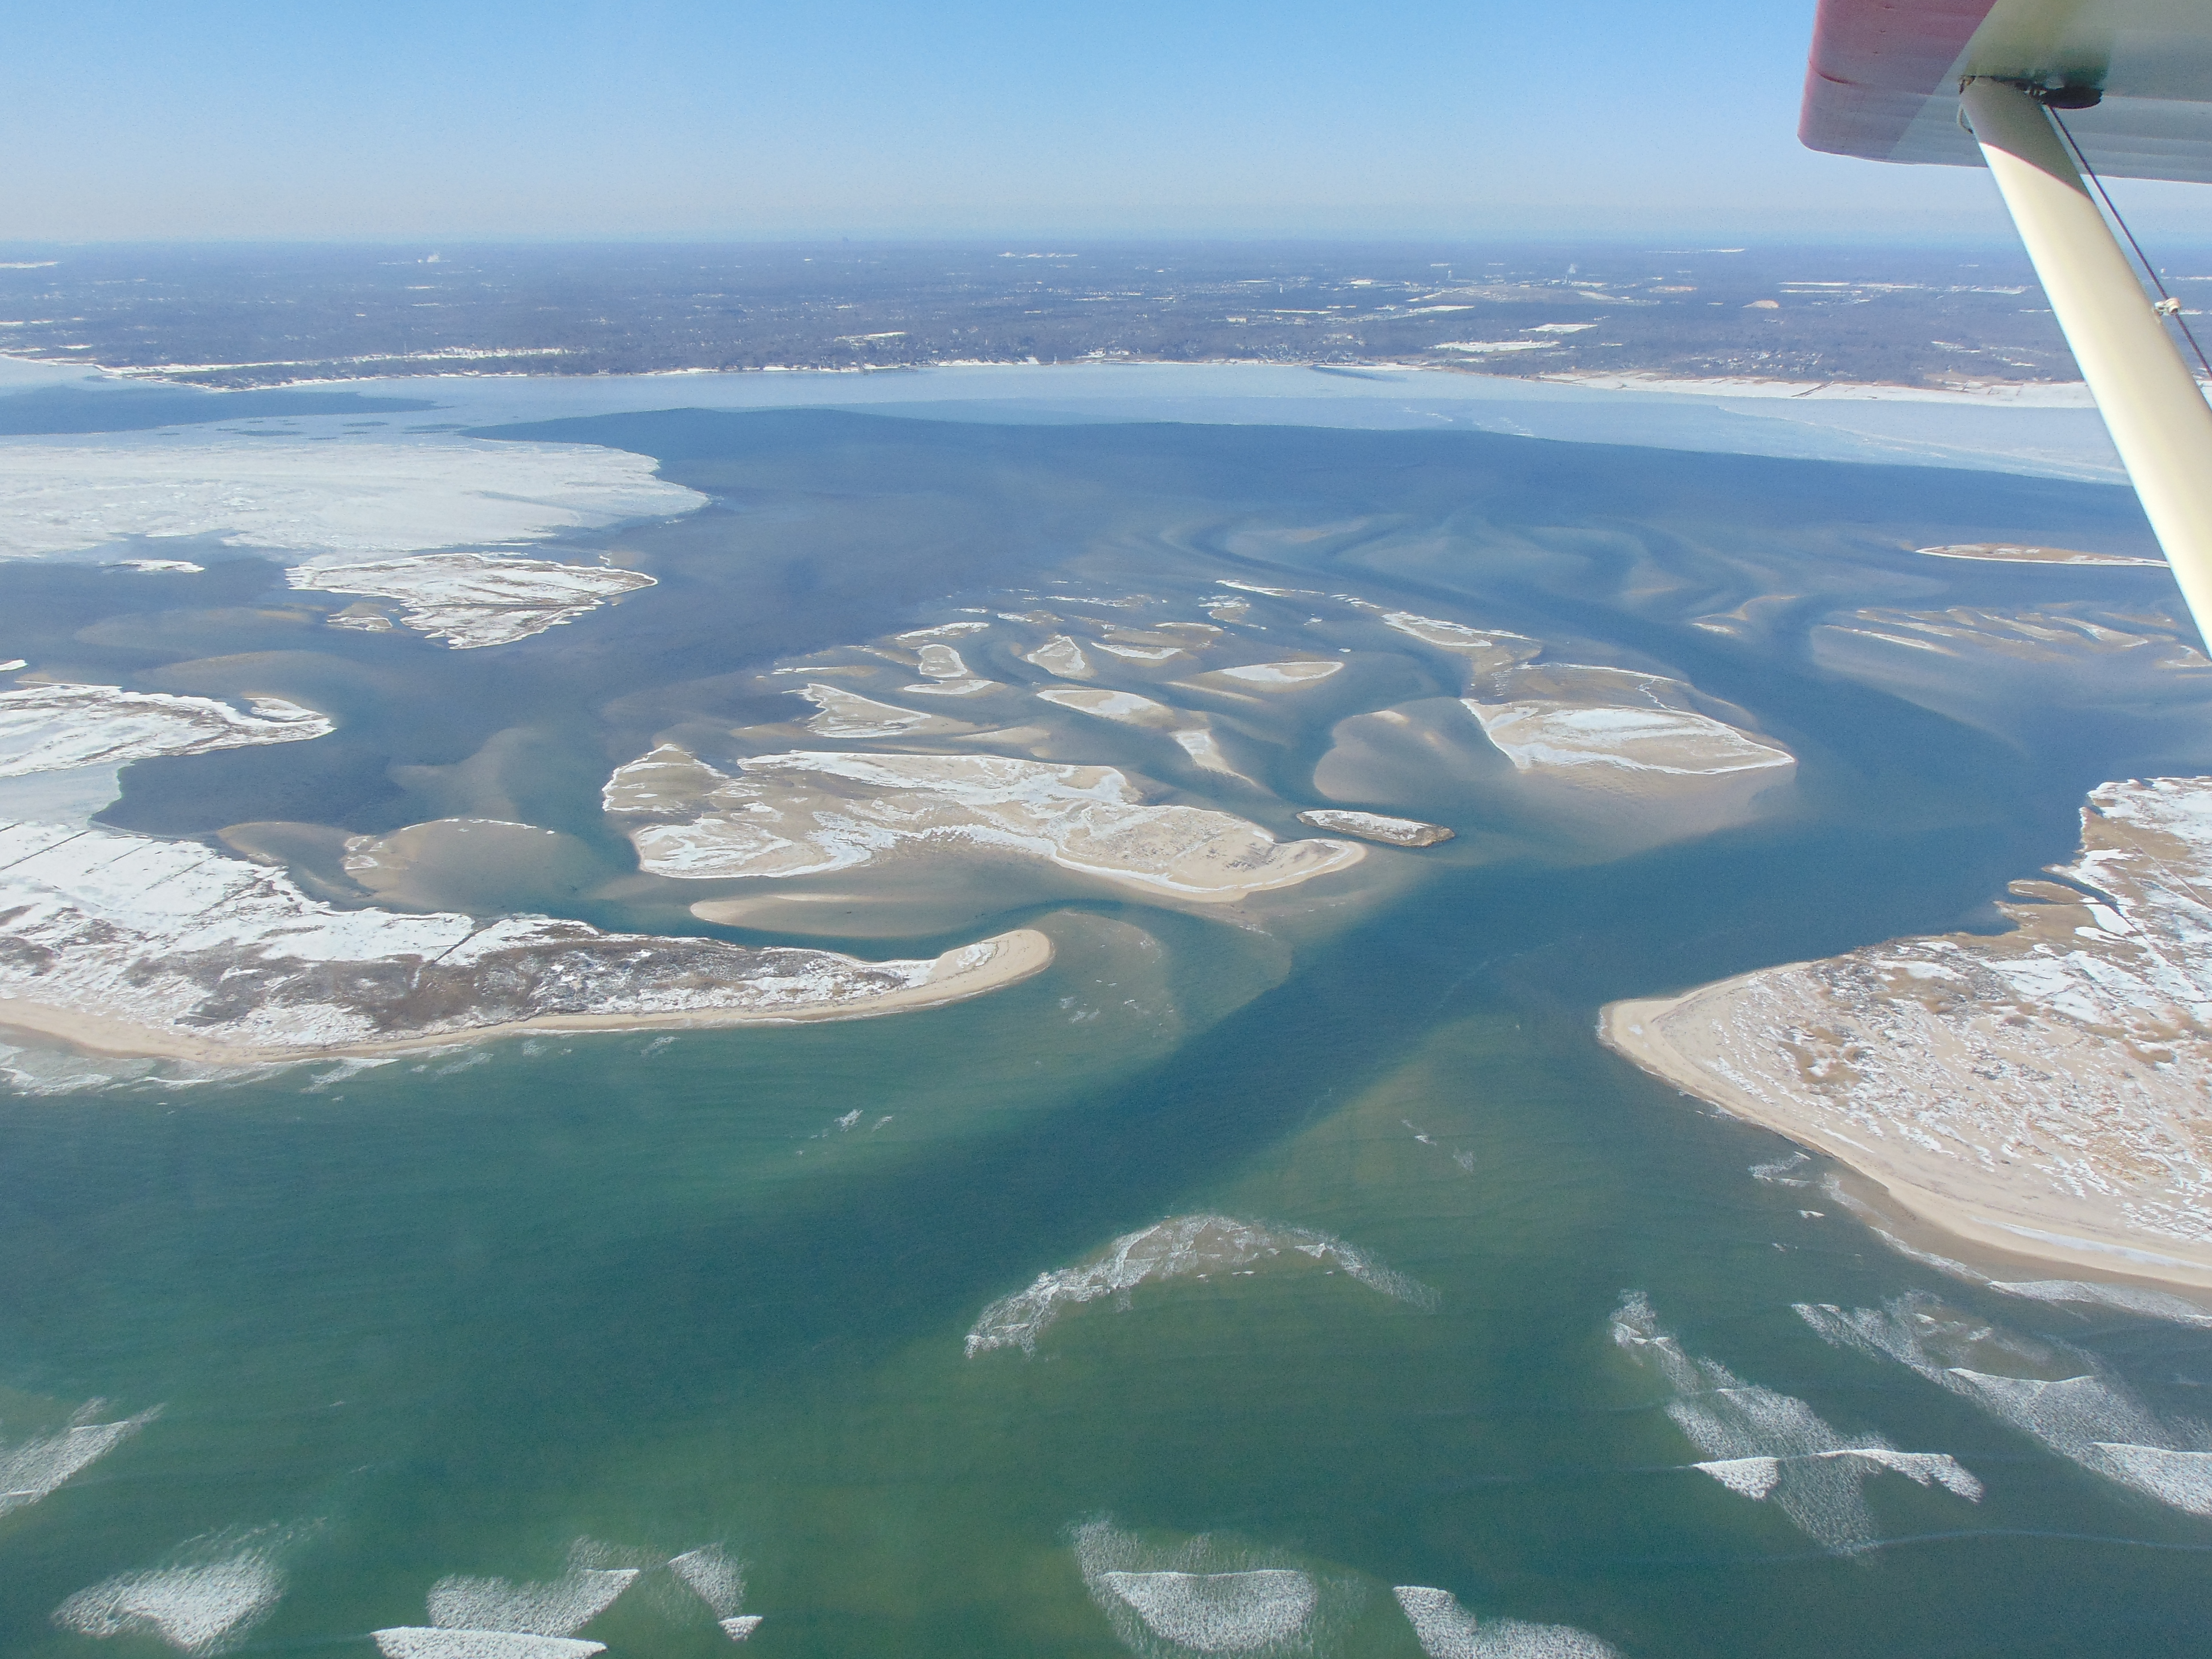
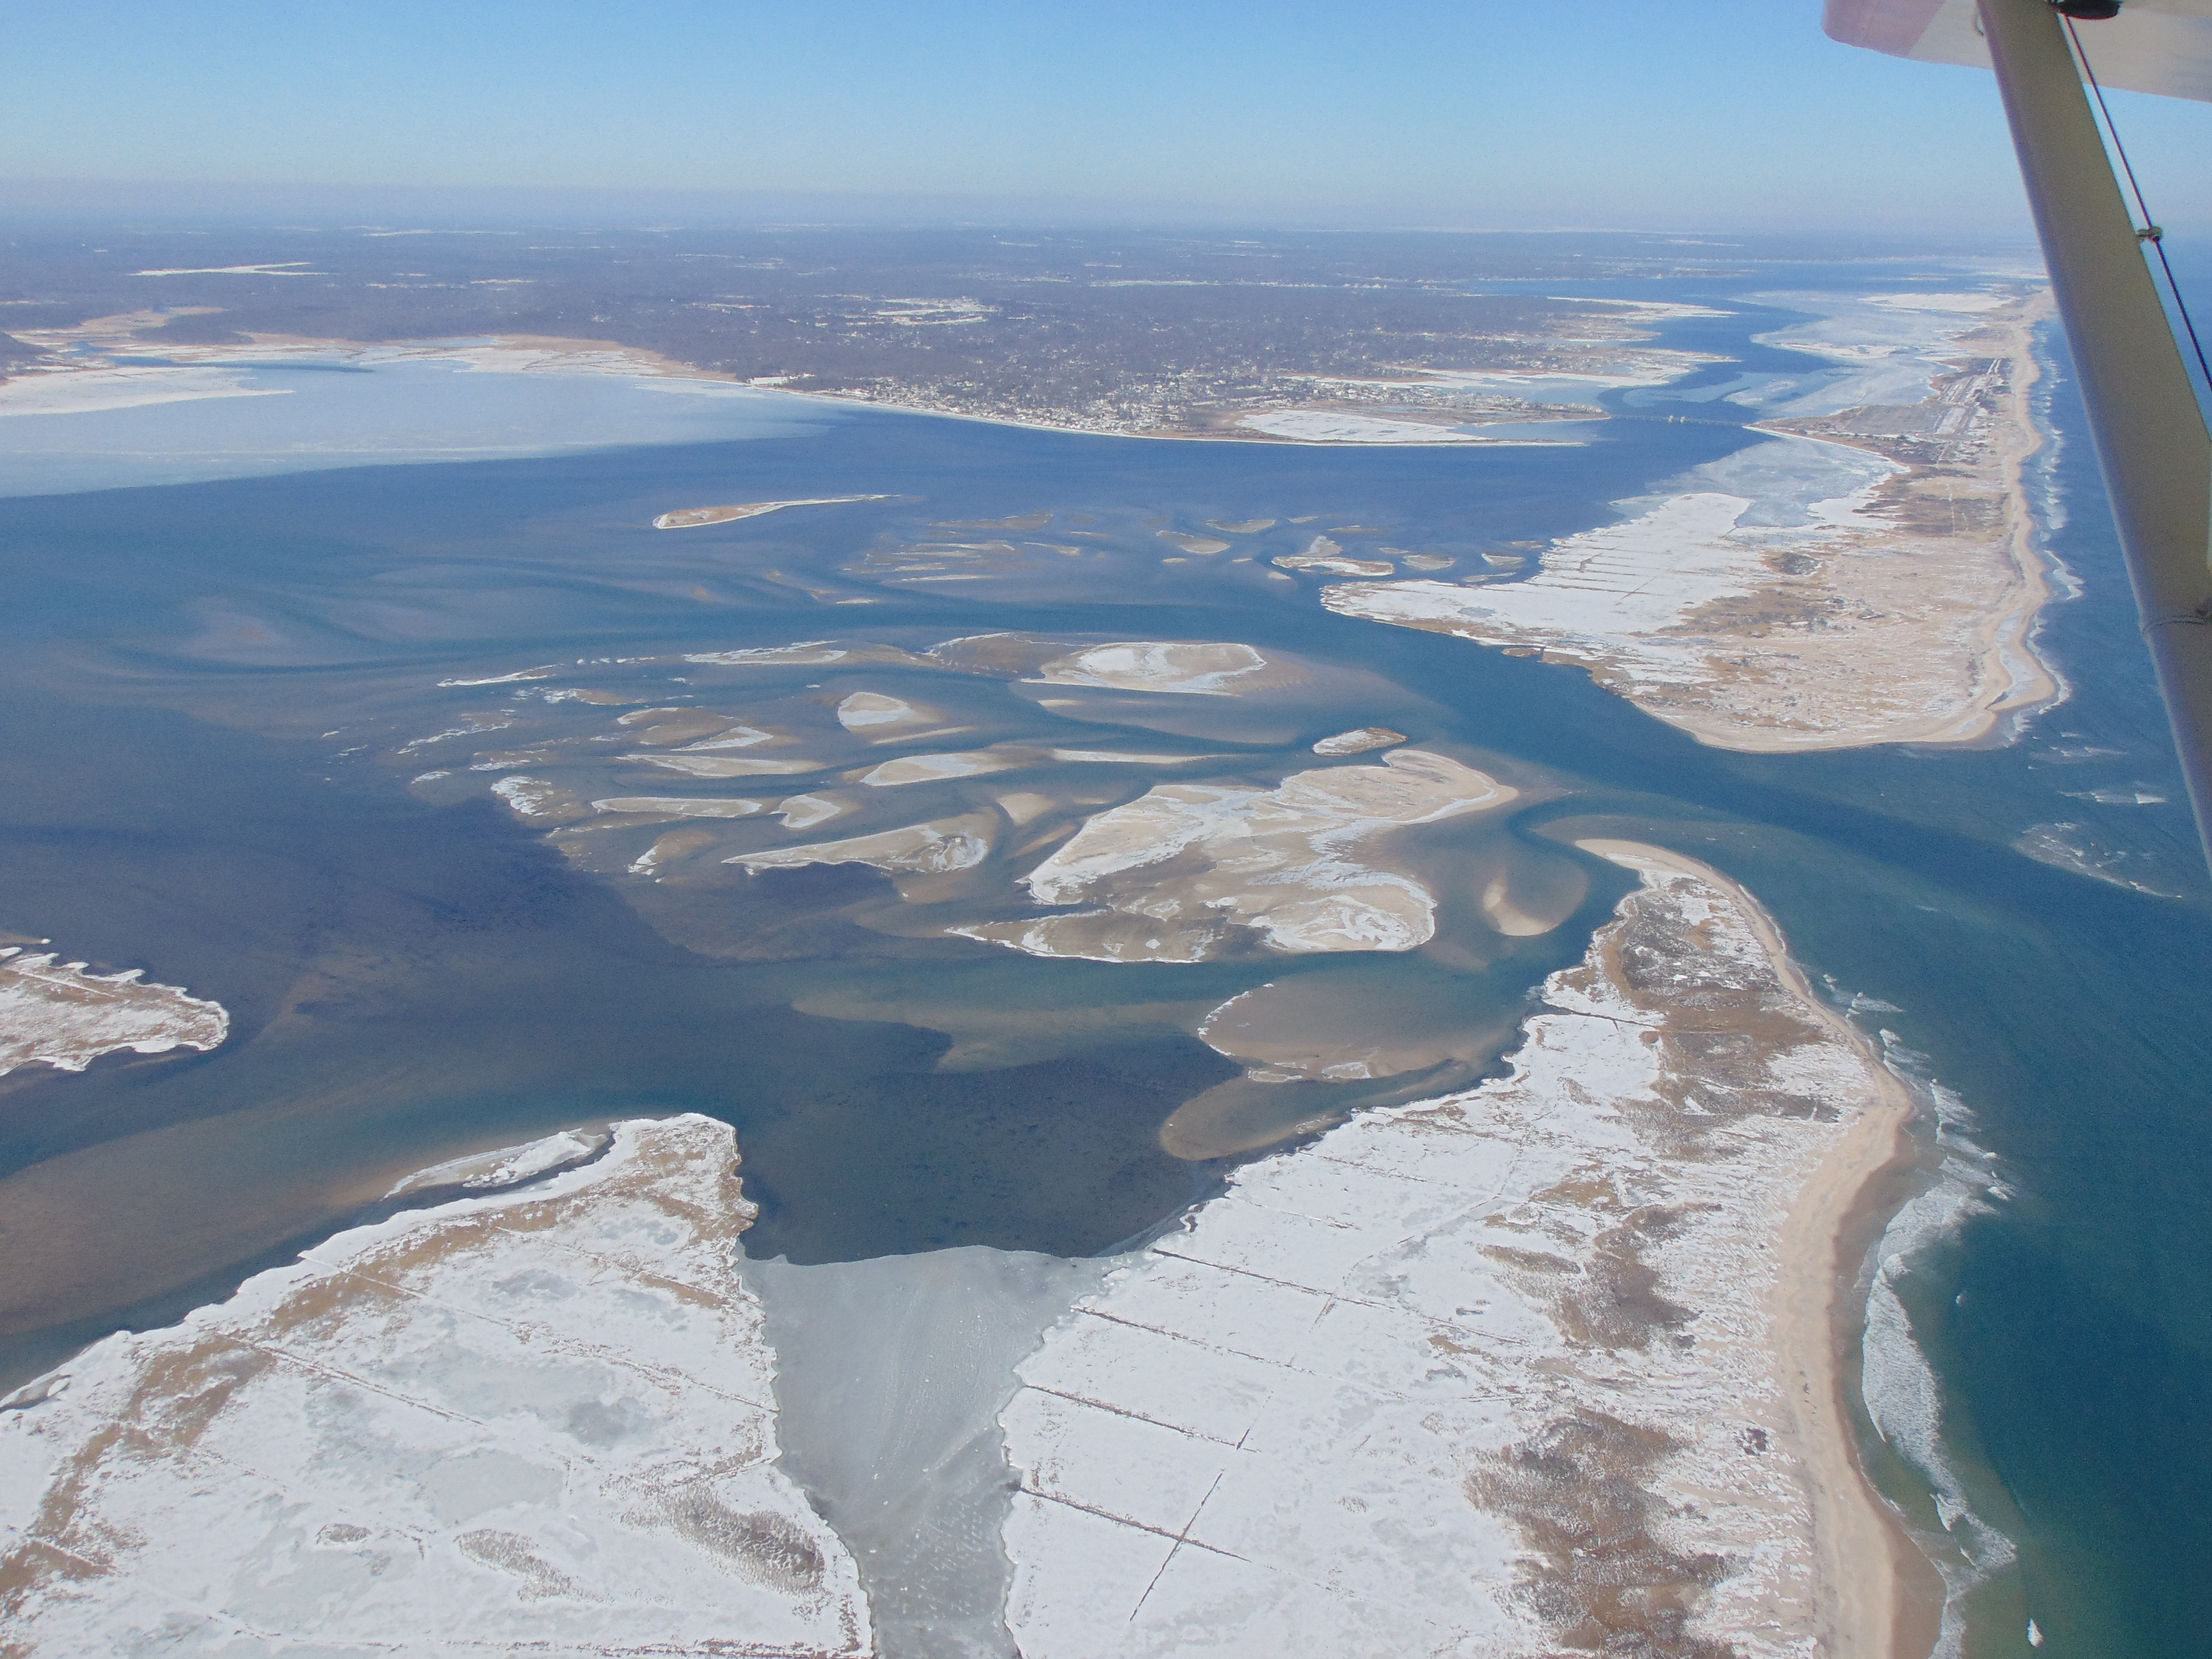
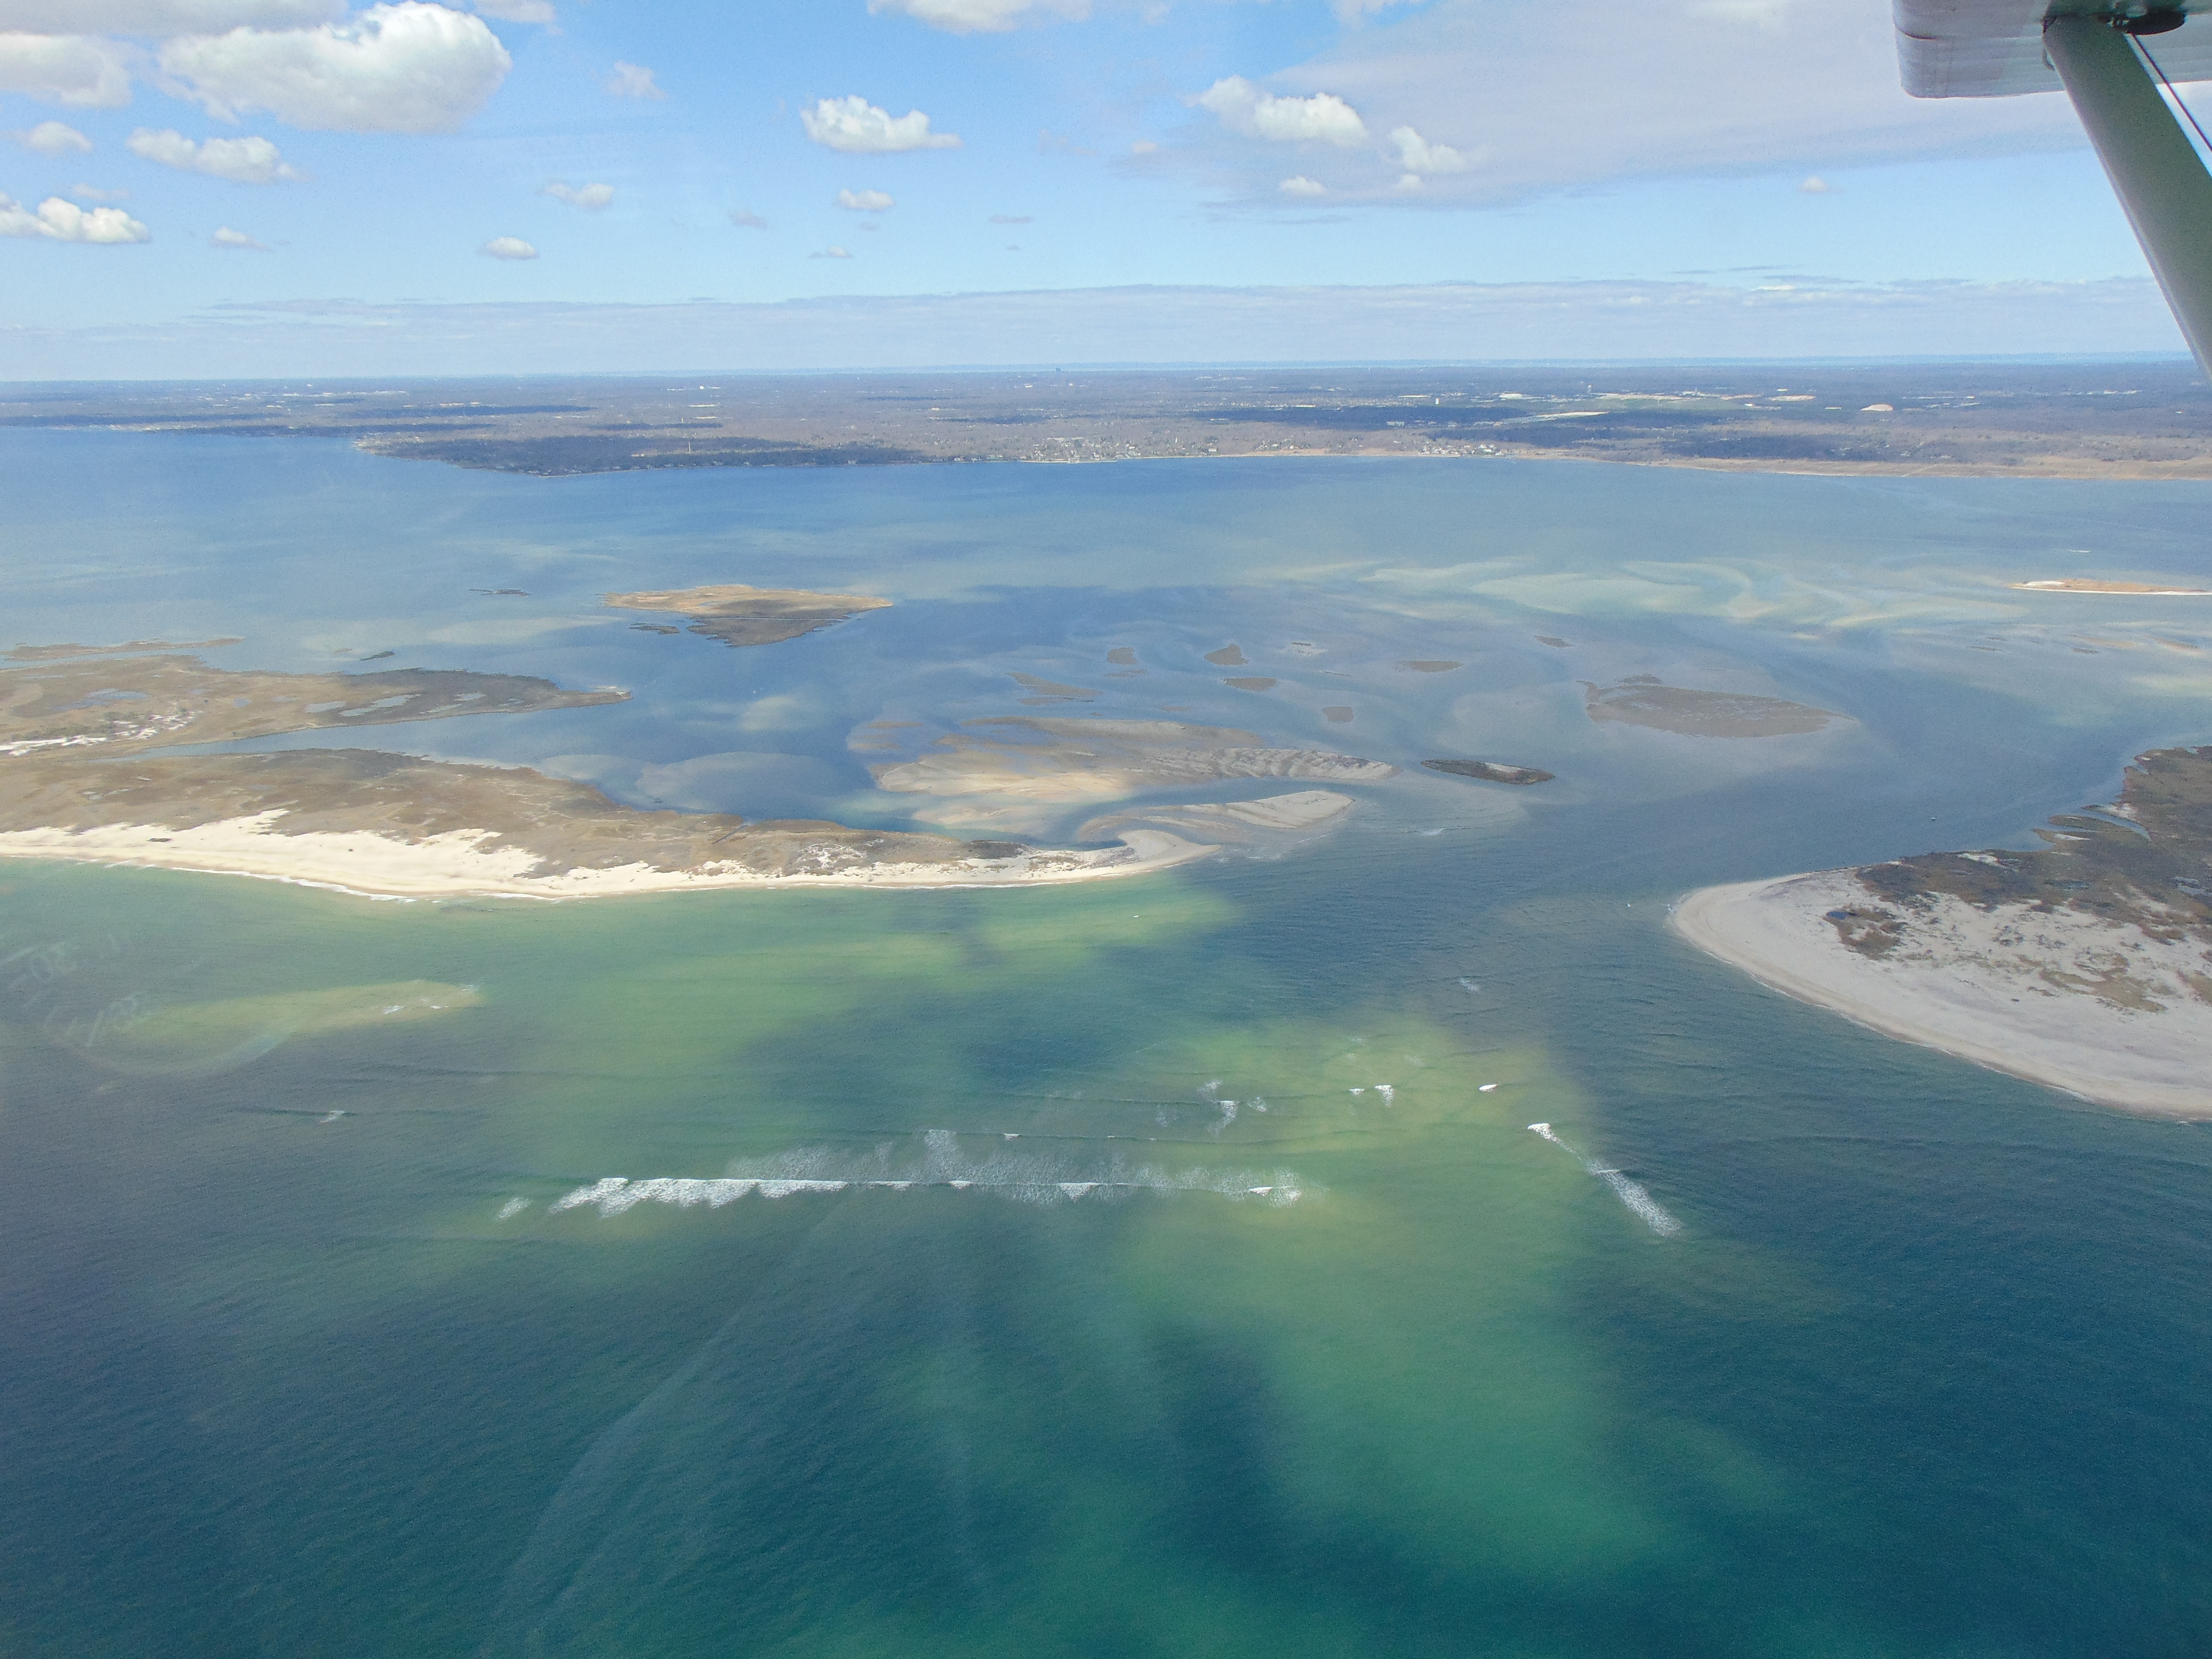
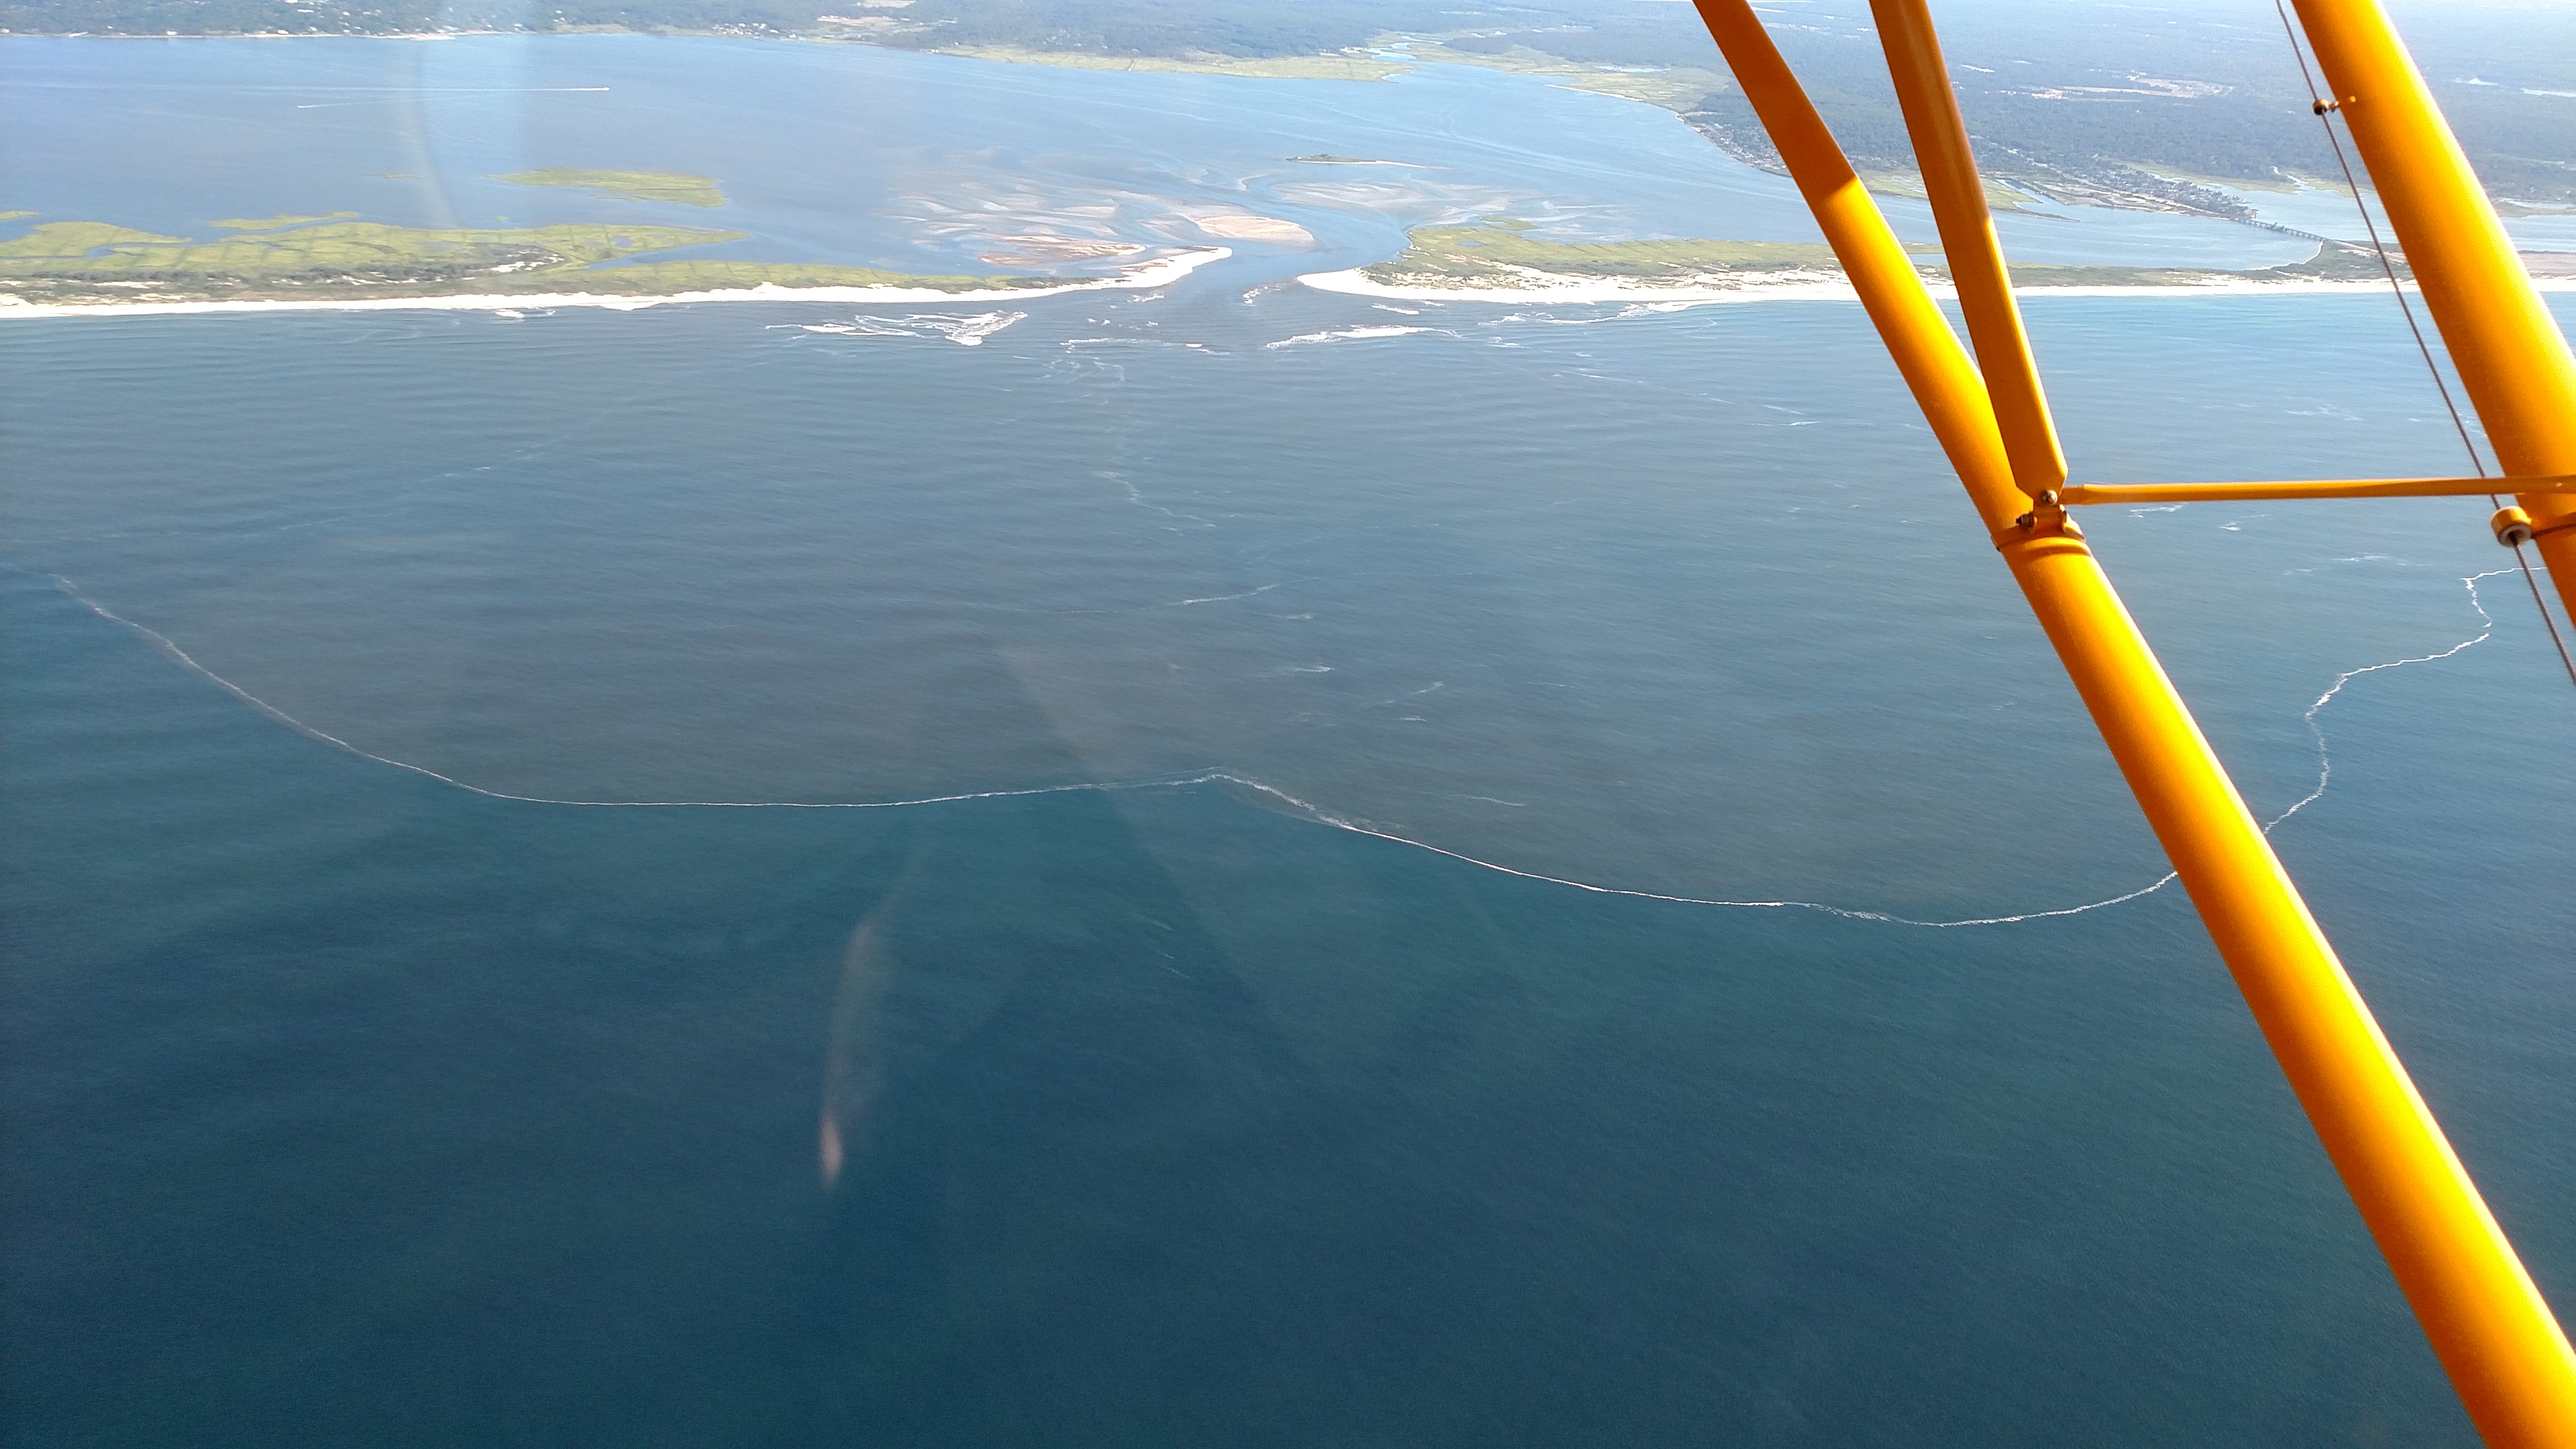
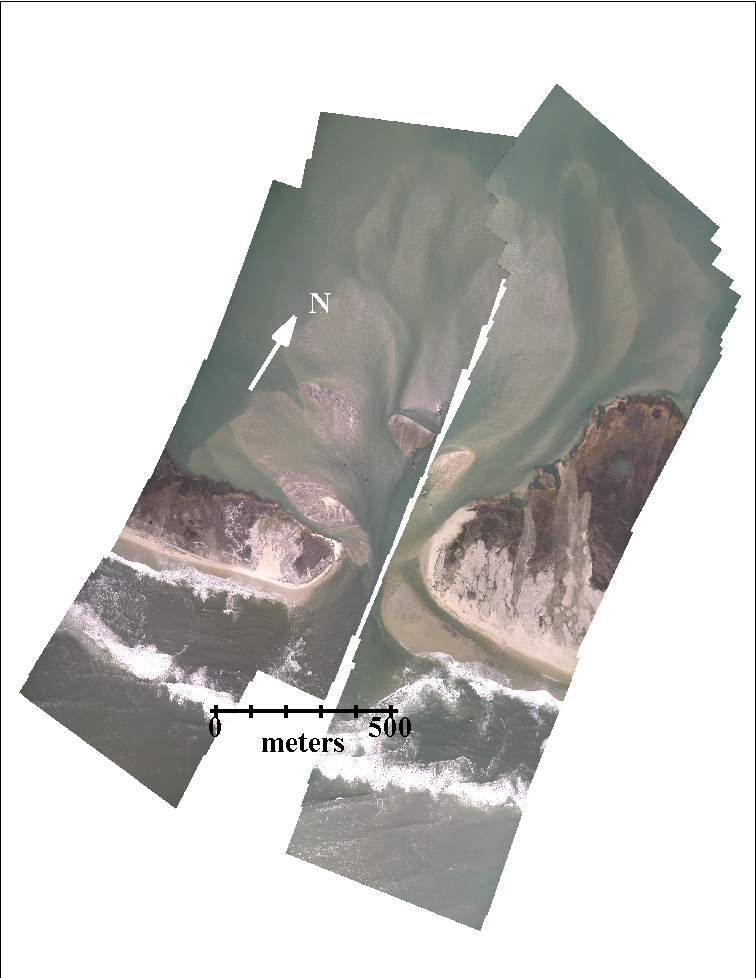
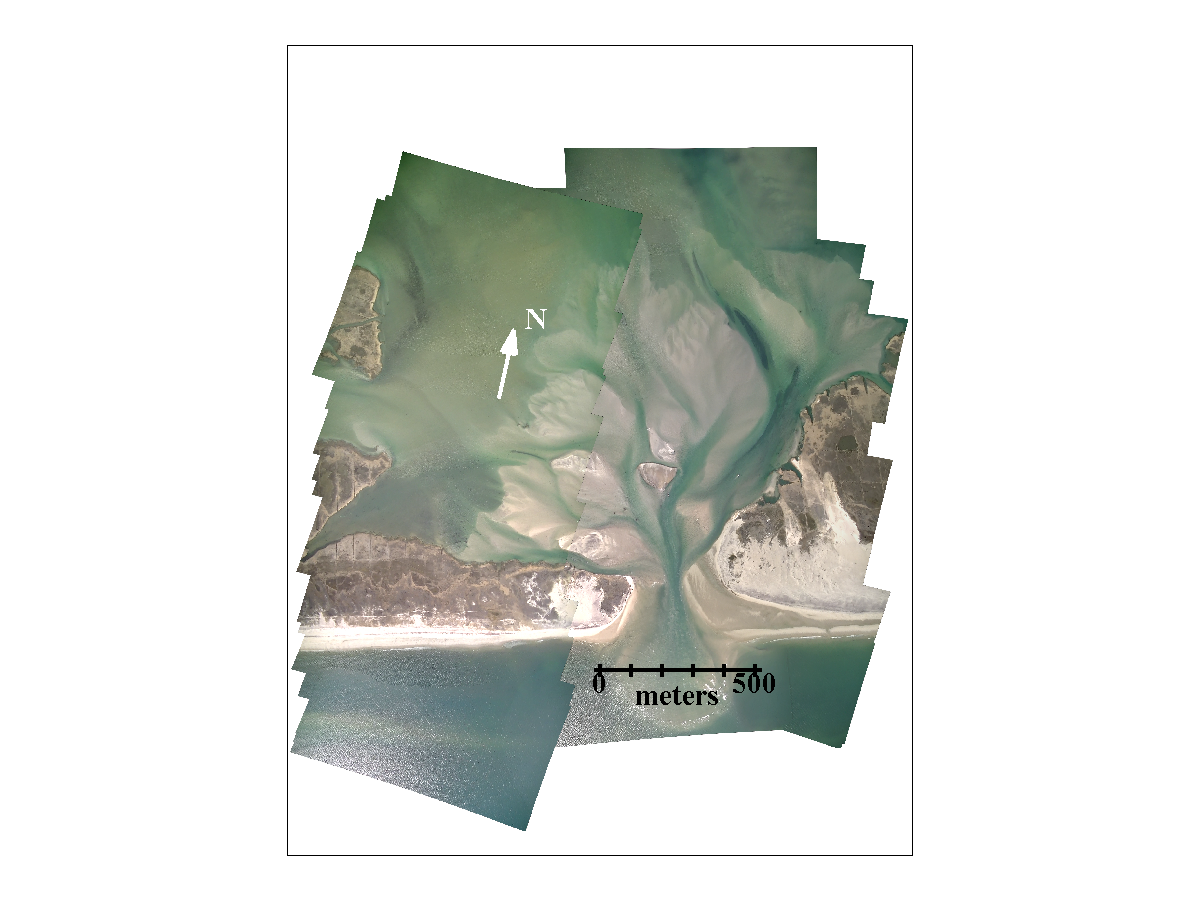
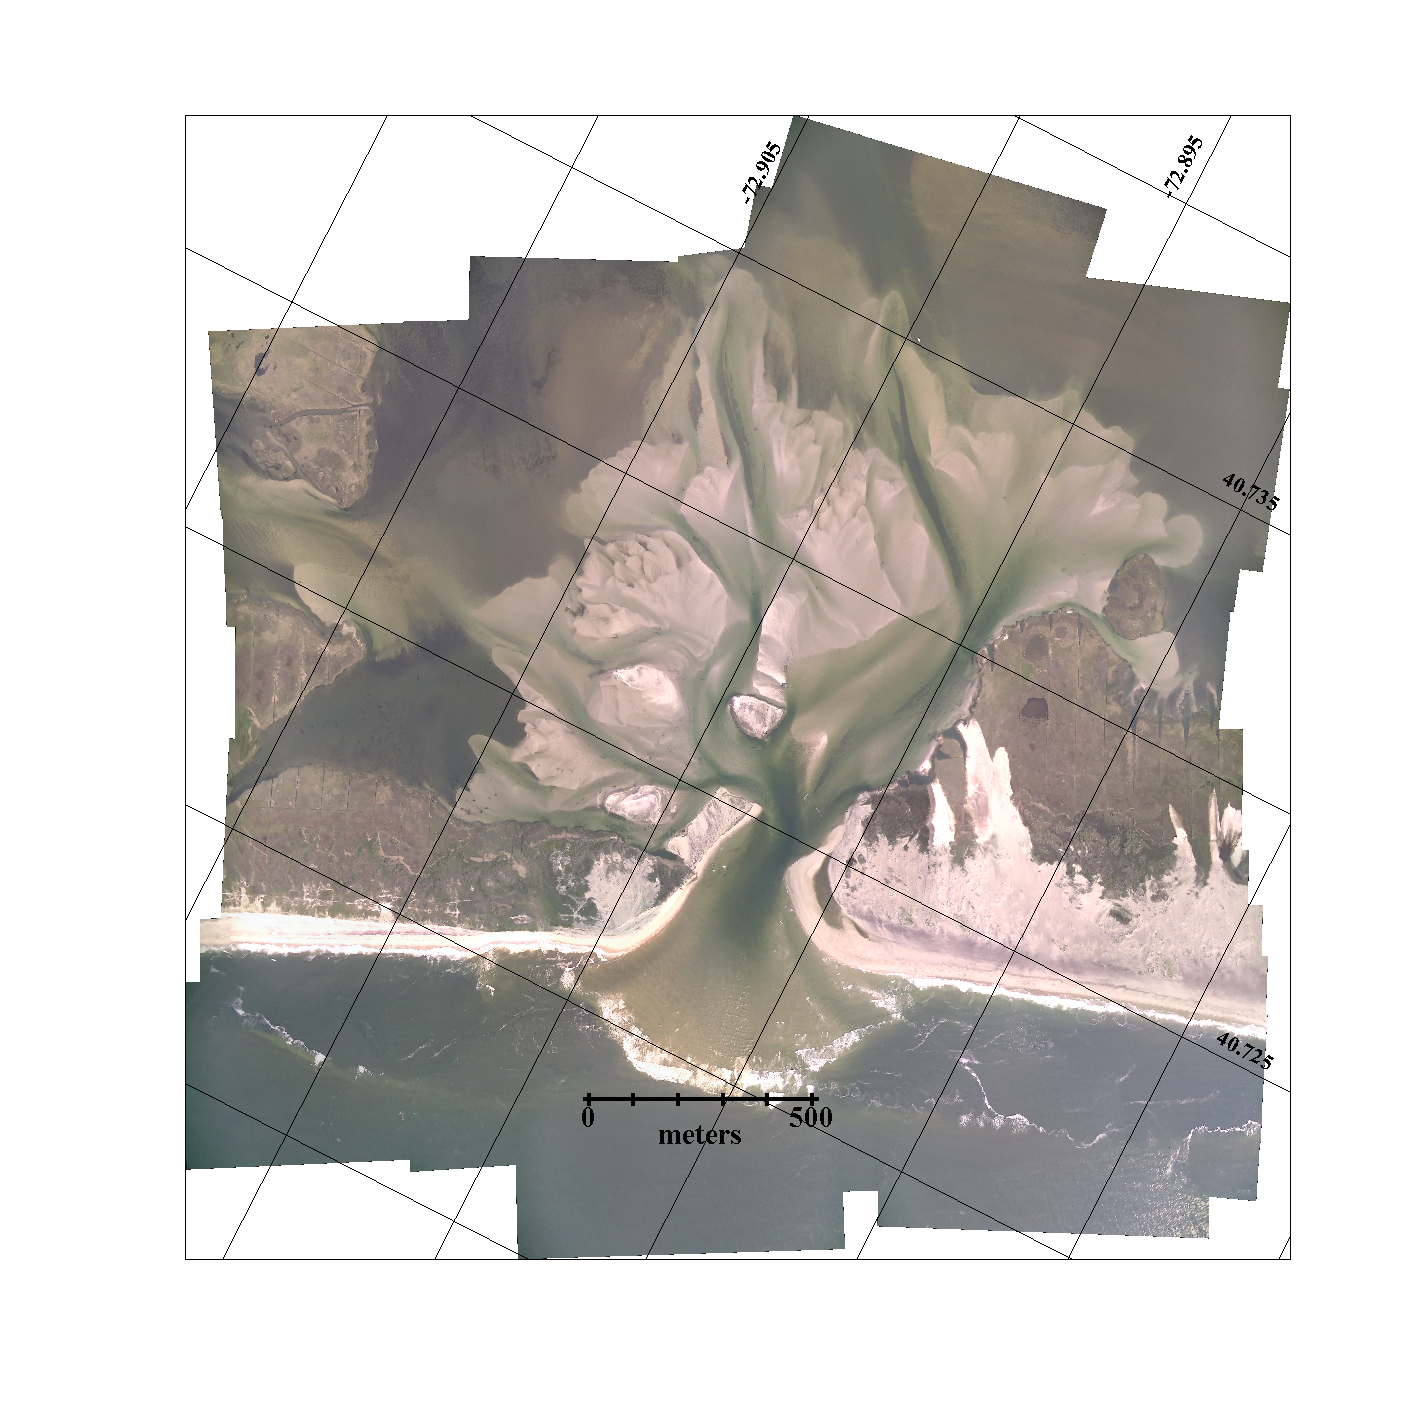
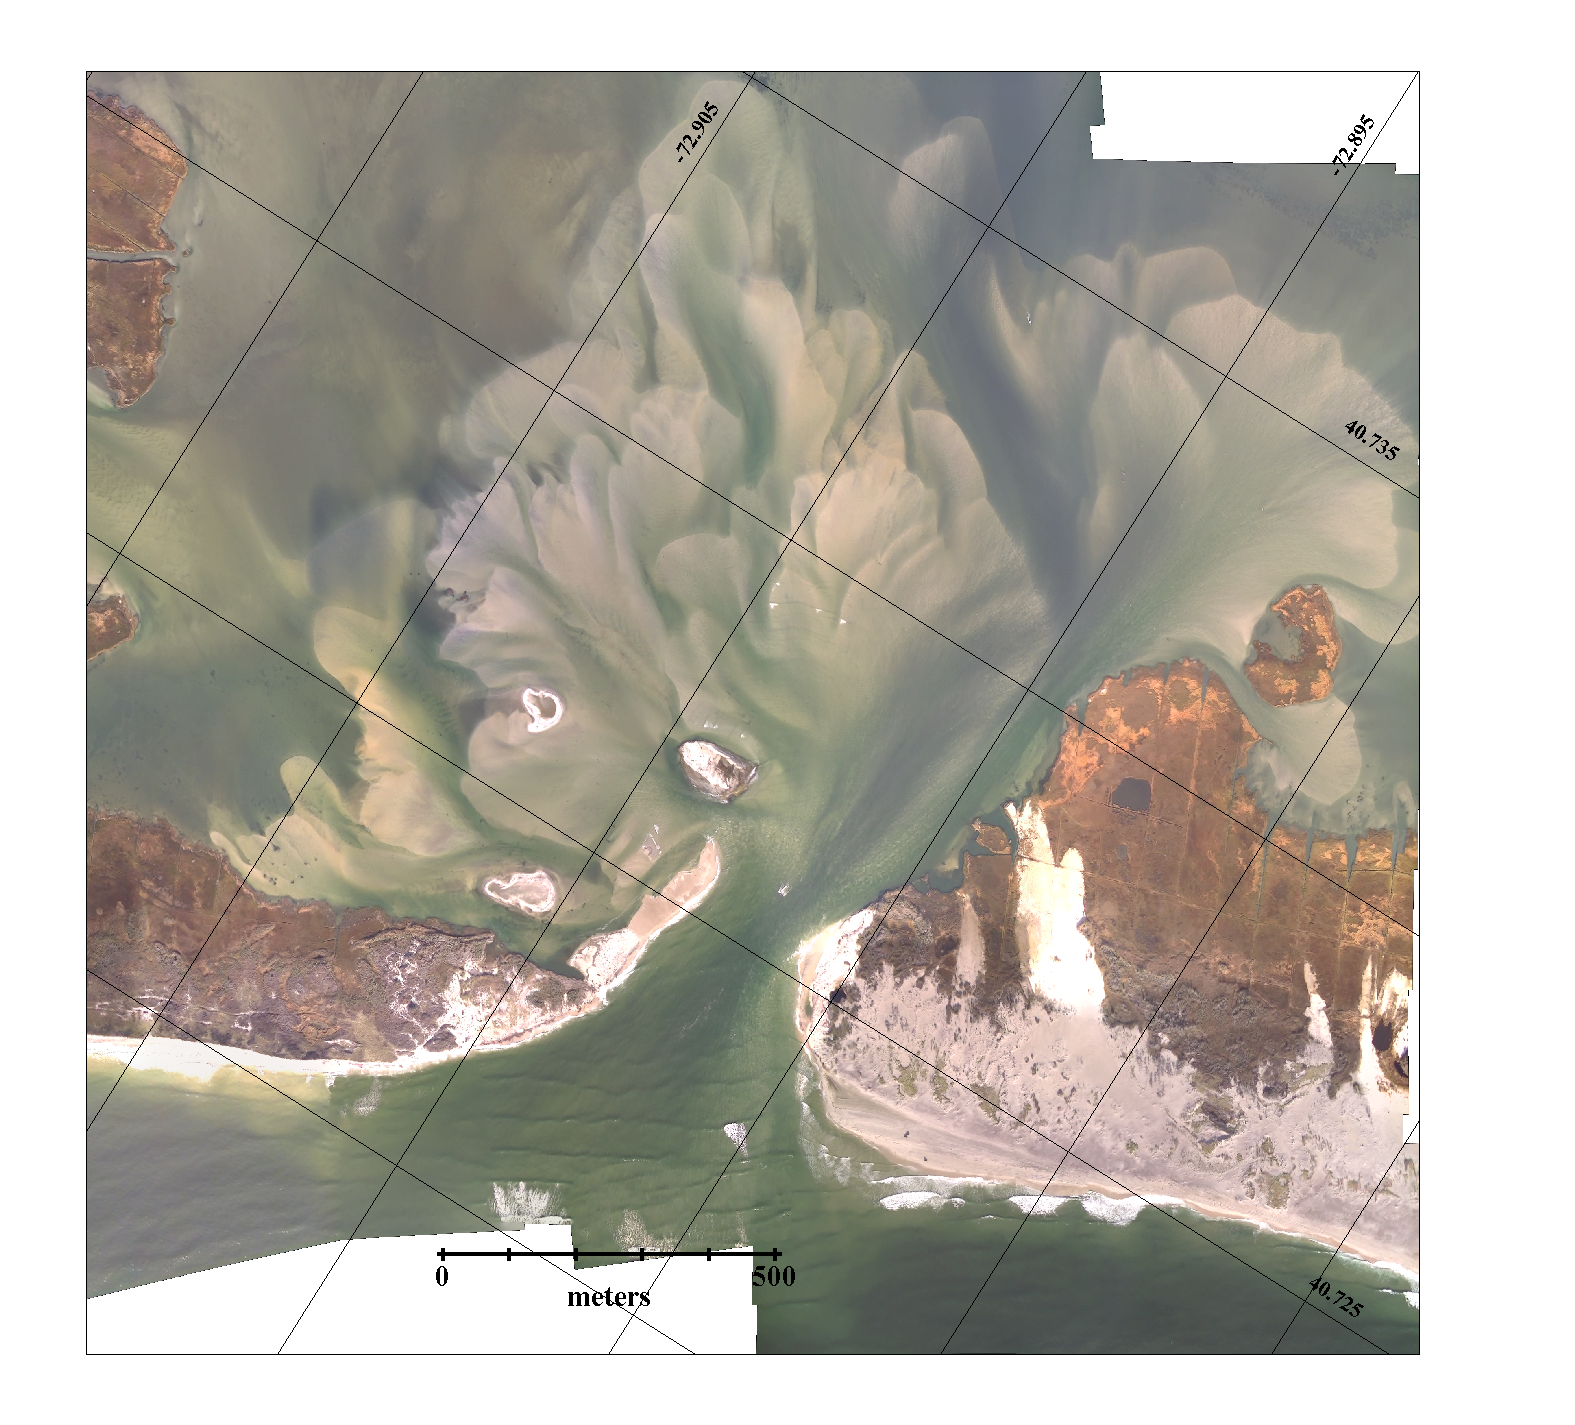
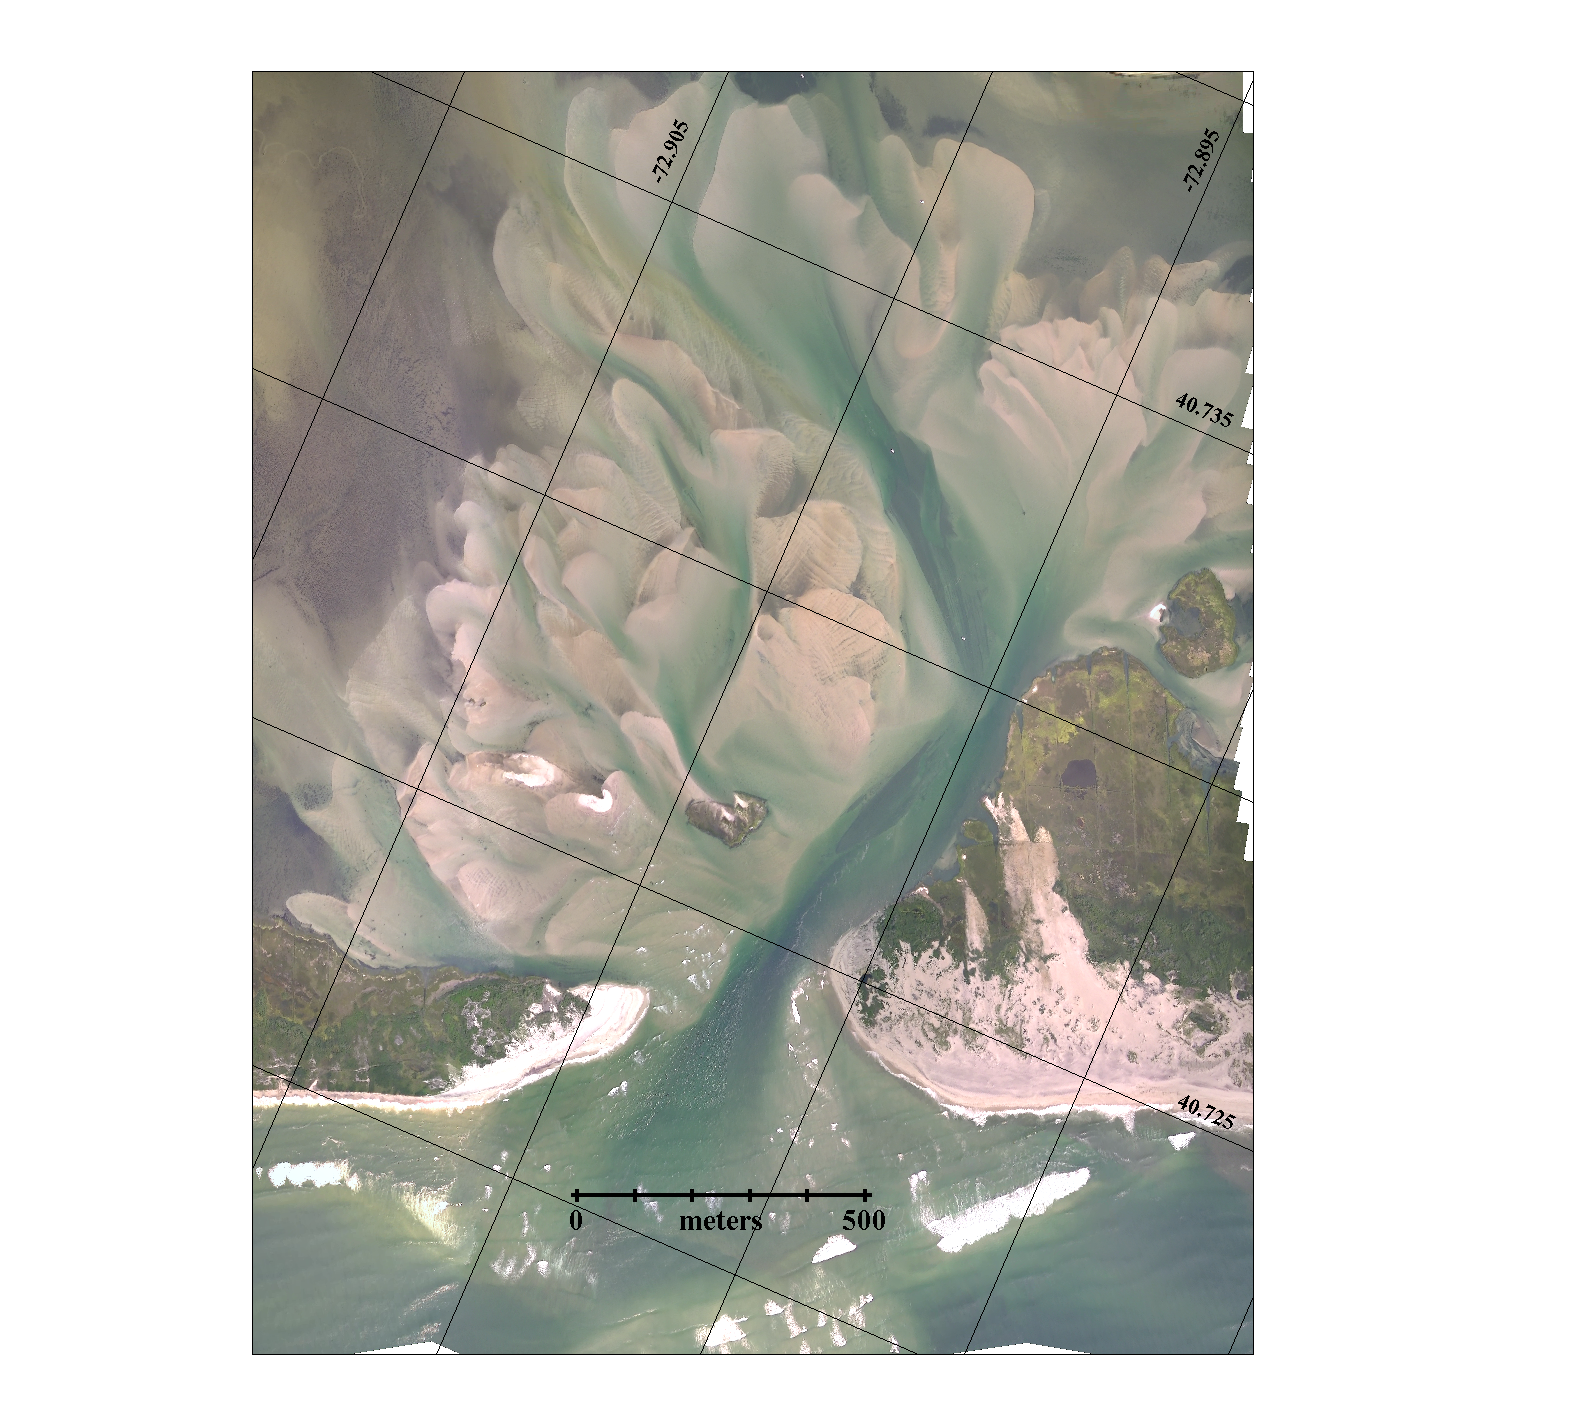
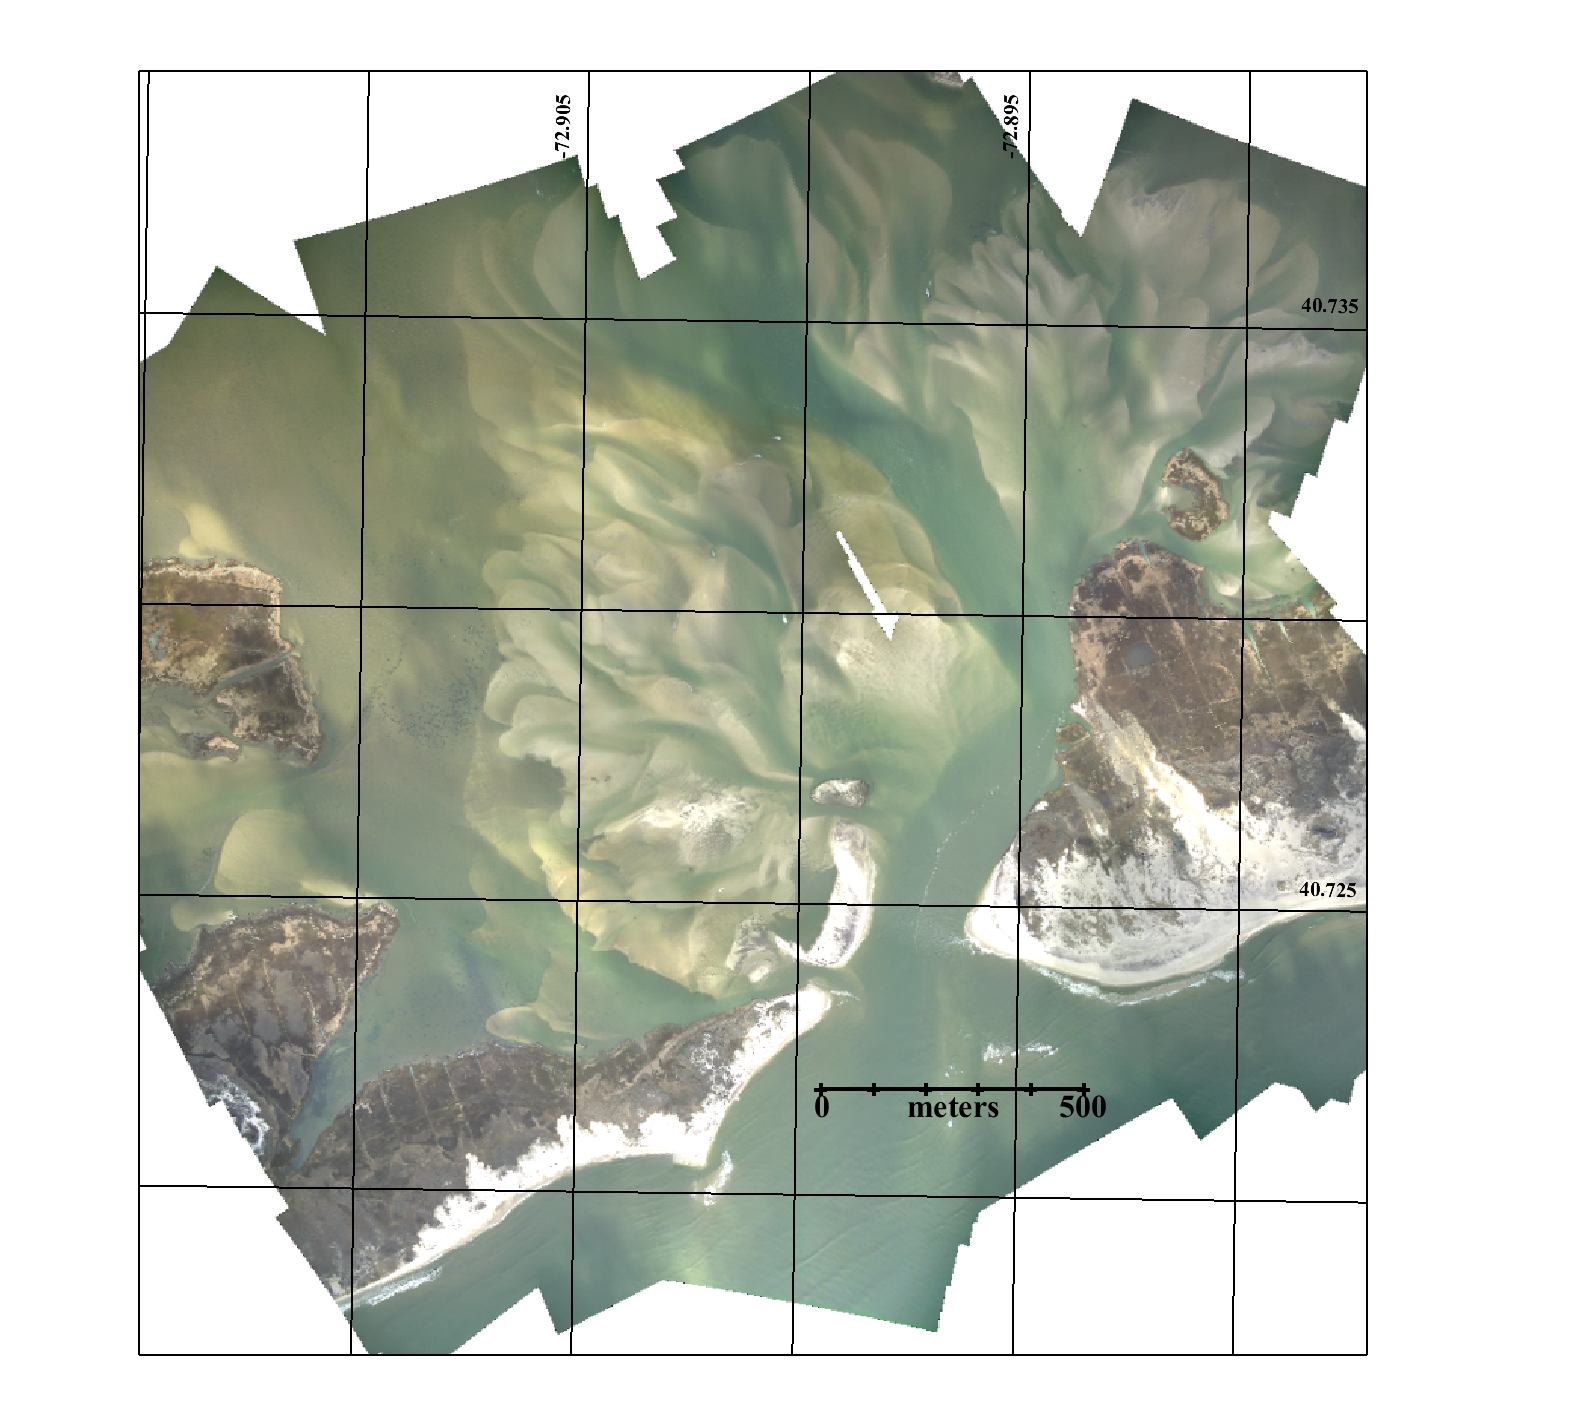
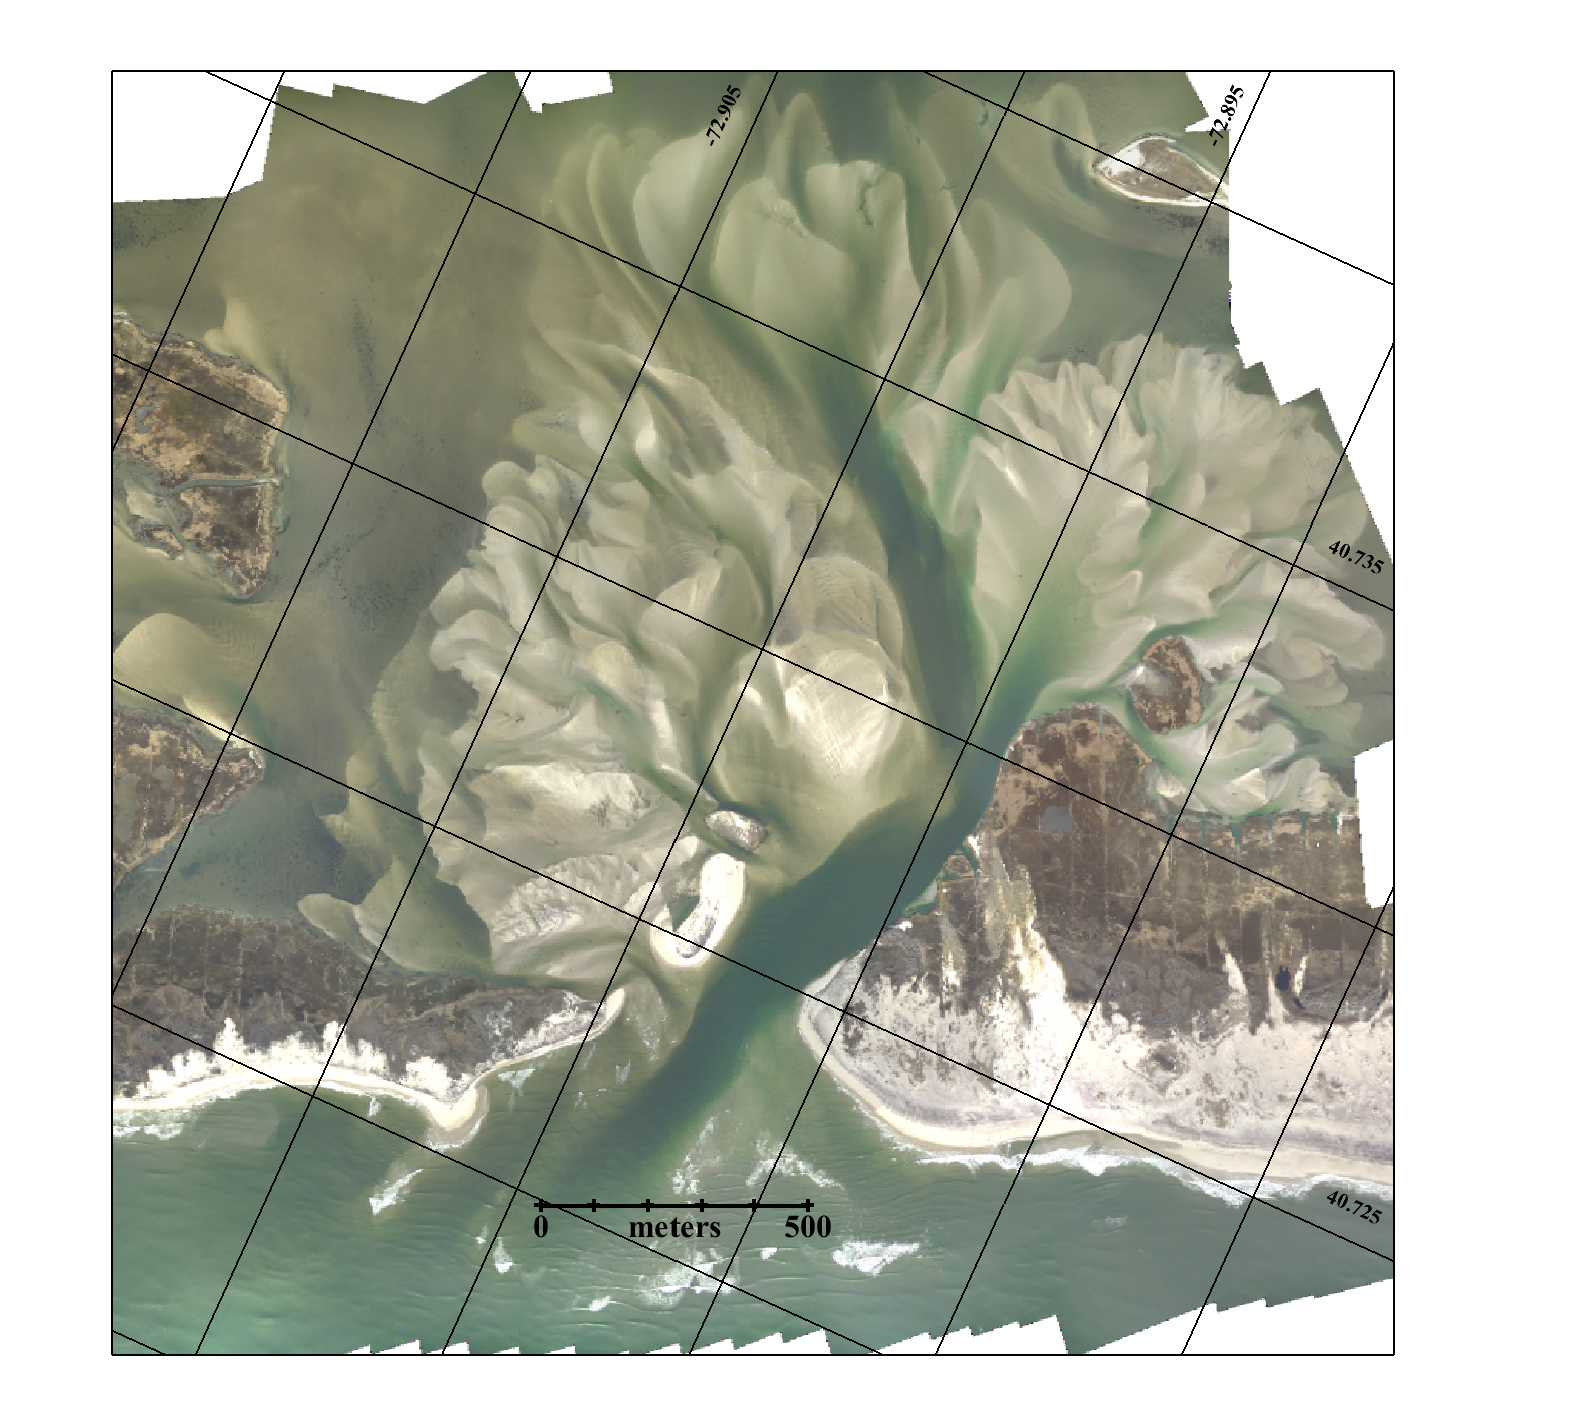
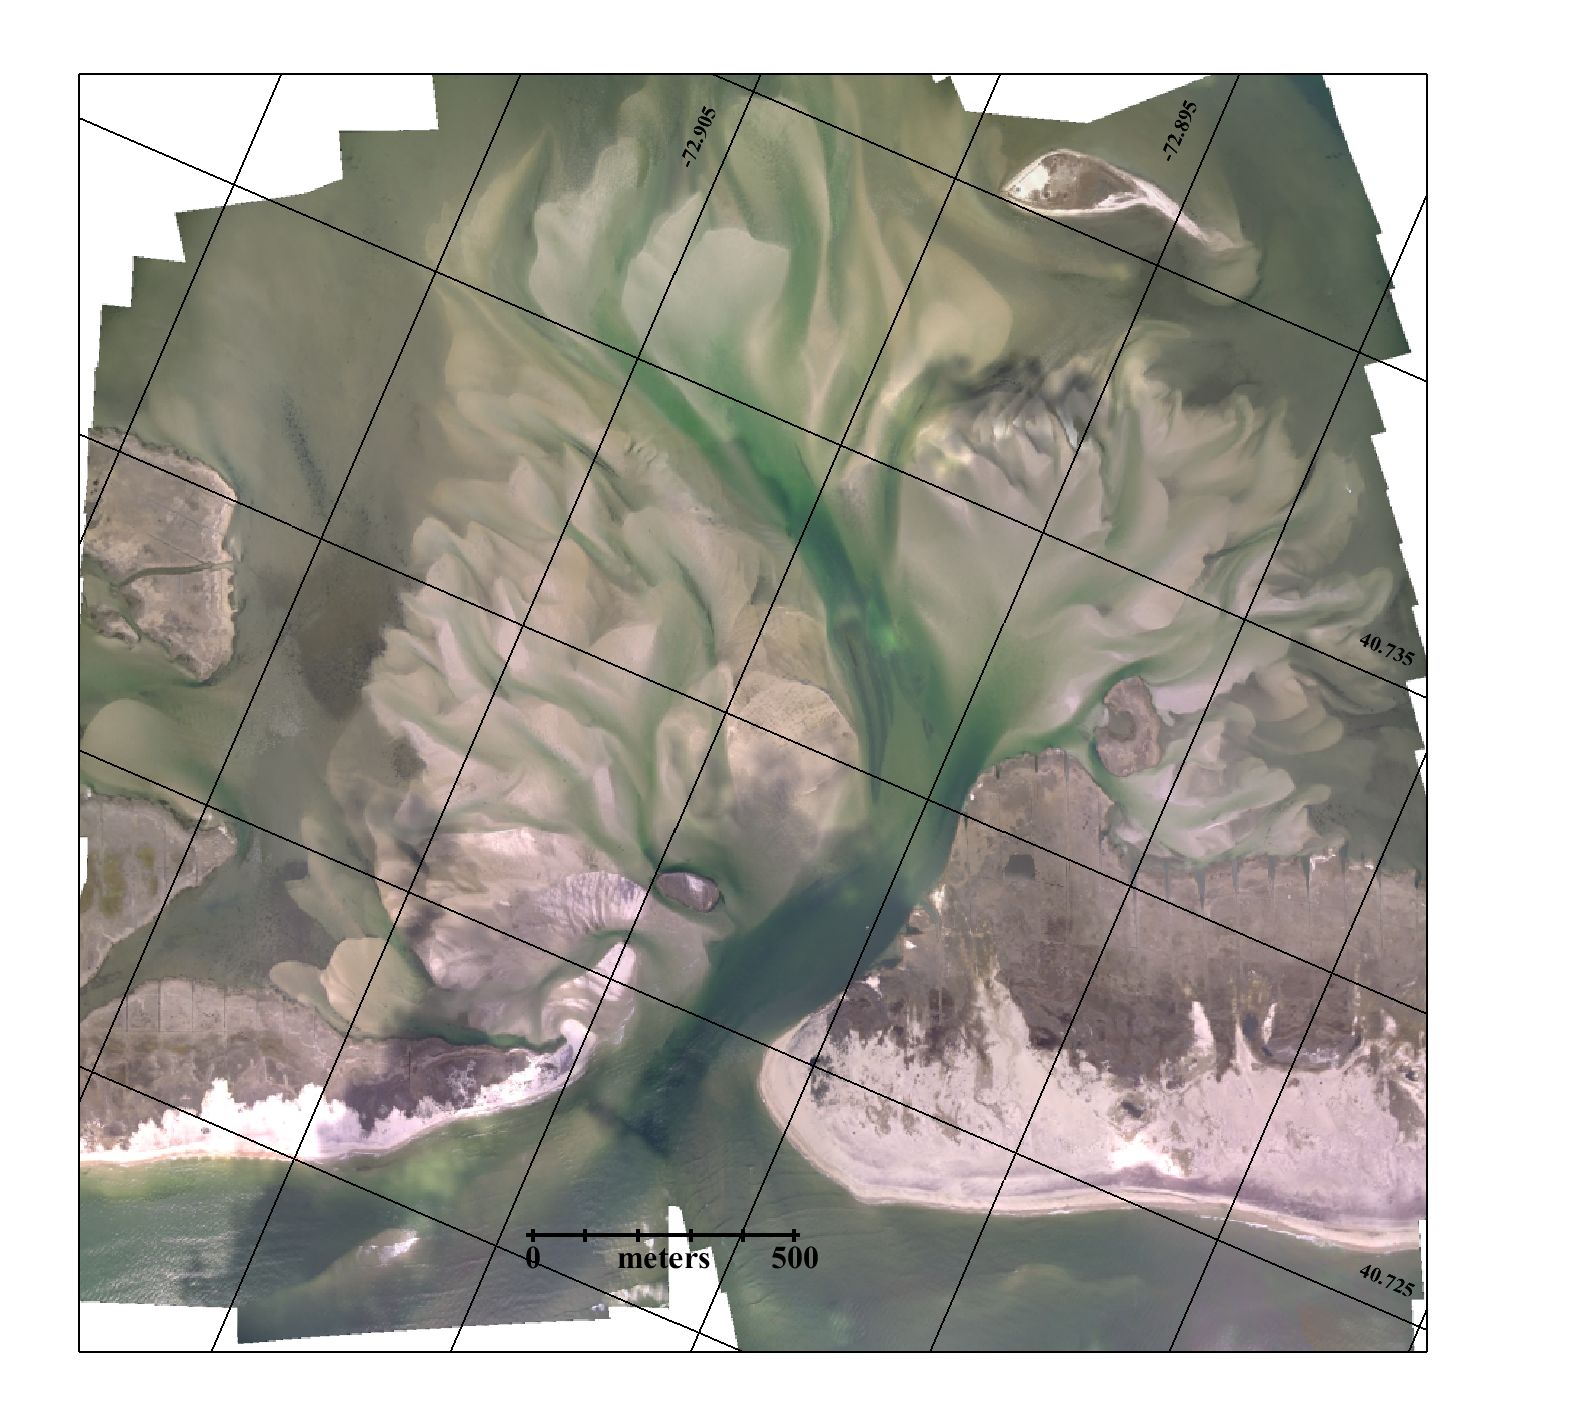
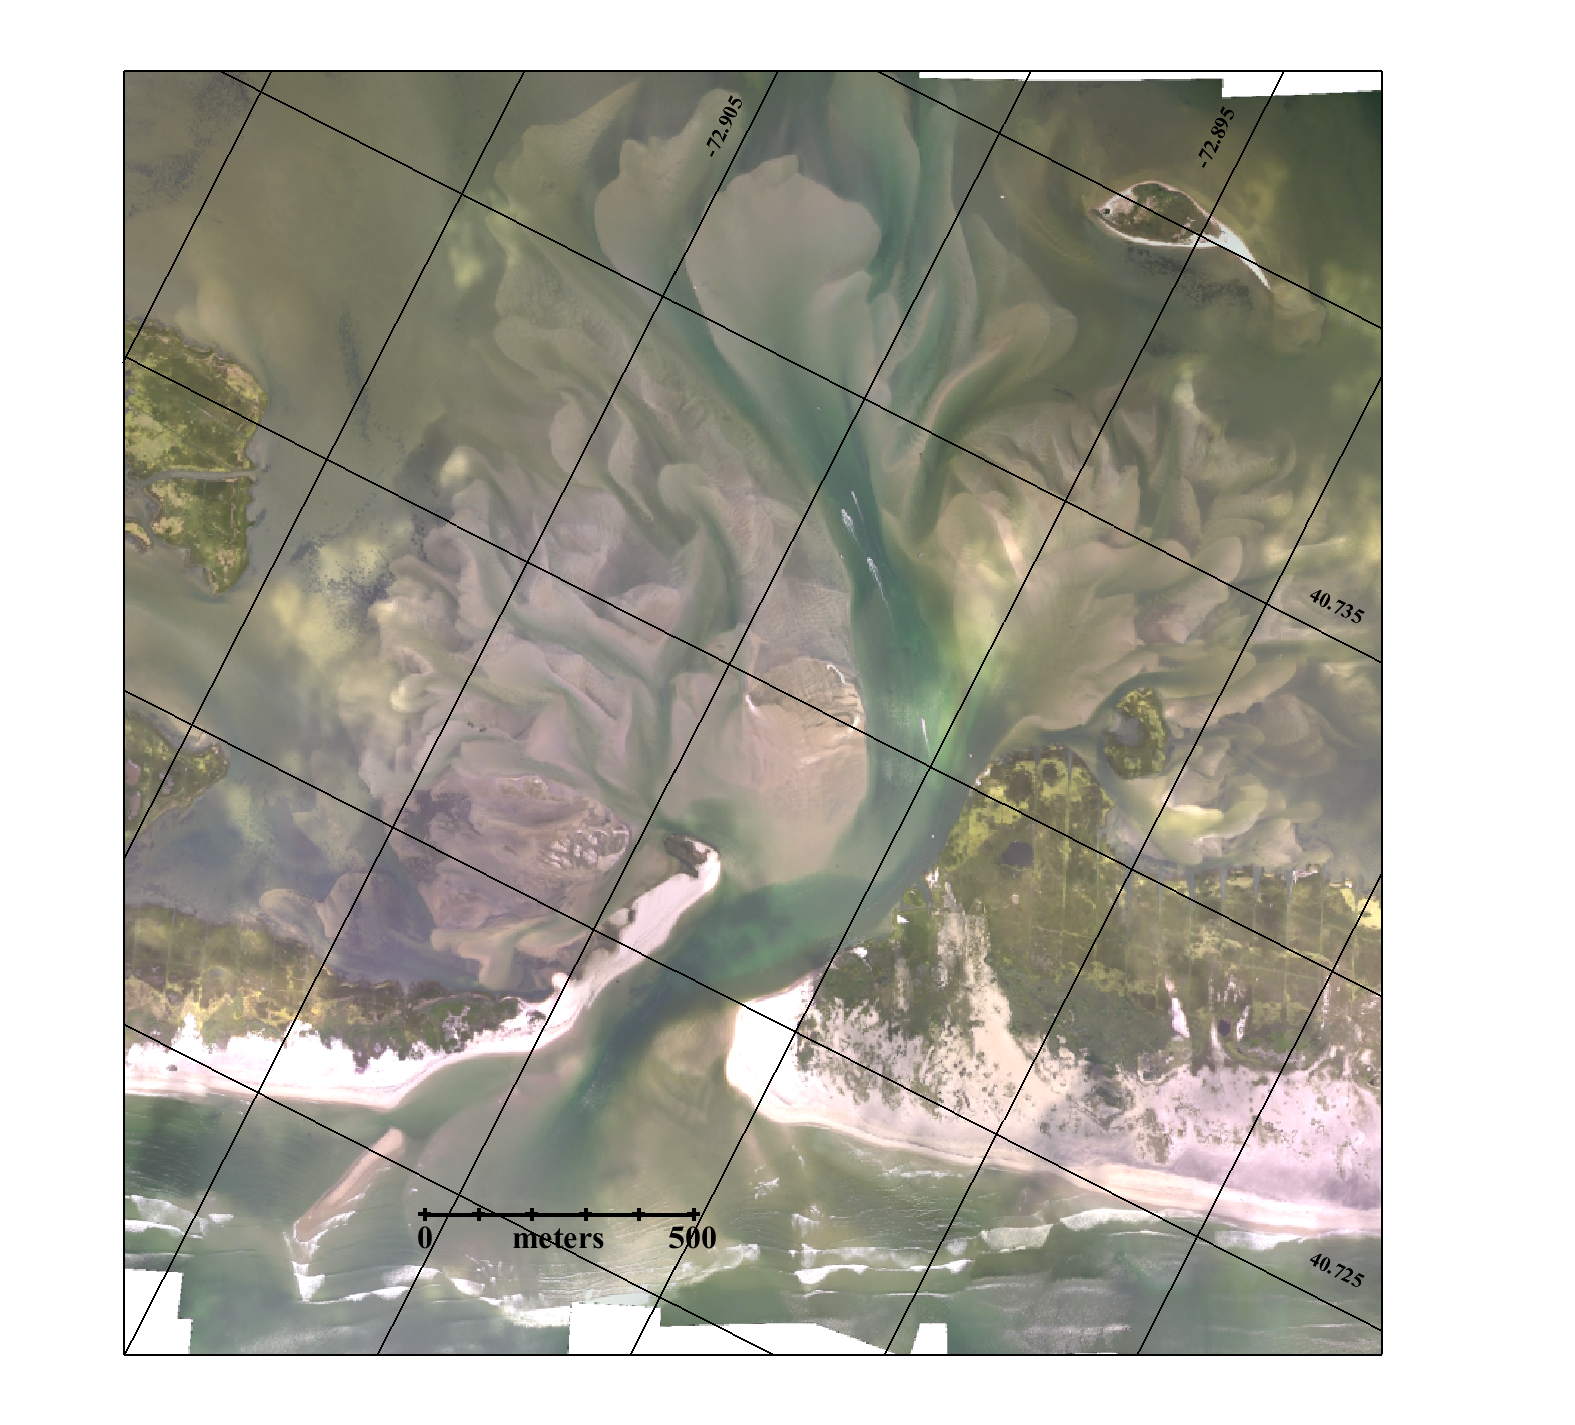
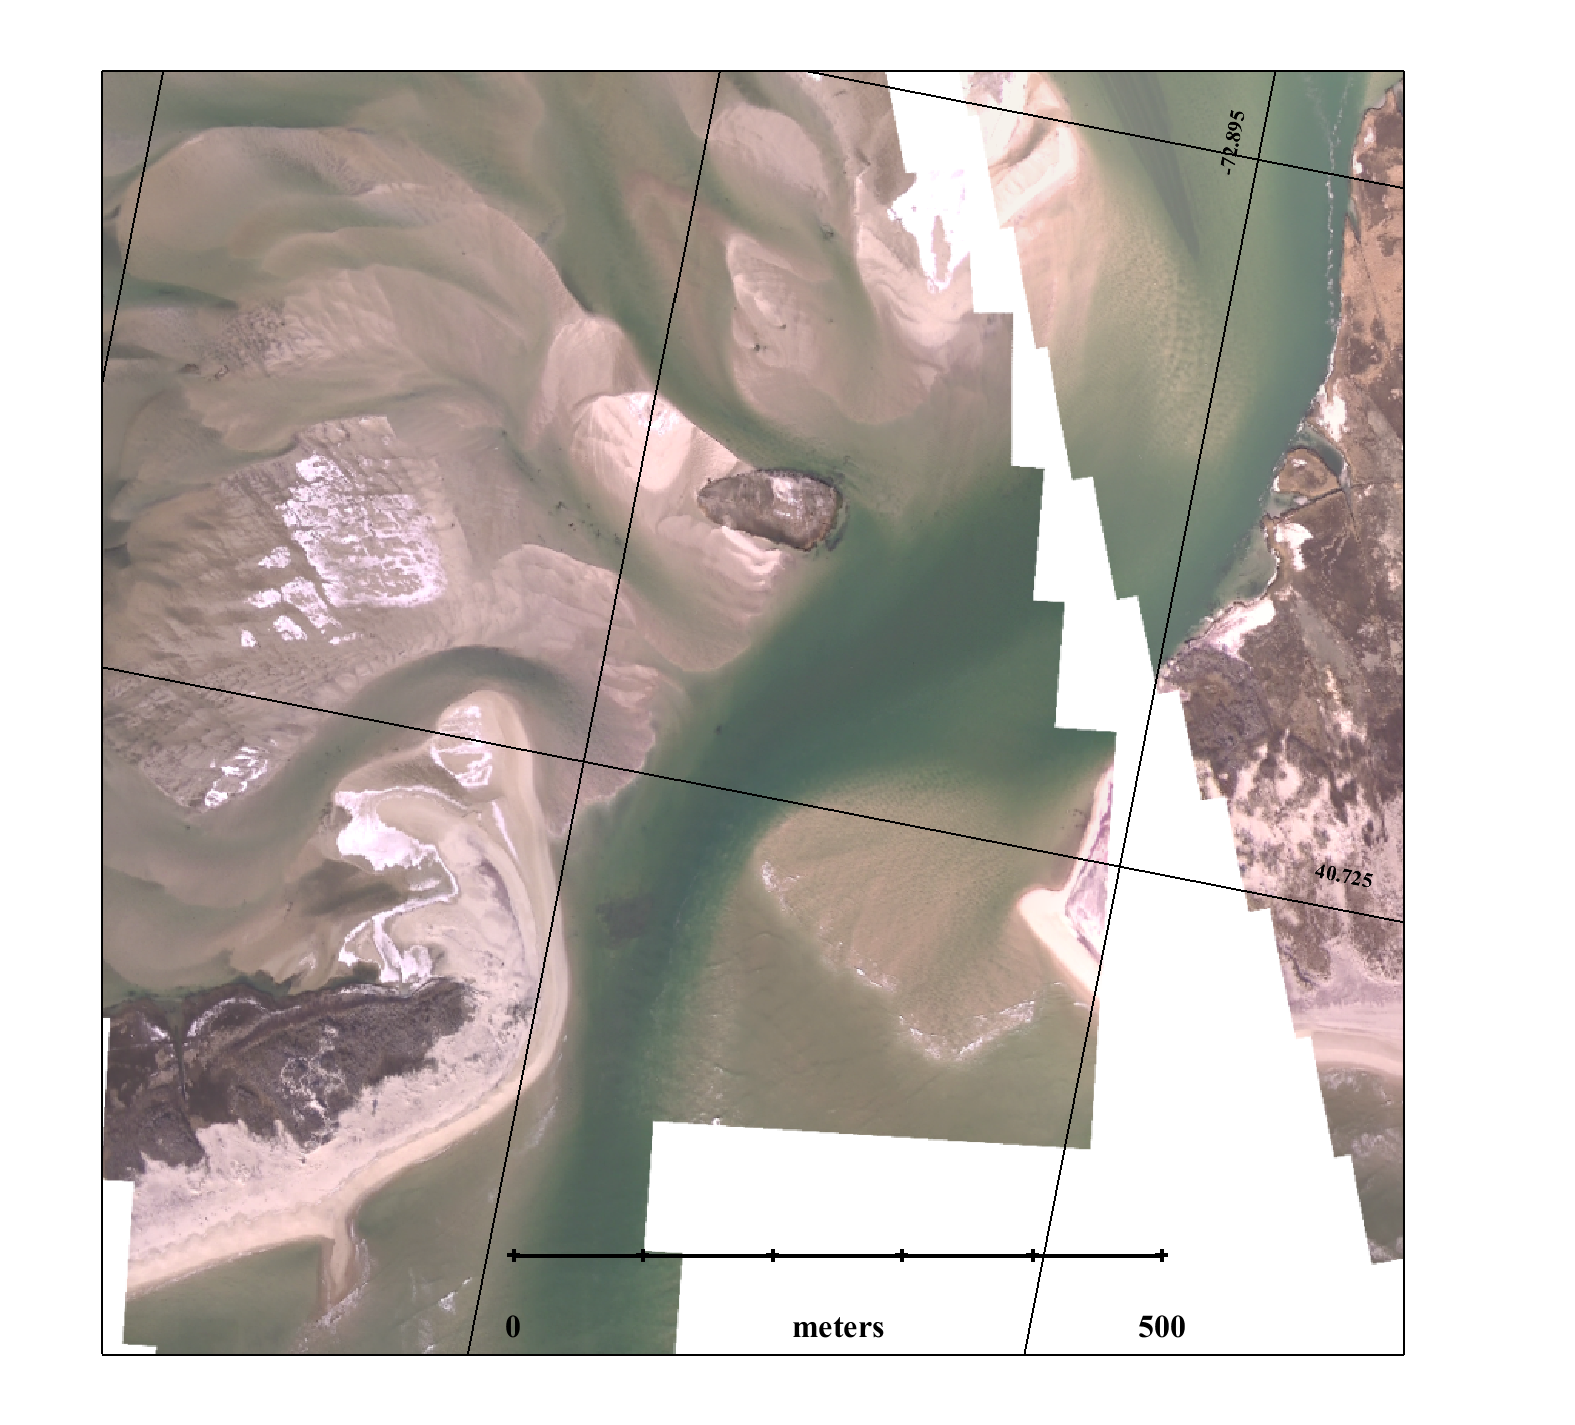
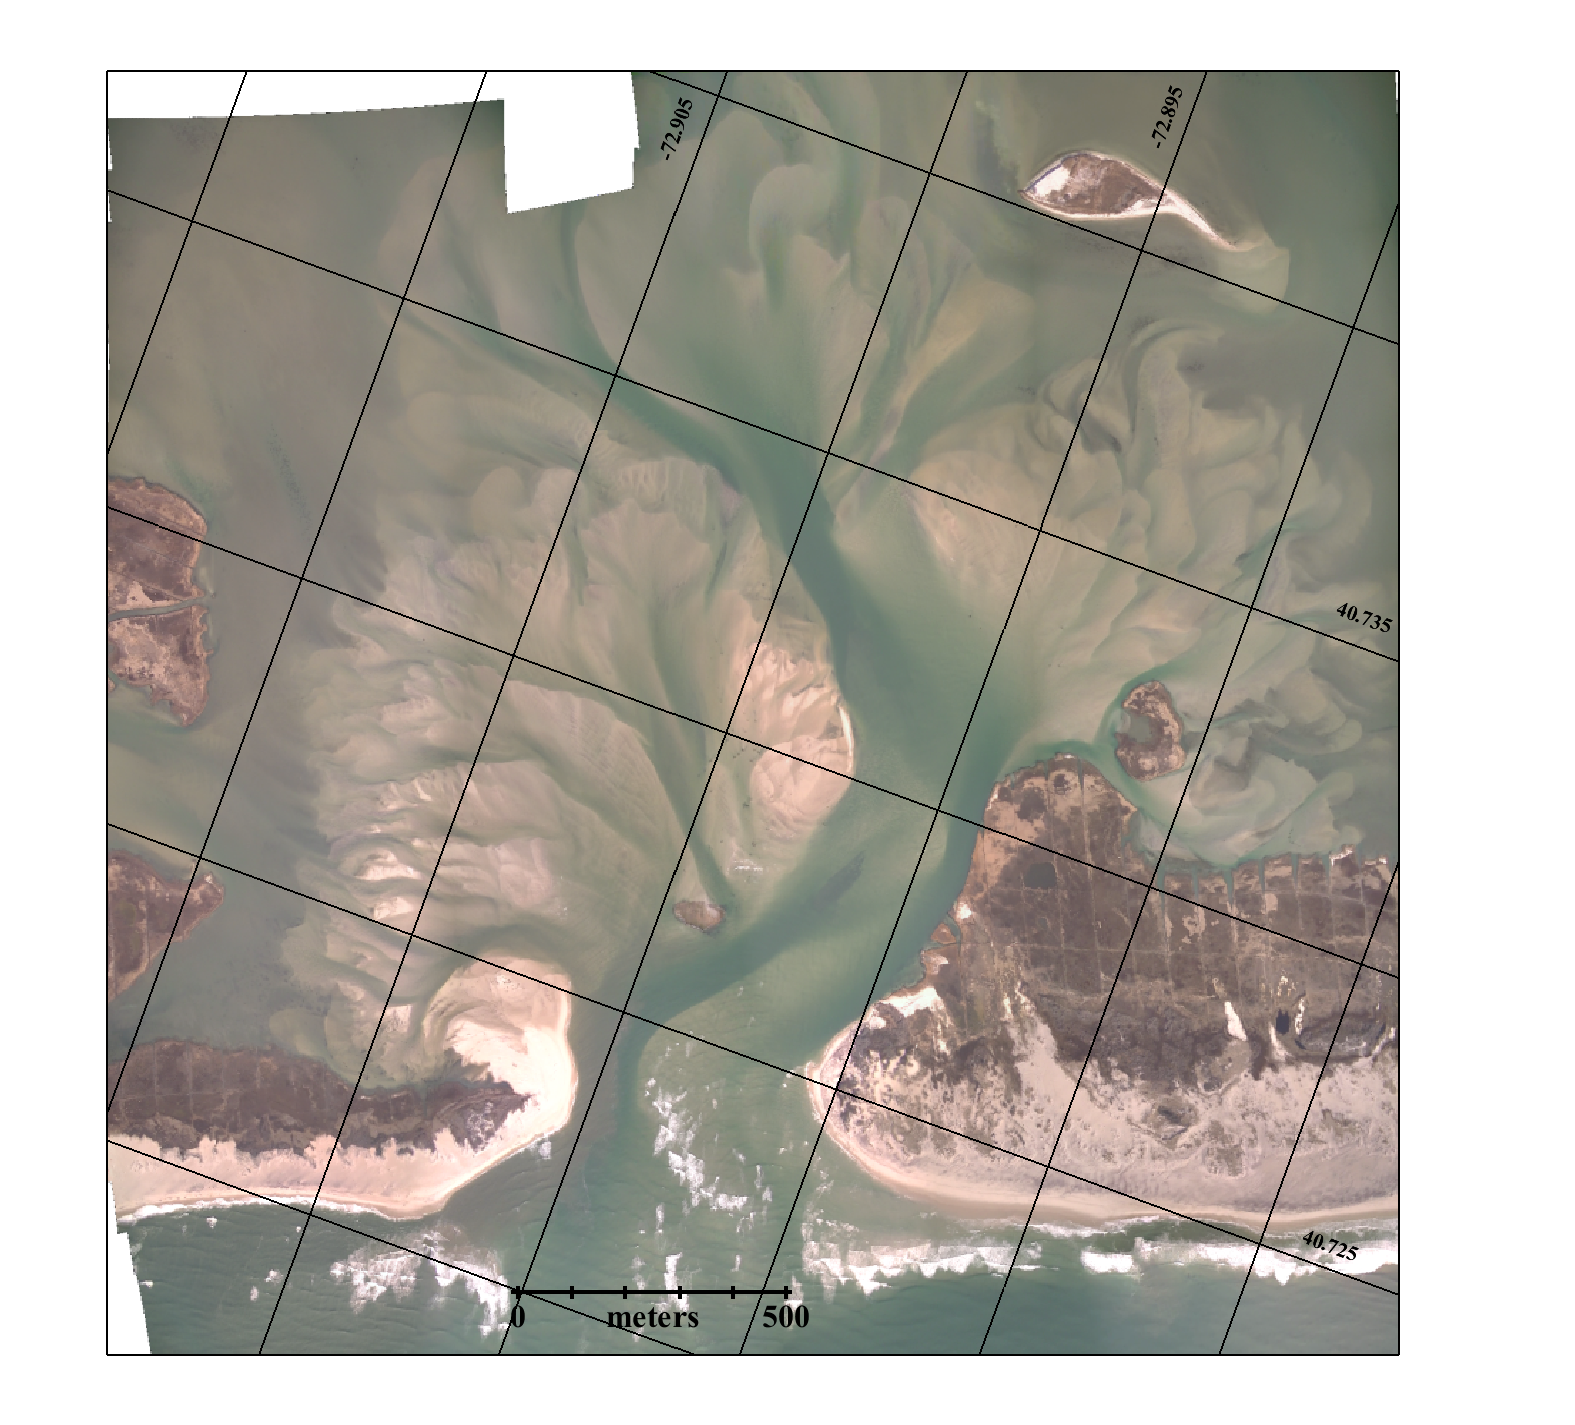
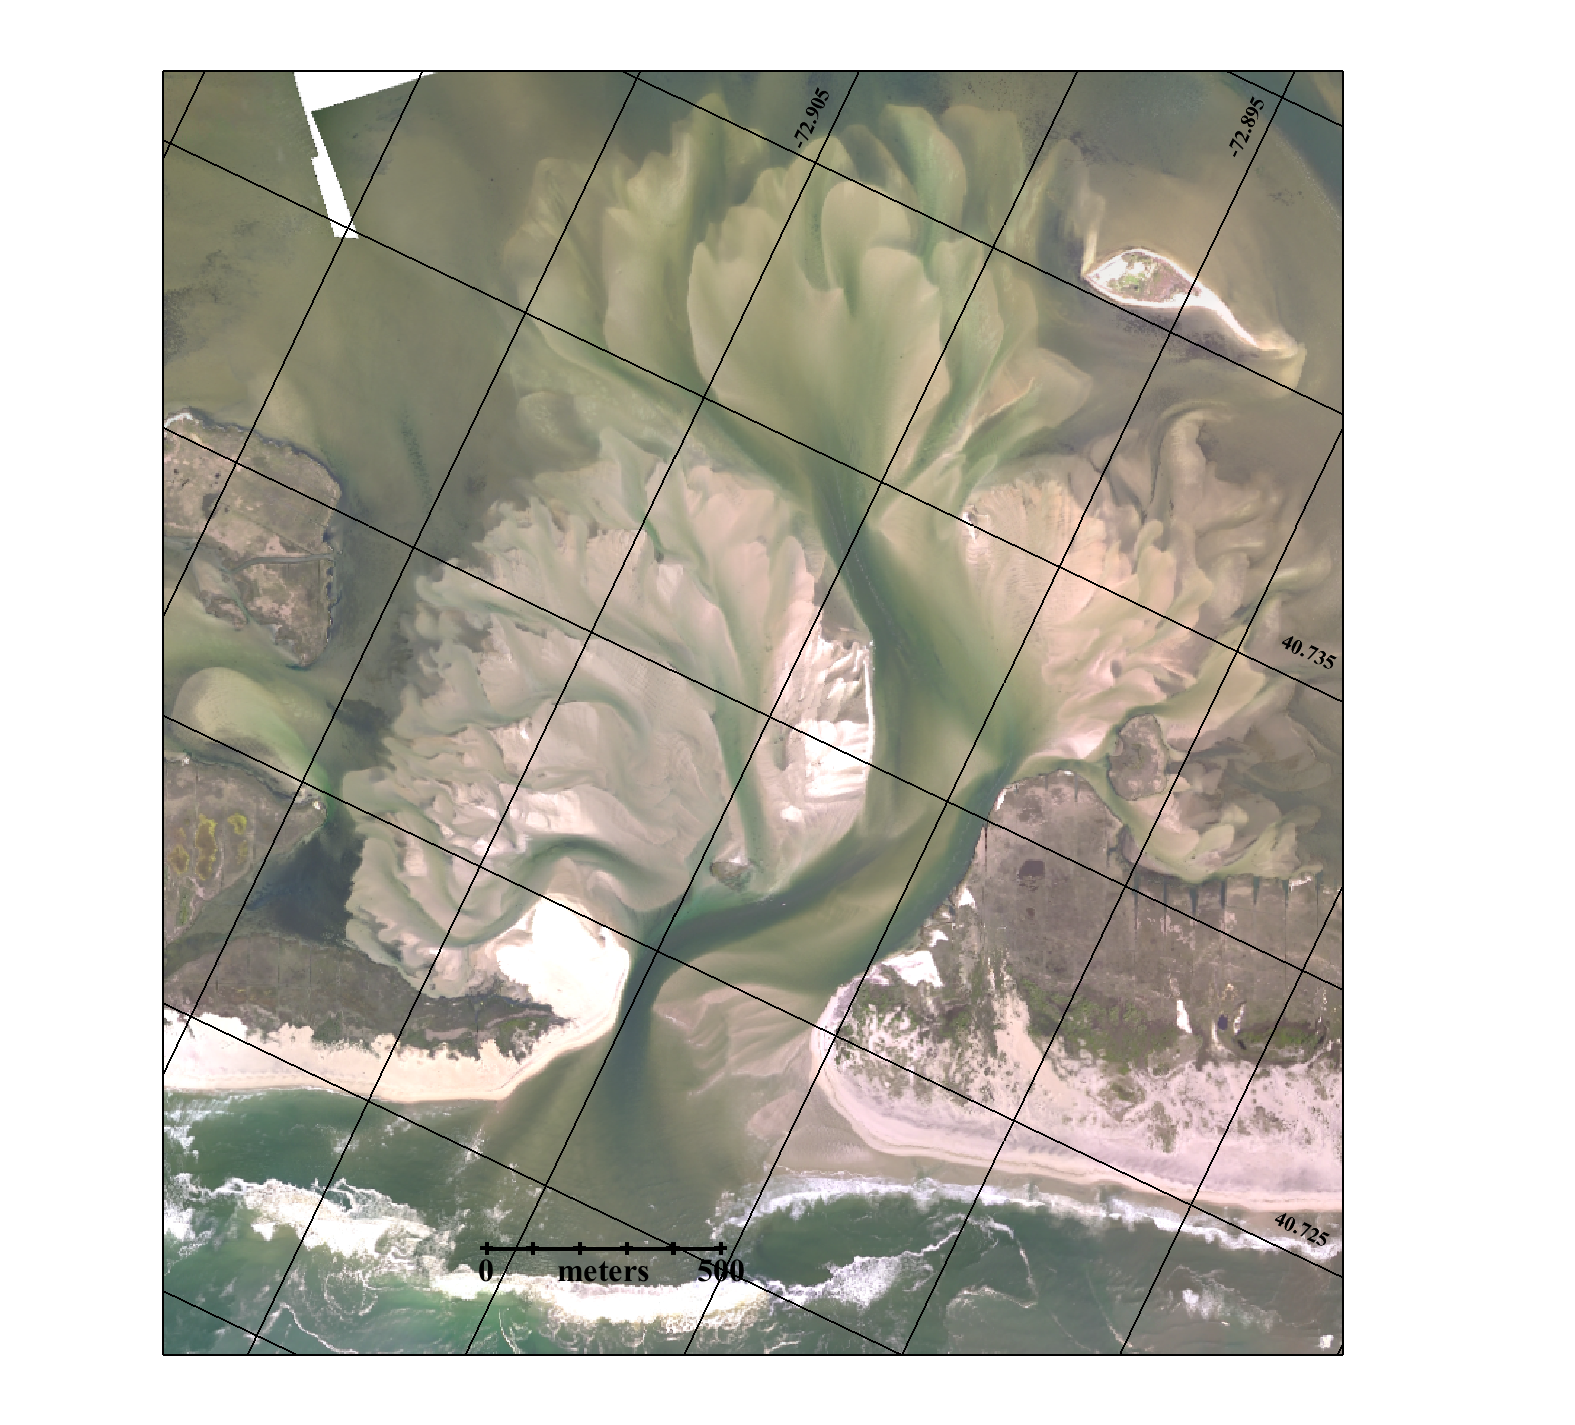
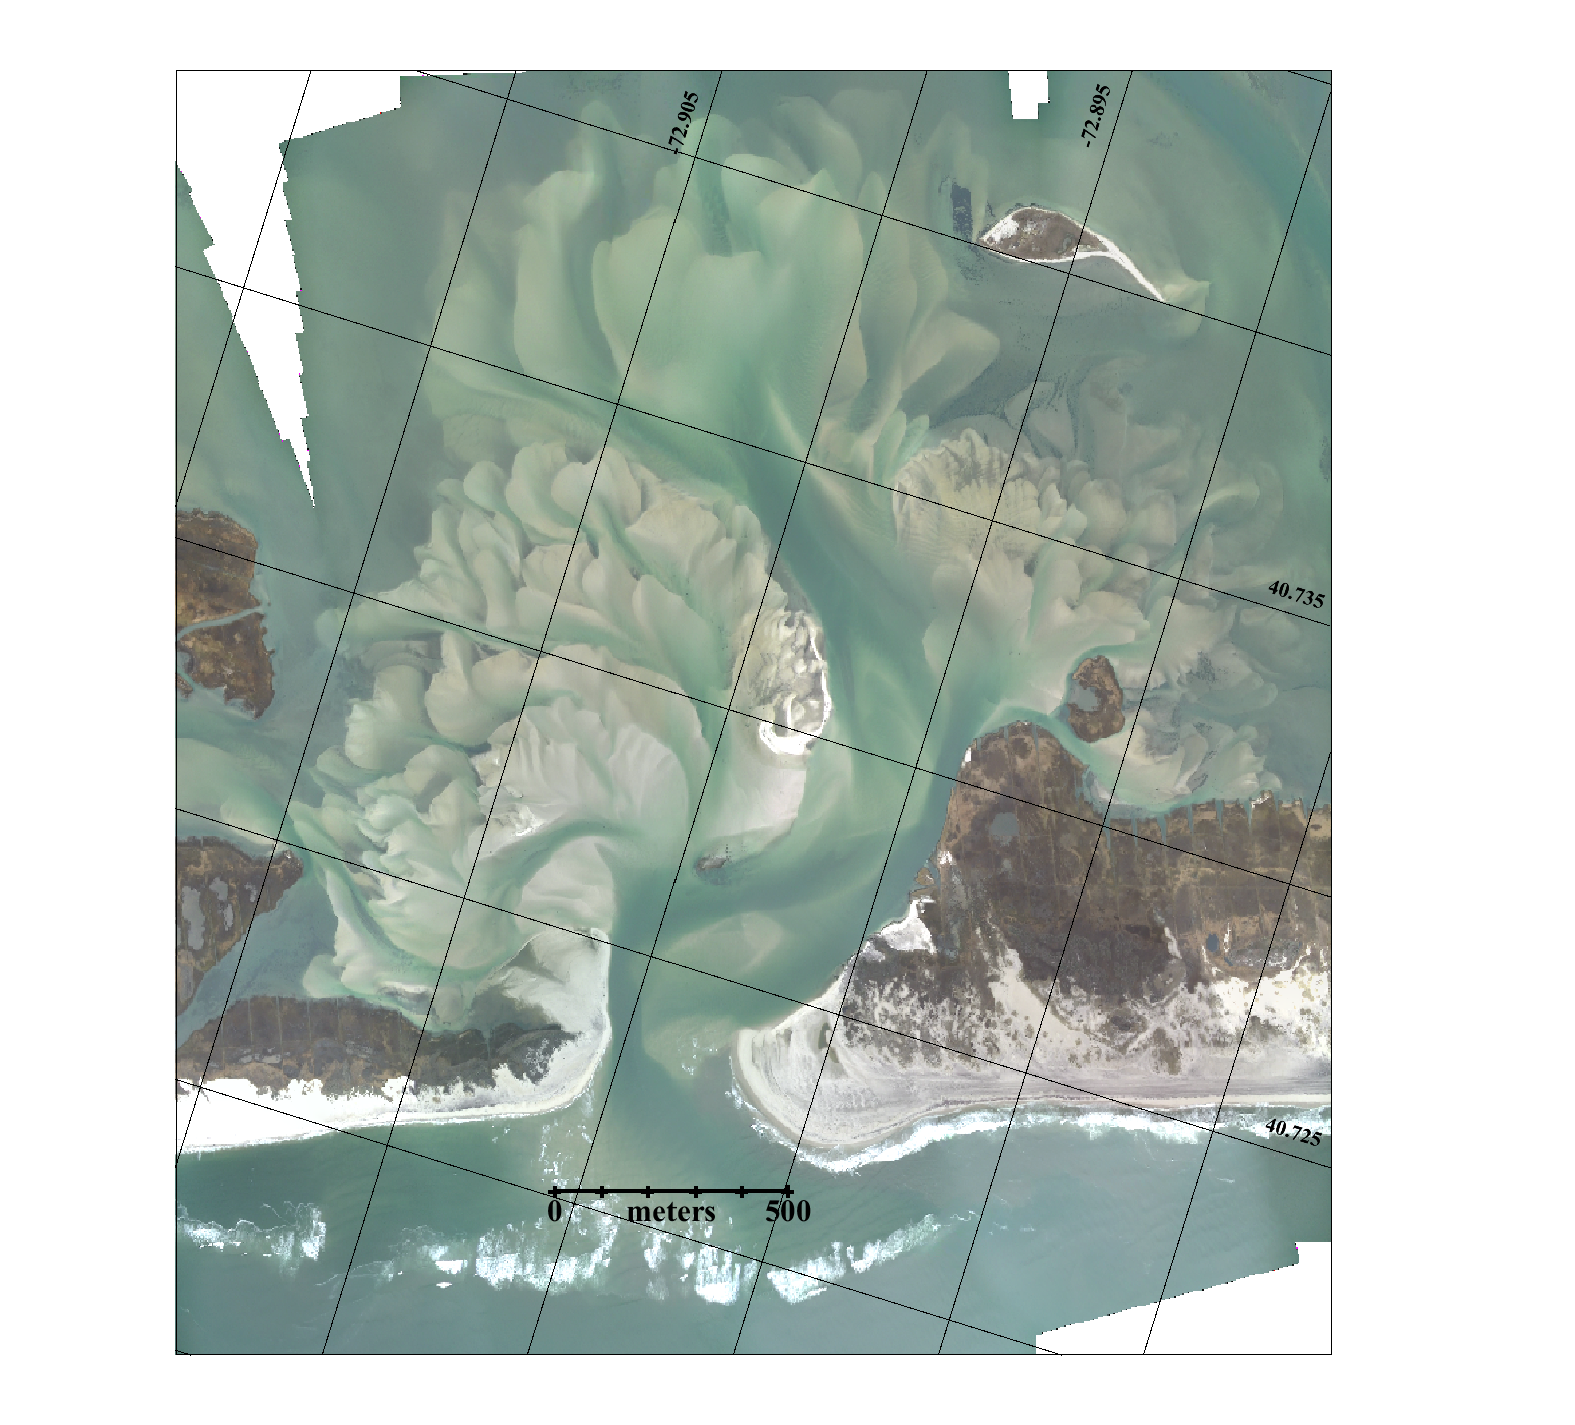
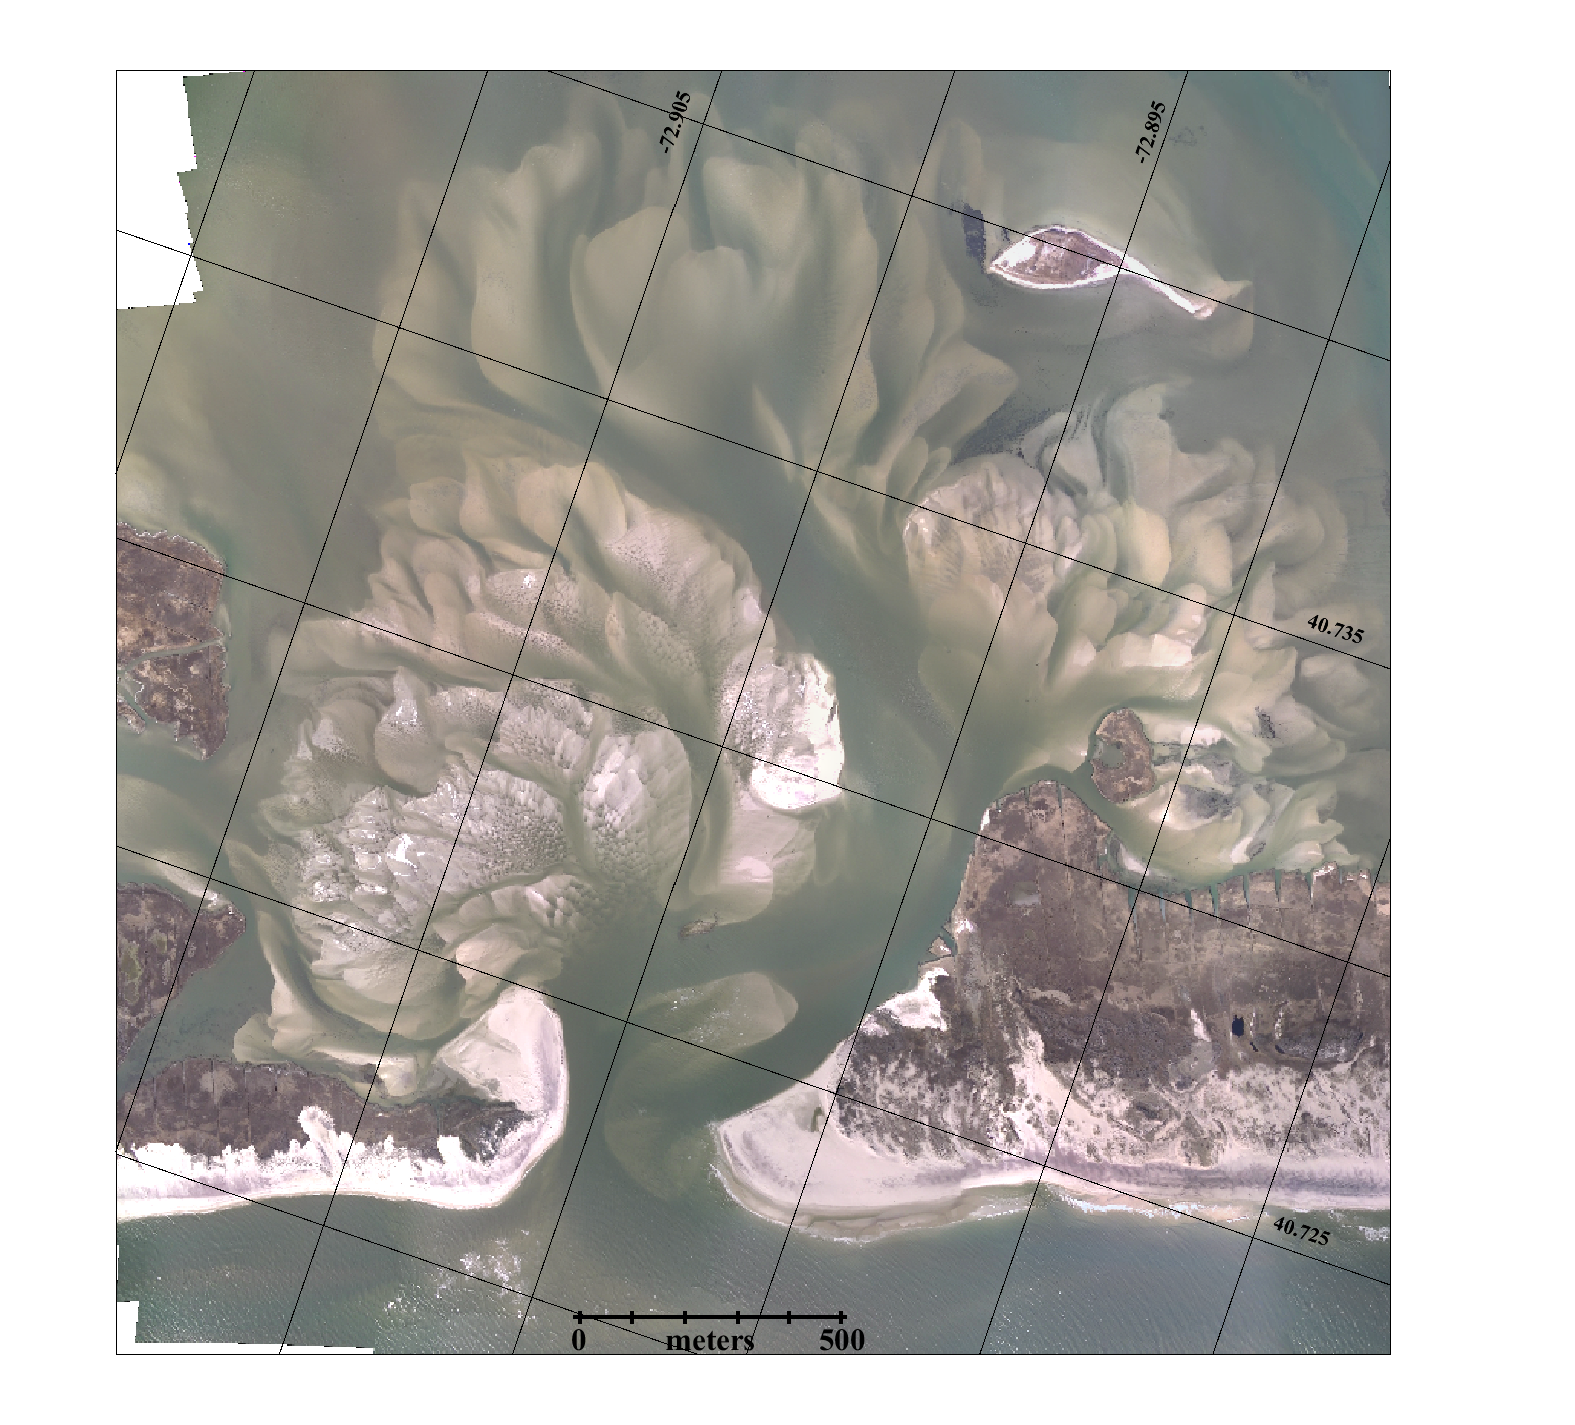
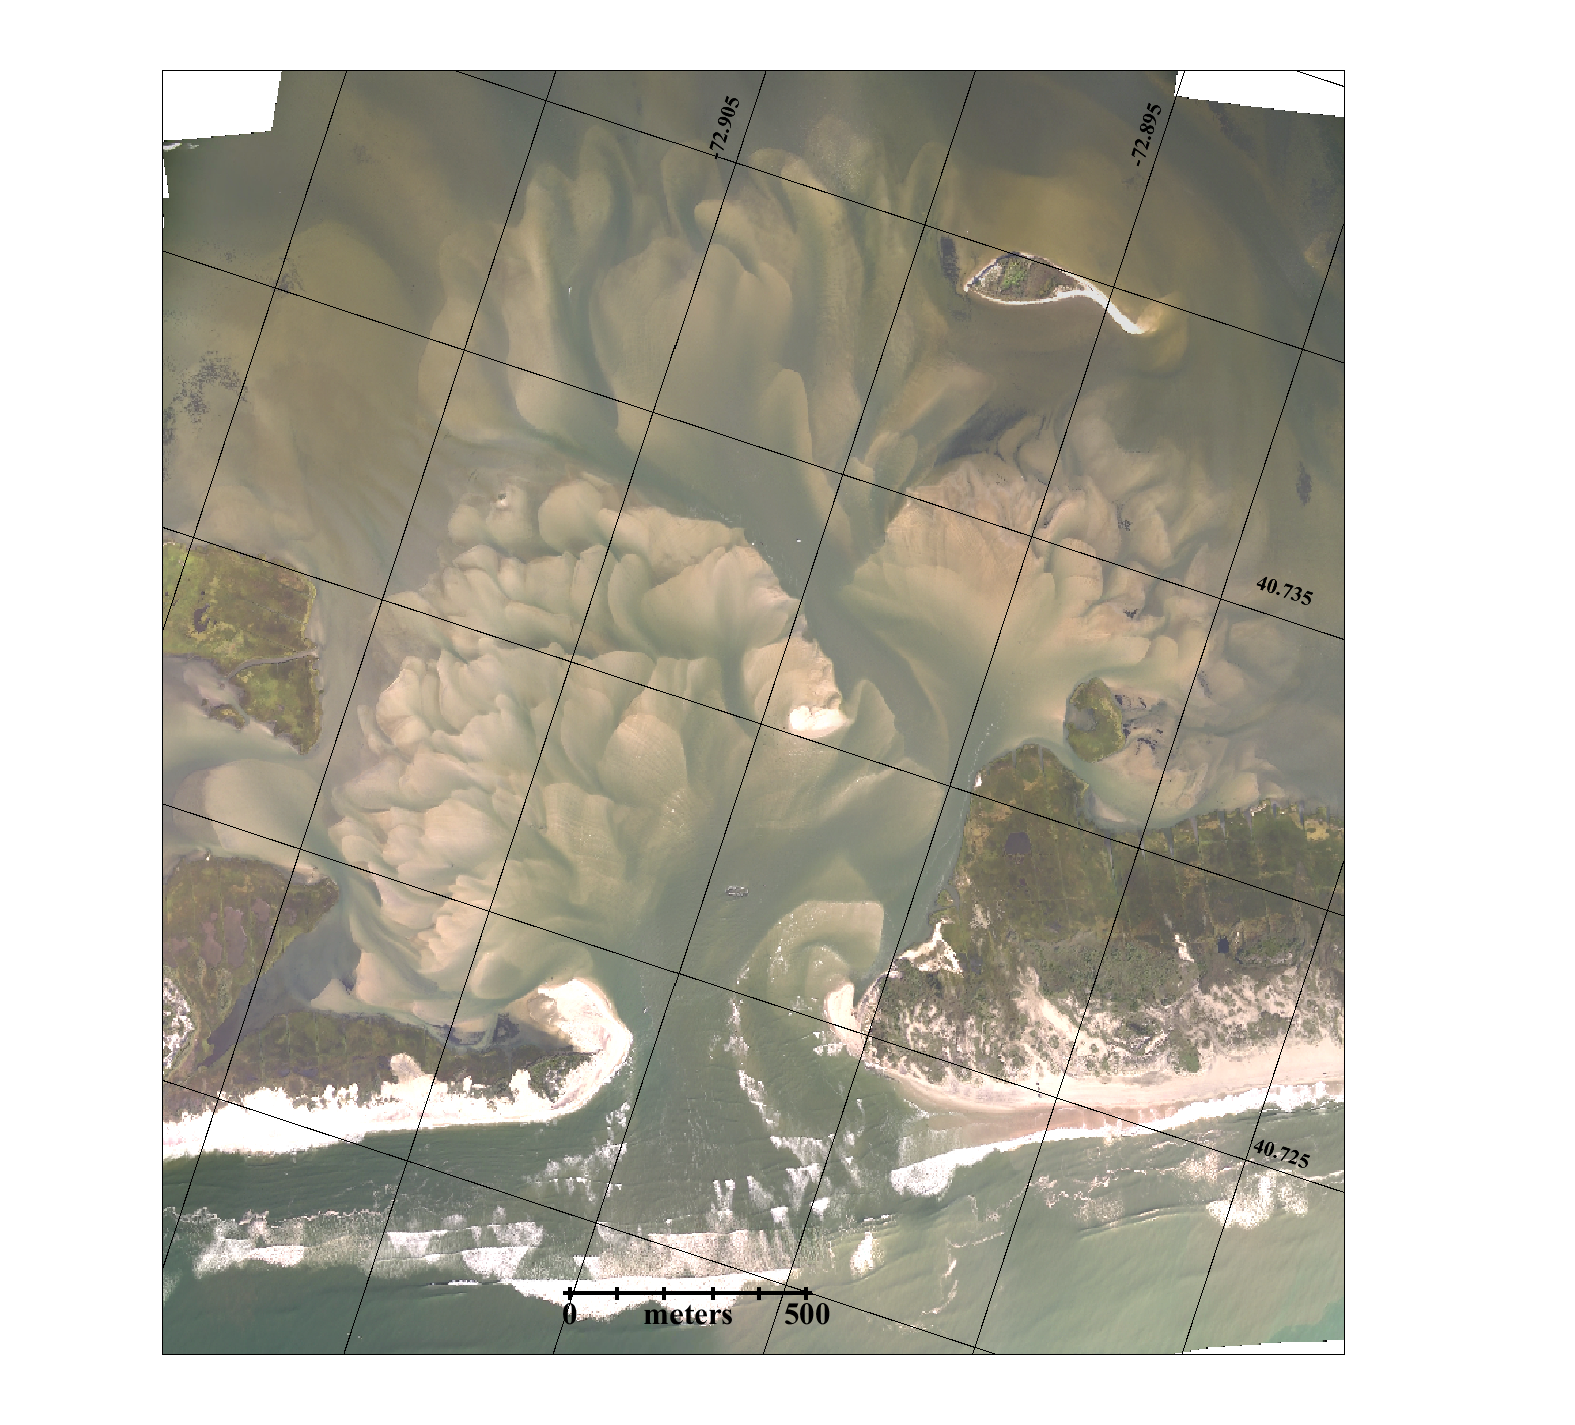
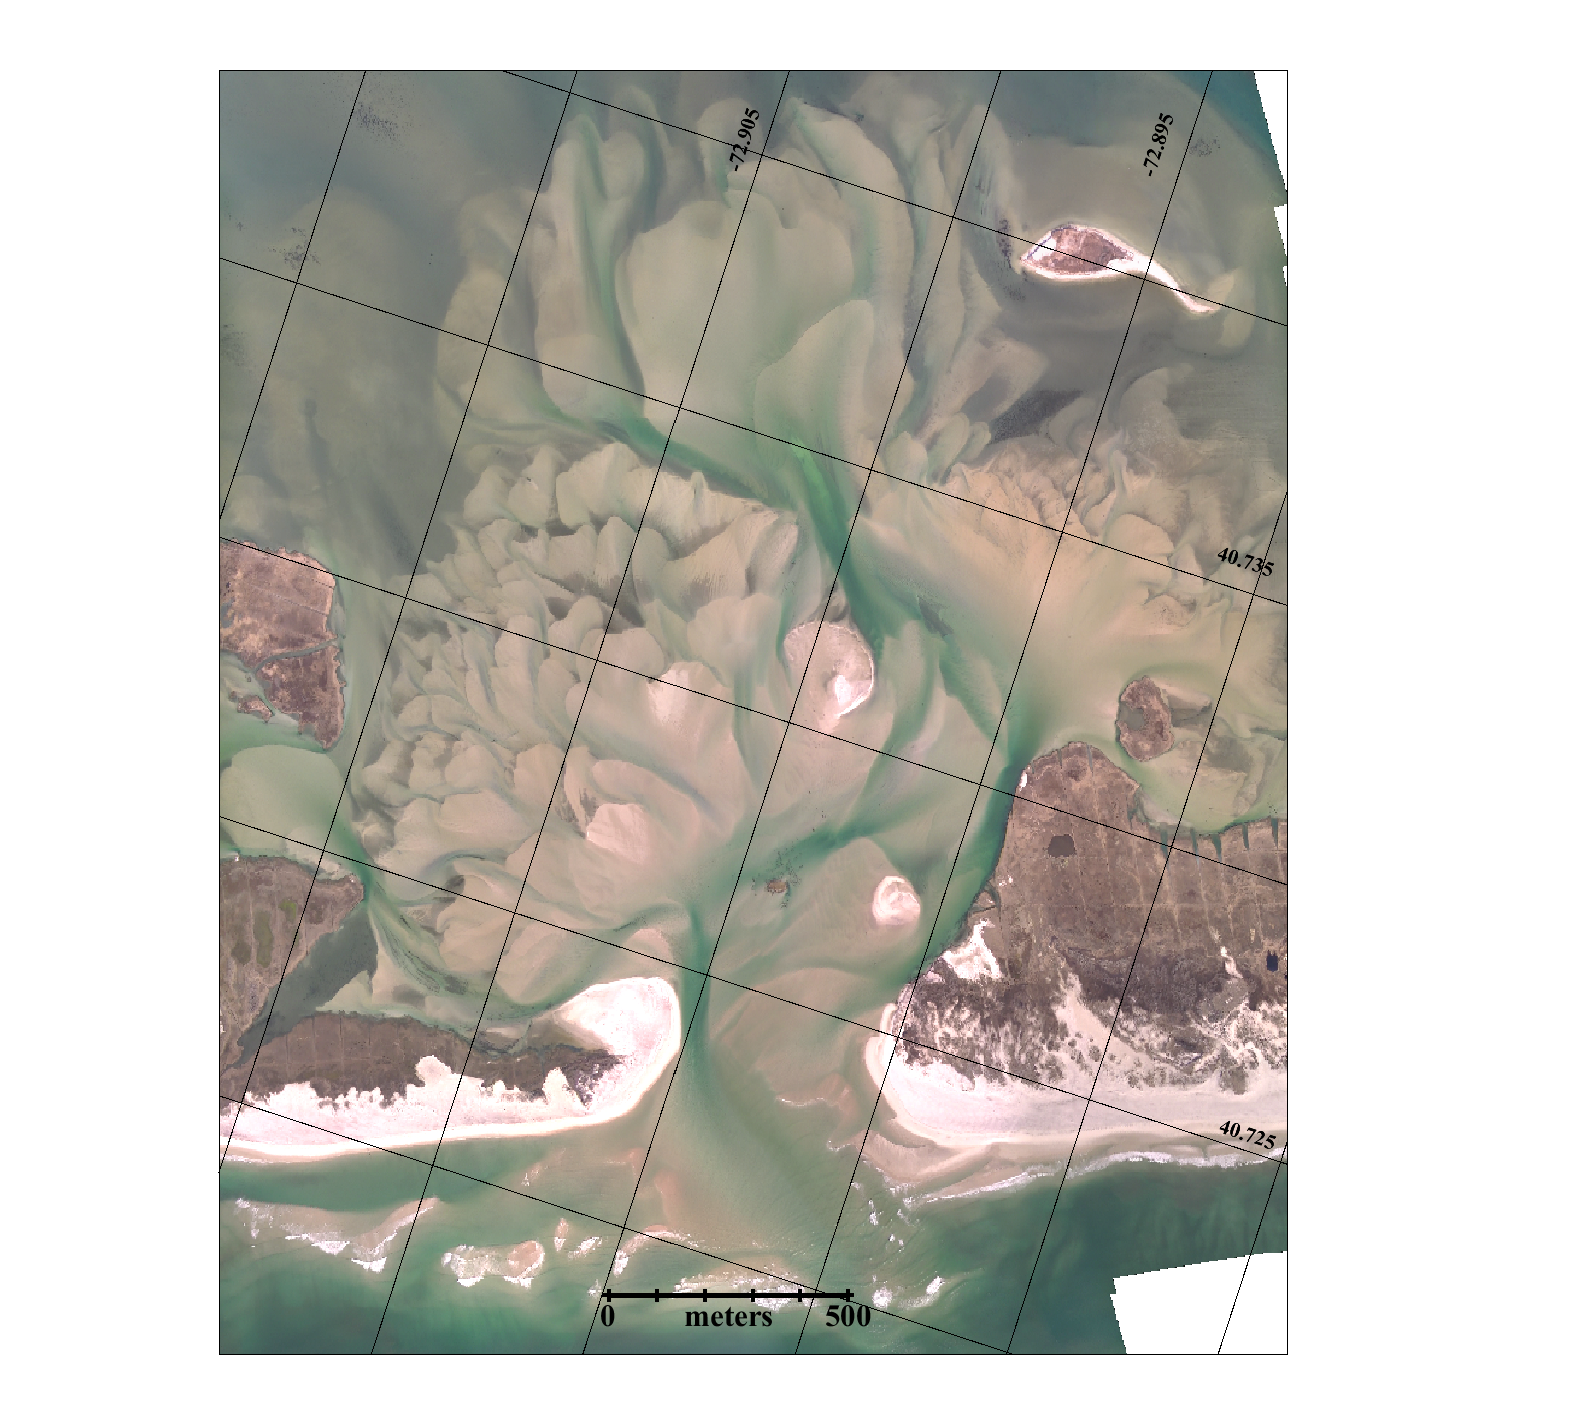
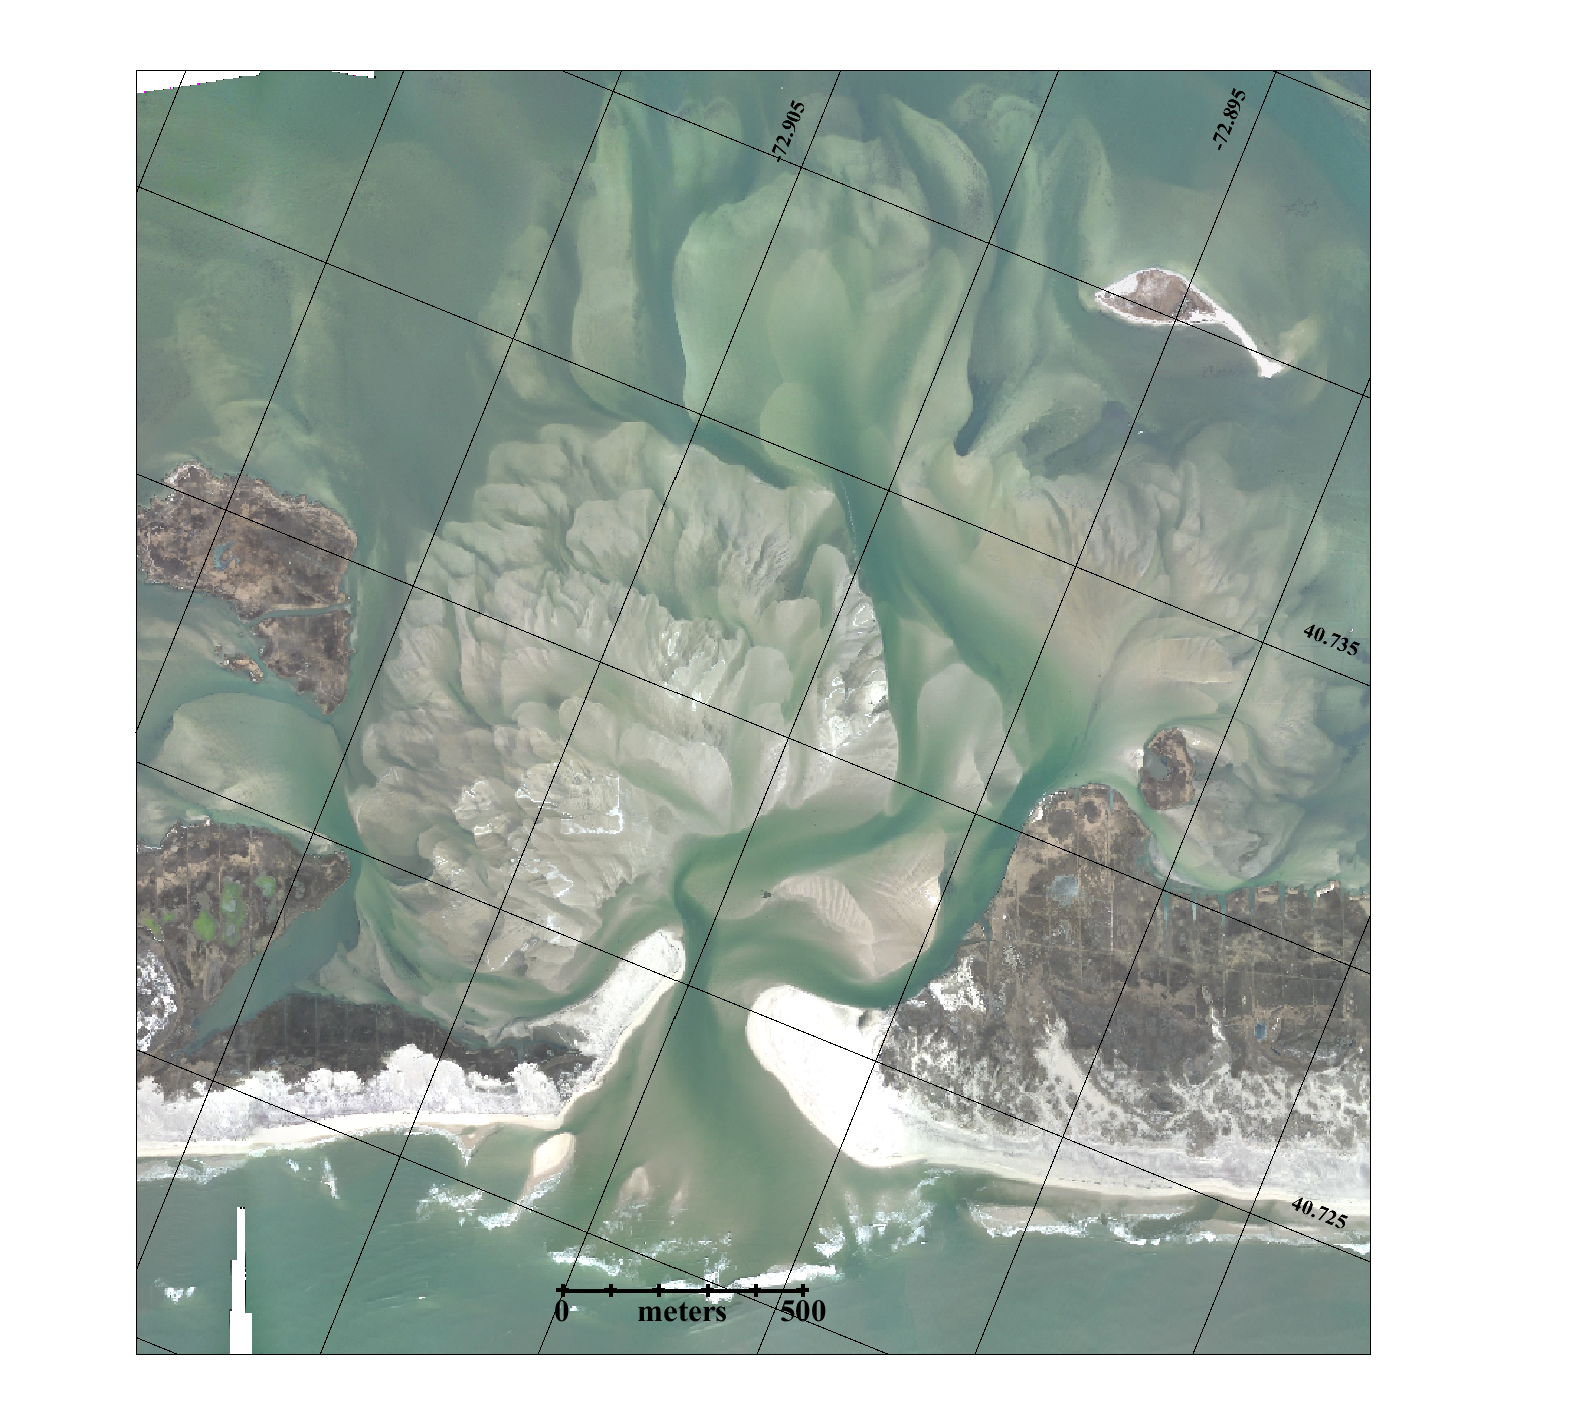
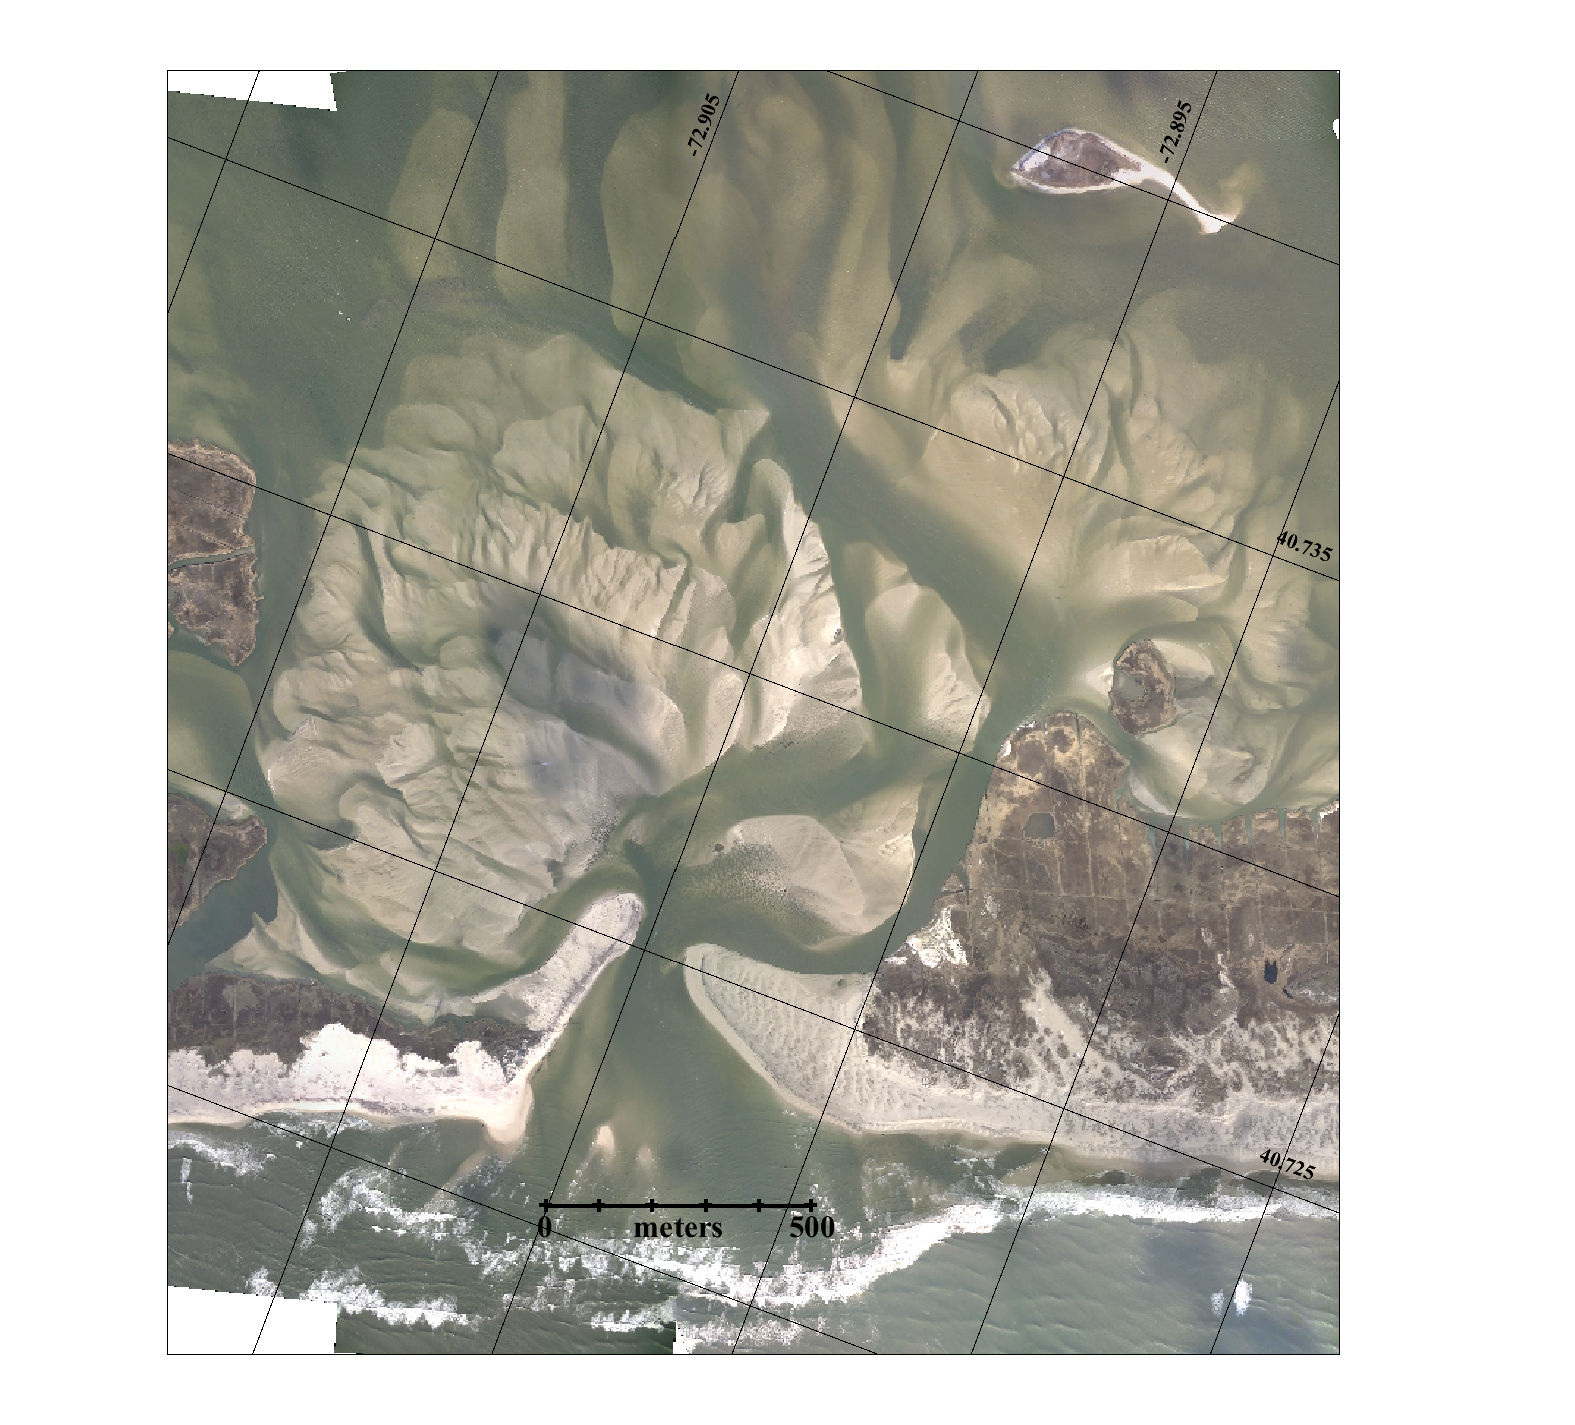
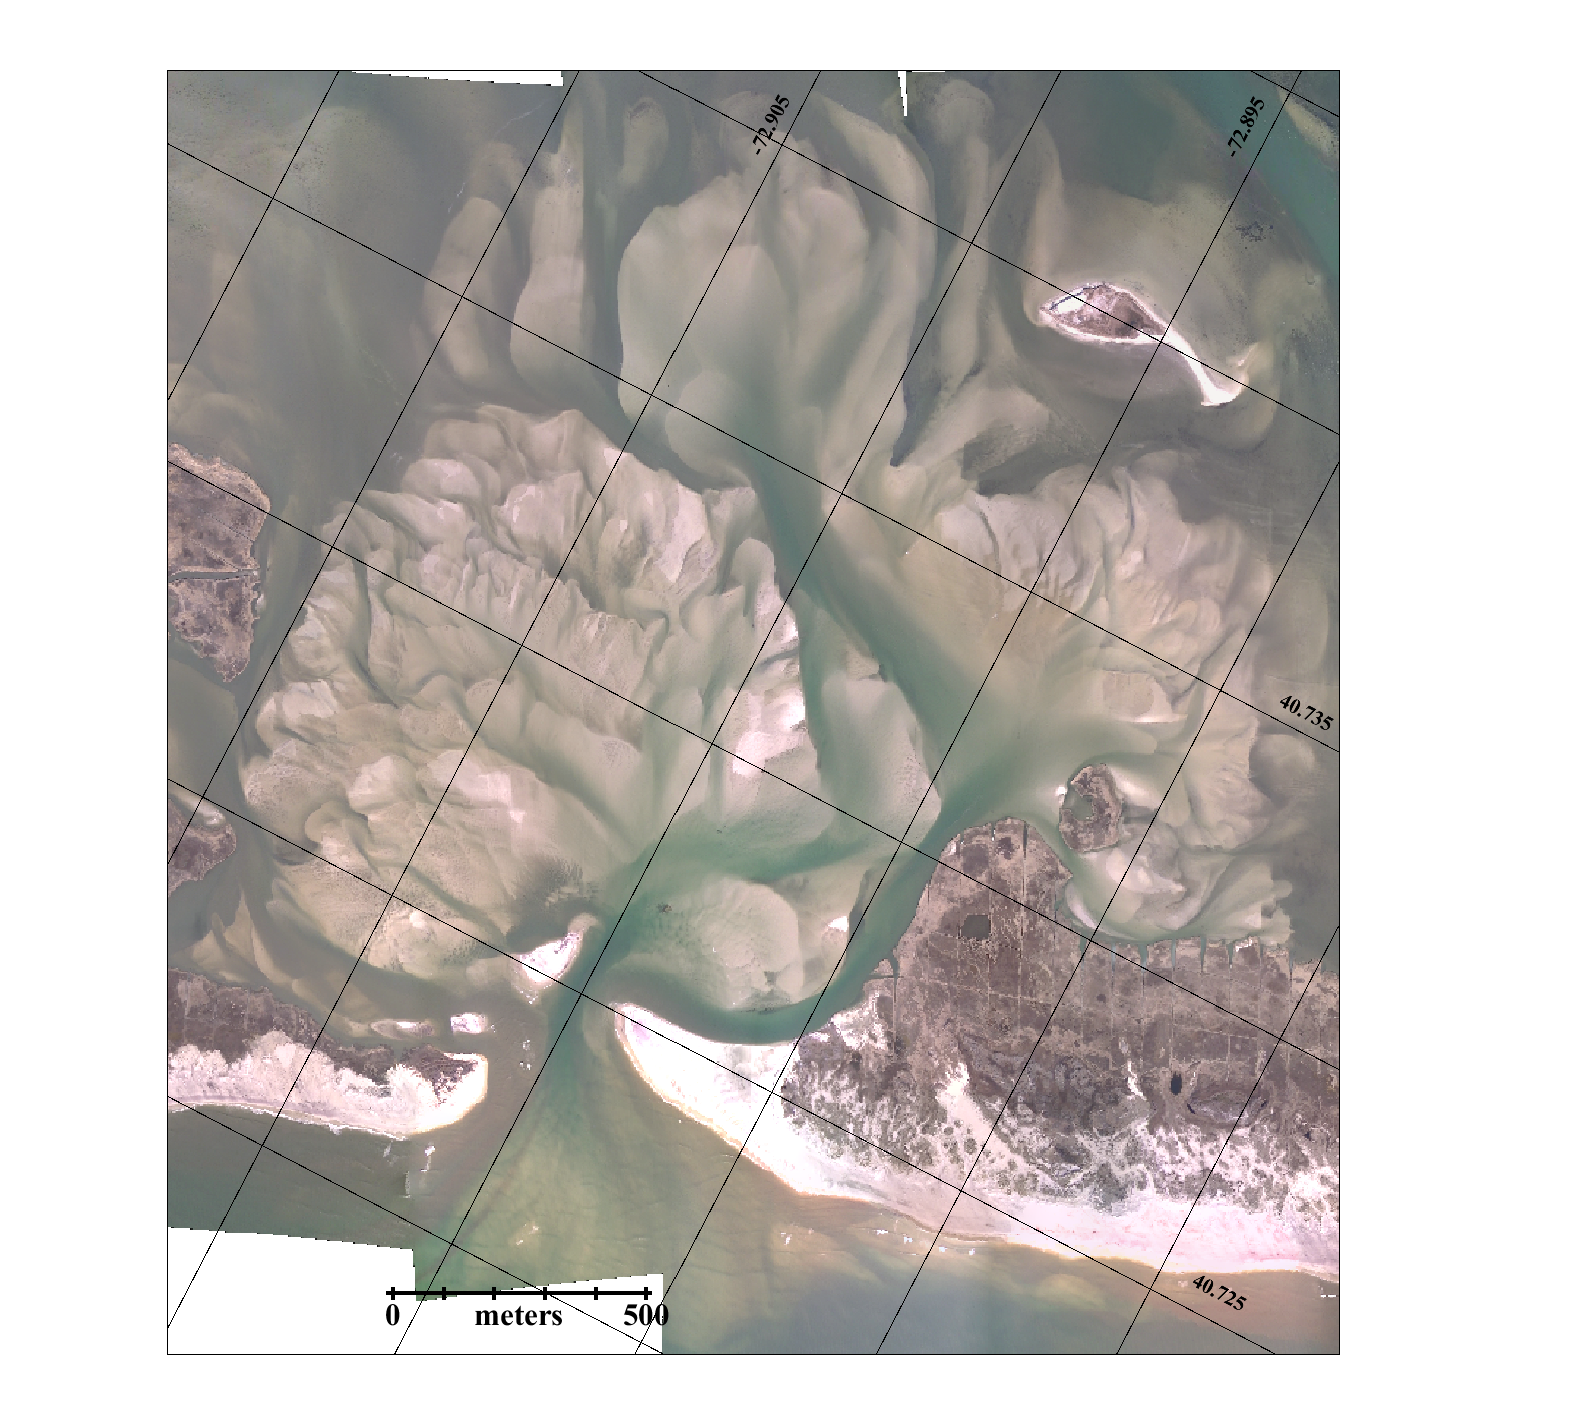
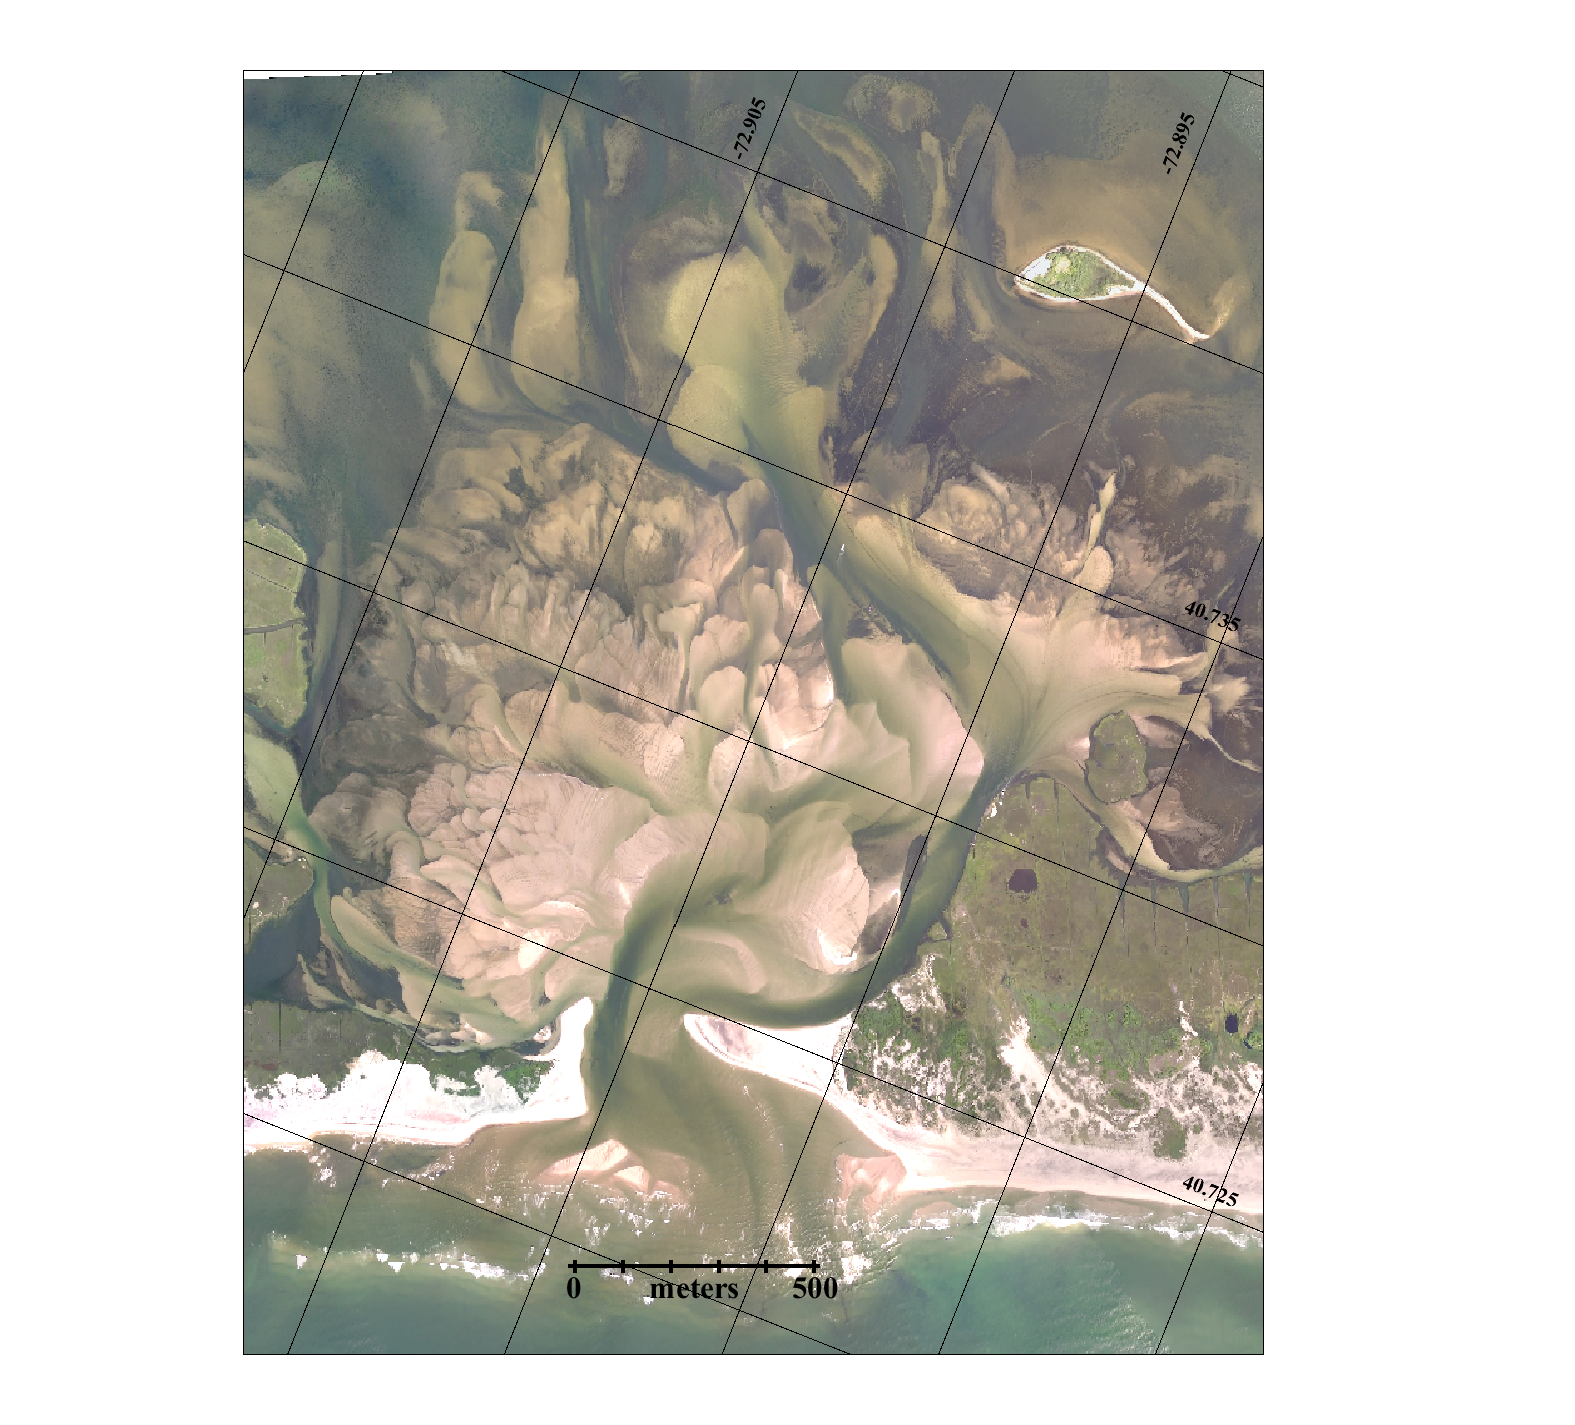
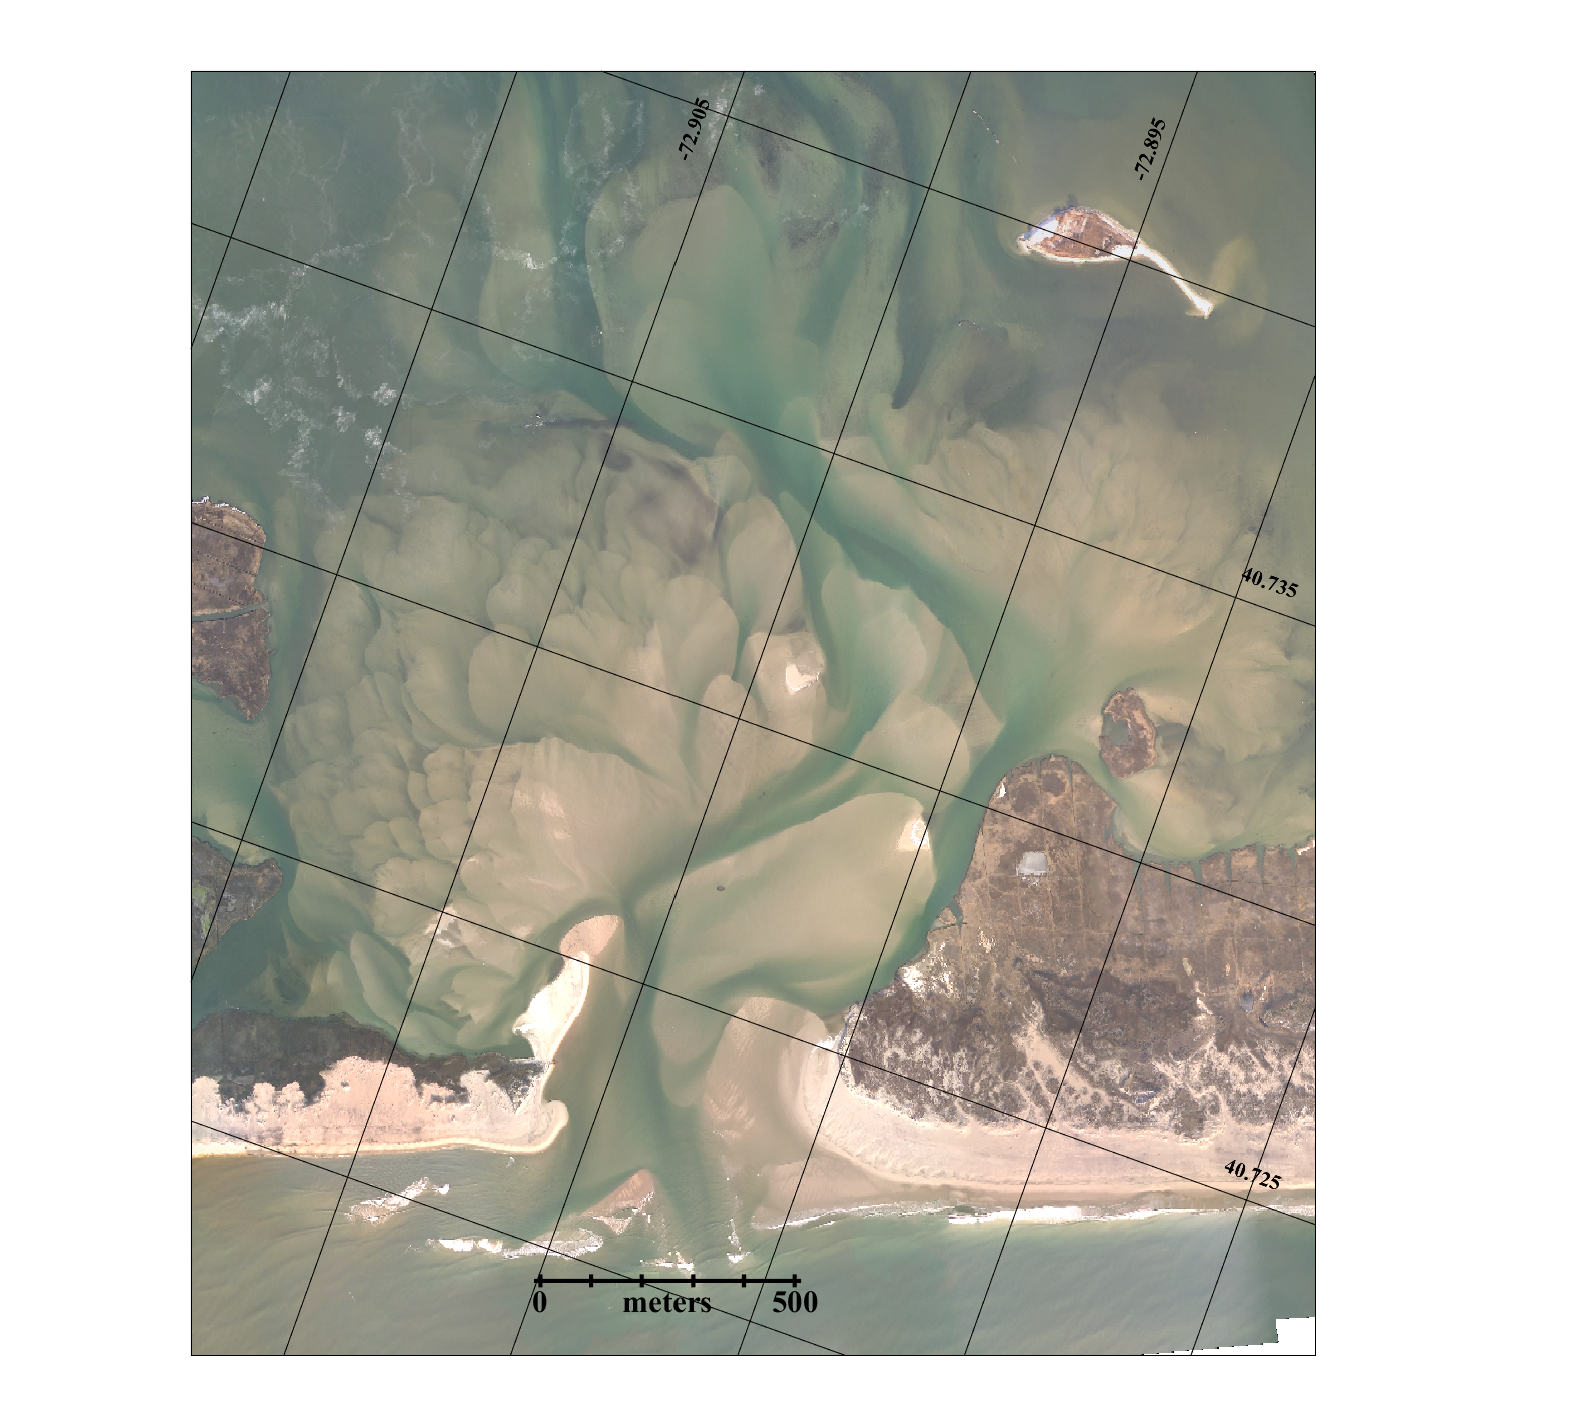
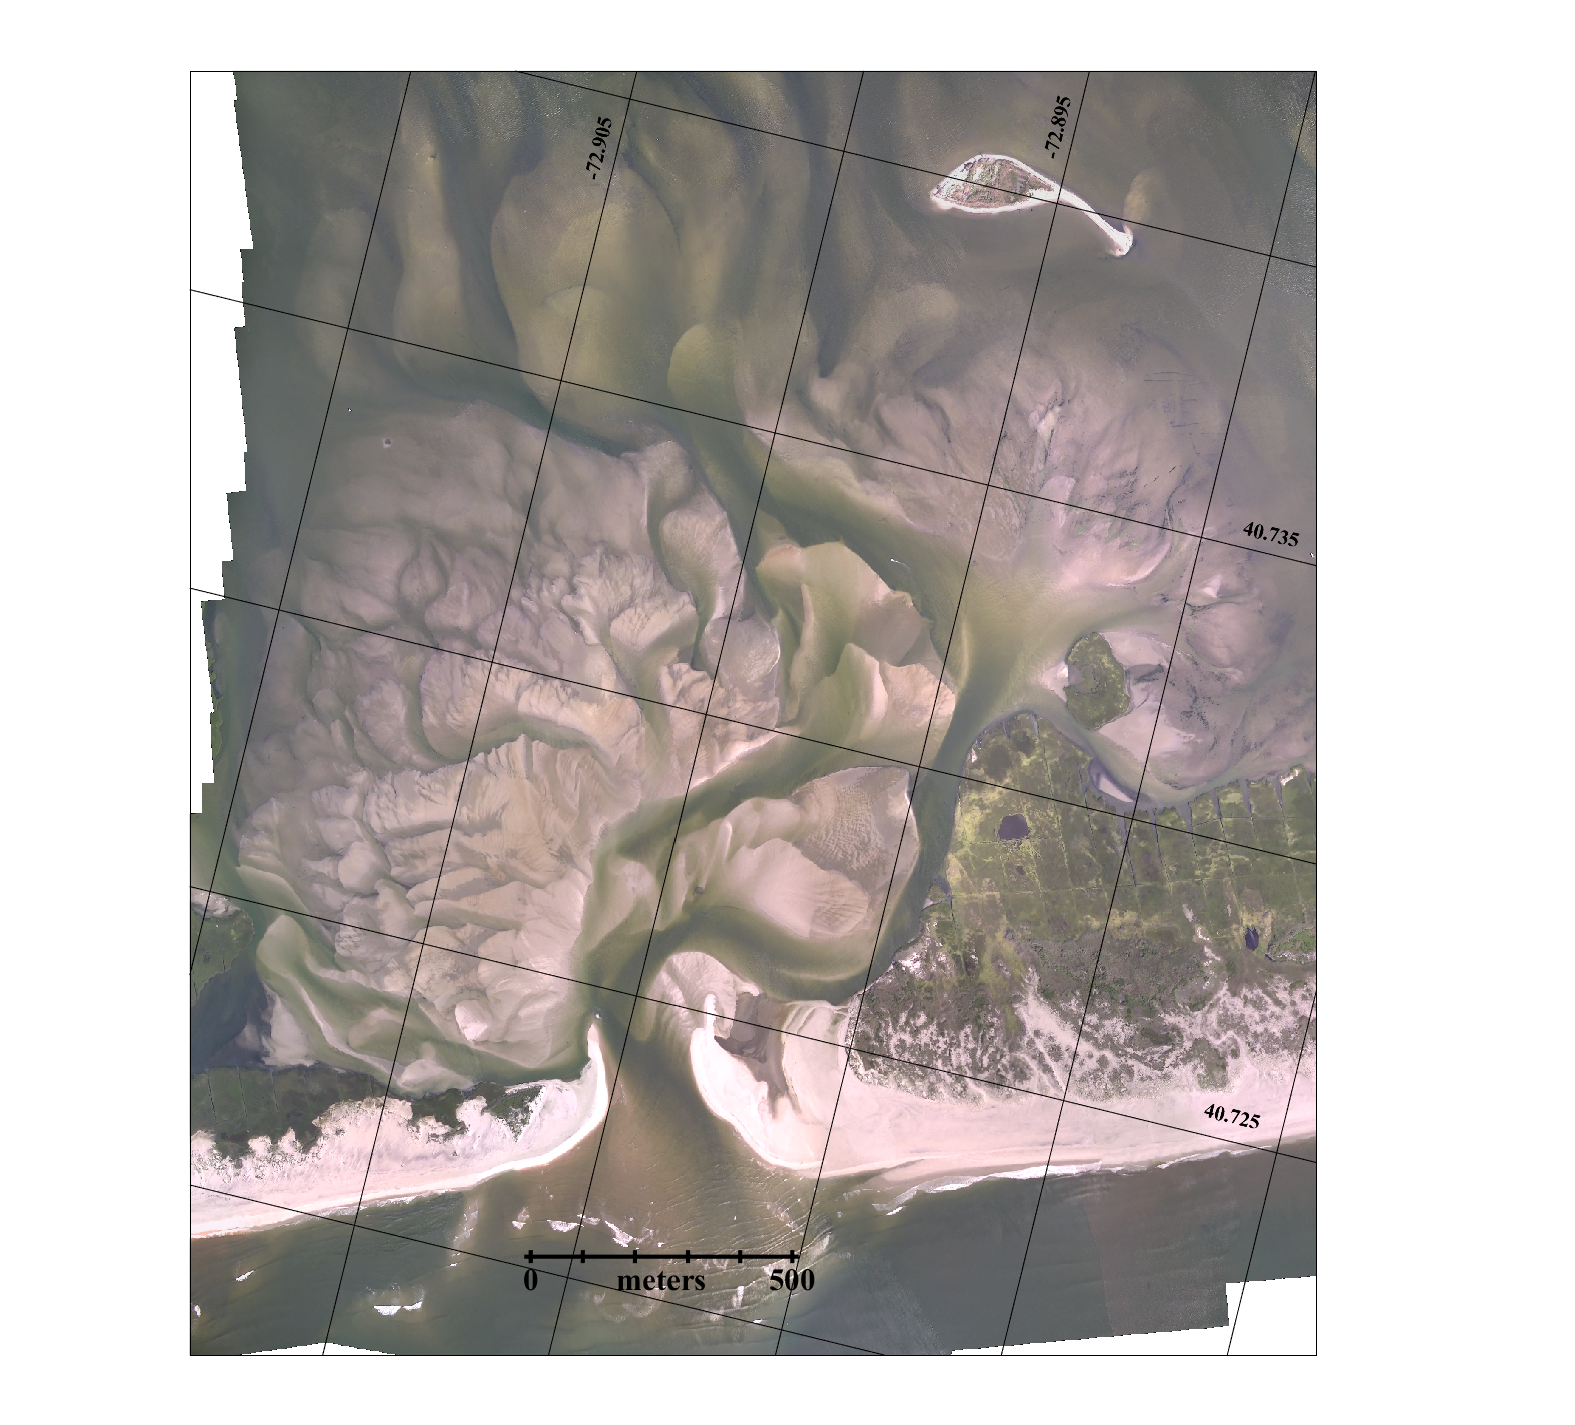
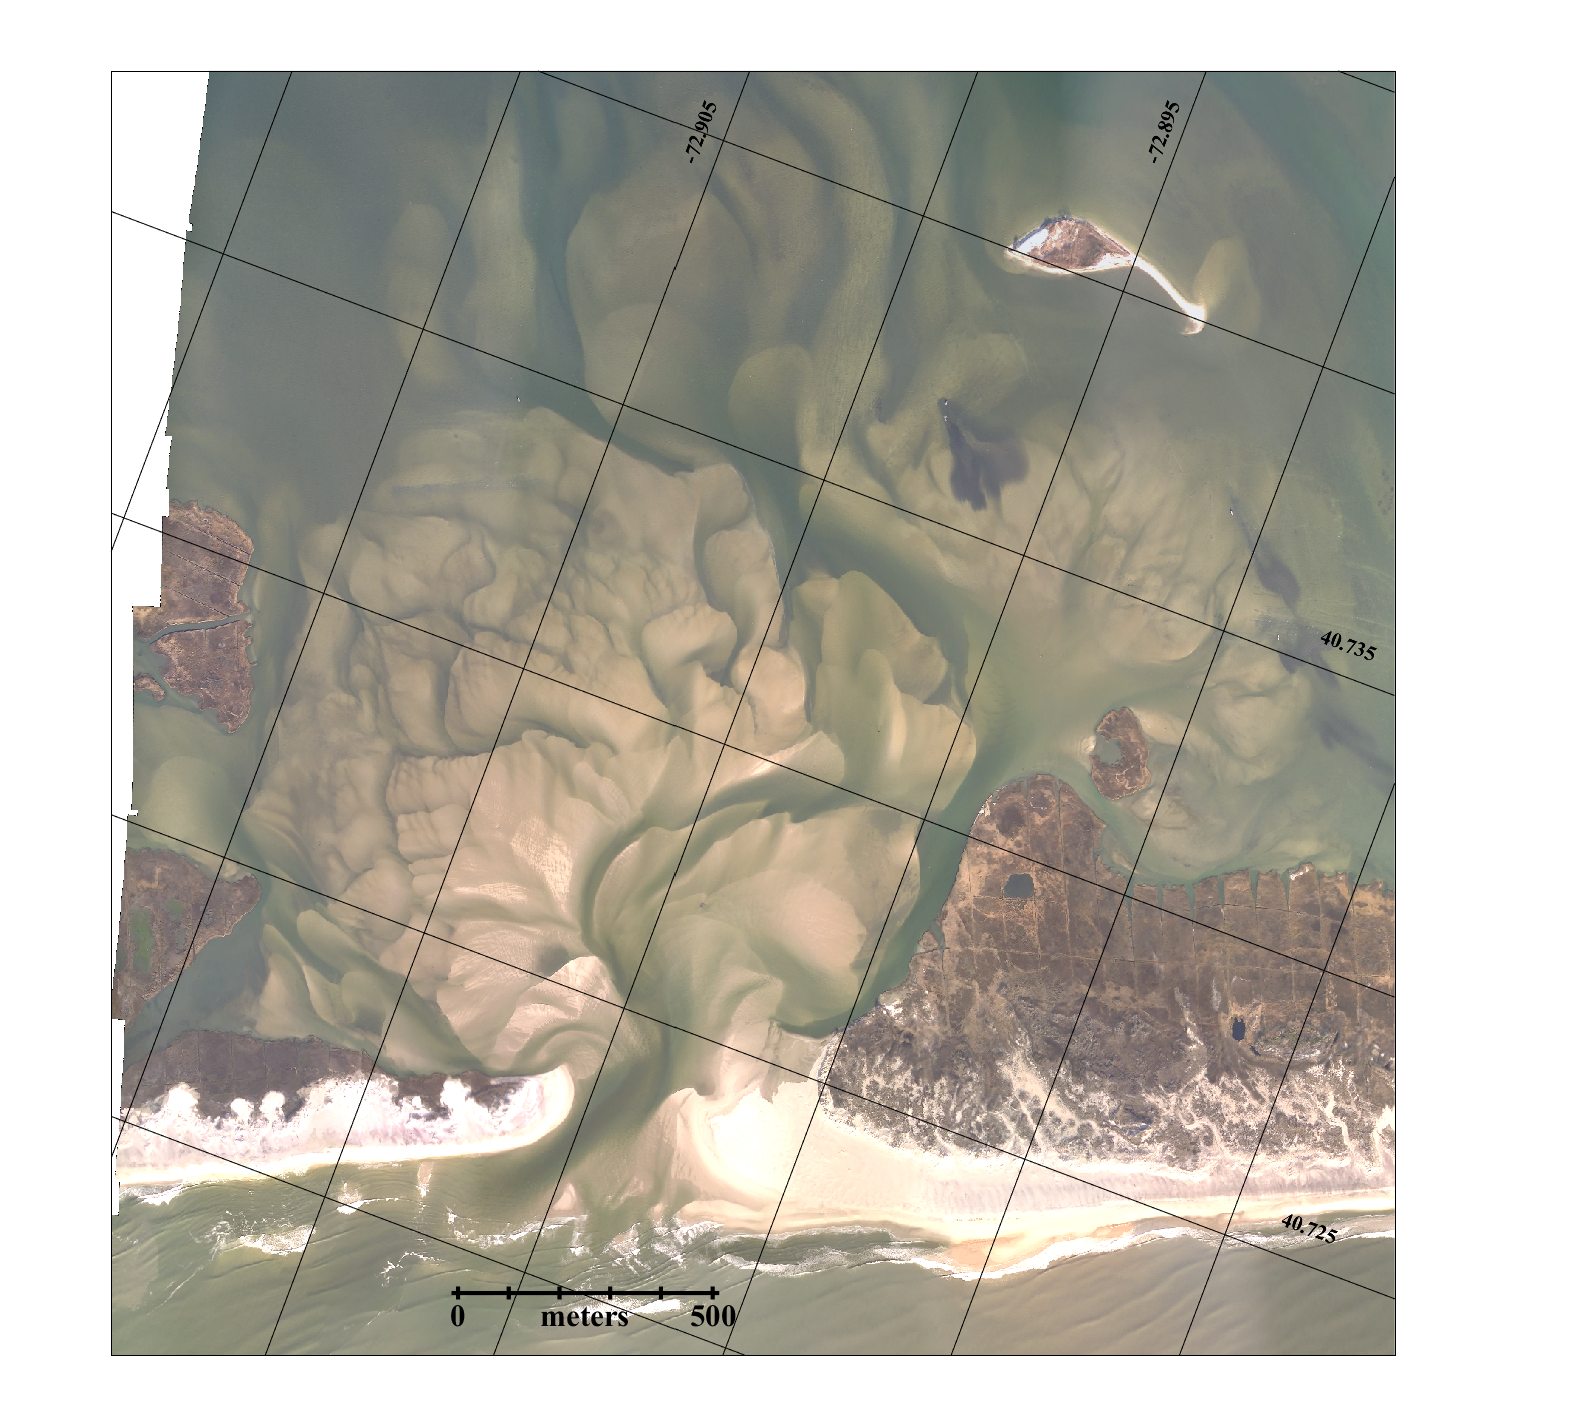
Another weekly
aerial survey of the inlet was carried out on Sunday November
18th which showed that the sand island connecting Pelican Island
to Fire Island had been cut by a new channel to the west.
A series of photos showing the evolution of the inlet is given here.
On Saturday
December 1, 2012 there was a meeting at Bellport's community
center to discuss the breach in the Old Inlet area. A power point presentation
given at that meeting shows how the dynamics of the Great South
Bay and the ocean resulted in the formation of the breach and
how the breach has affected the tides, wind driven storm surge
and the salinity of the eastern end of the Bay.
A follow-up
meeting on the developments of the breach, now referred to as
New Inlet, took place on March 23, 2013 at the Bellport Middle
School. Charles Flagg gave a power point presentation to the meeting
attended by about 500 people to hear position reports from the
FINS and the NYDEC, and presentations by Charles Flagg, Kevin
McAlaster and Joe Gagliano.
Presentations by
Charles Flagg, Christopher Gobler, Chris Soler, Jim Gilmore,
Tony Graves and Joe Gagliano took place at the Bellport Middle
School on December 21, 2013 to outline the current status of the
New Inlet and initiation of the NPS's Environmental Impact
Statement project. Flagg's power point presentation is
available here.
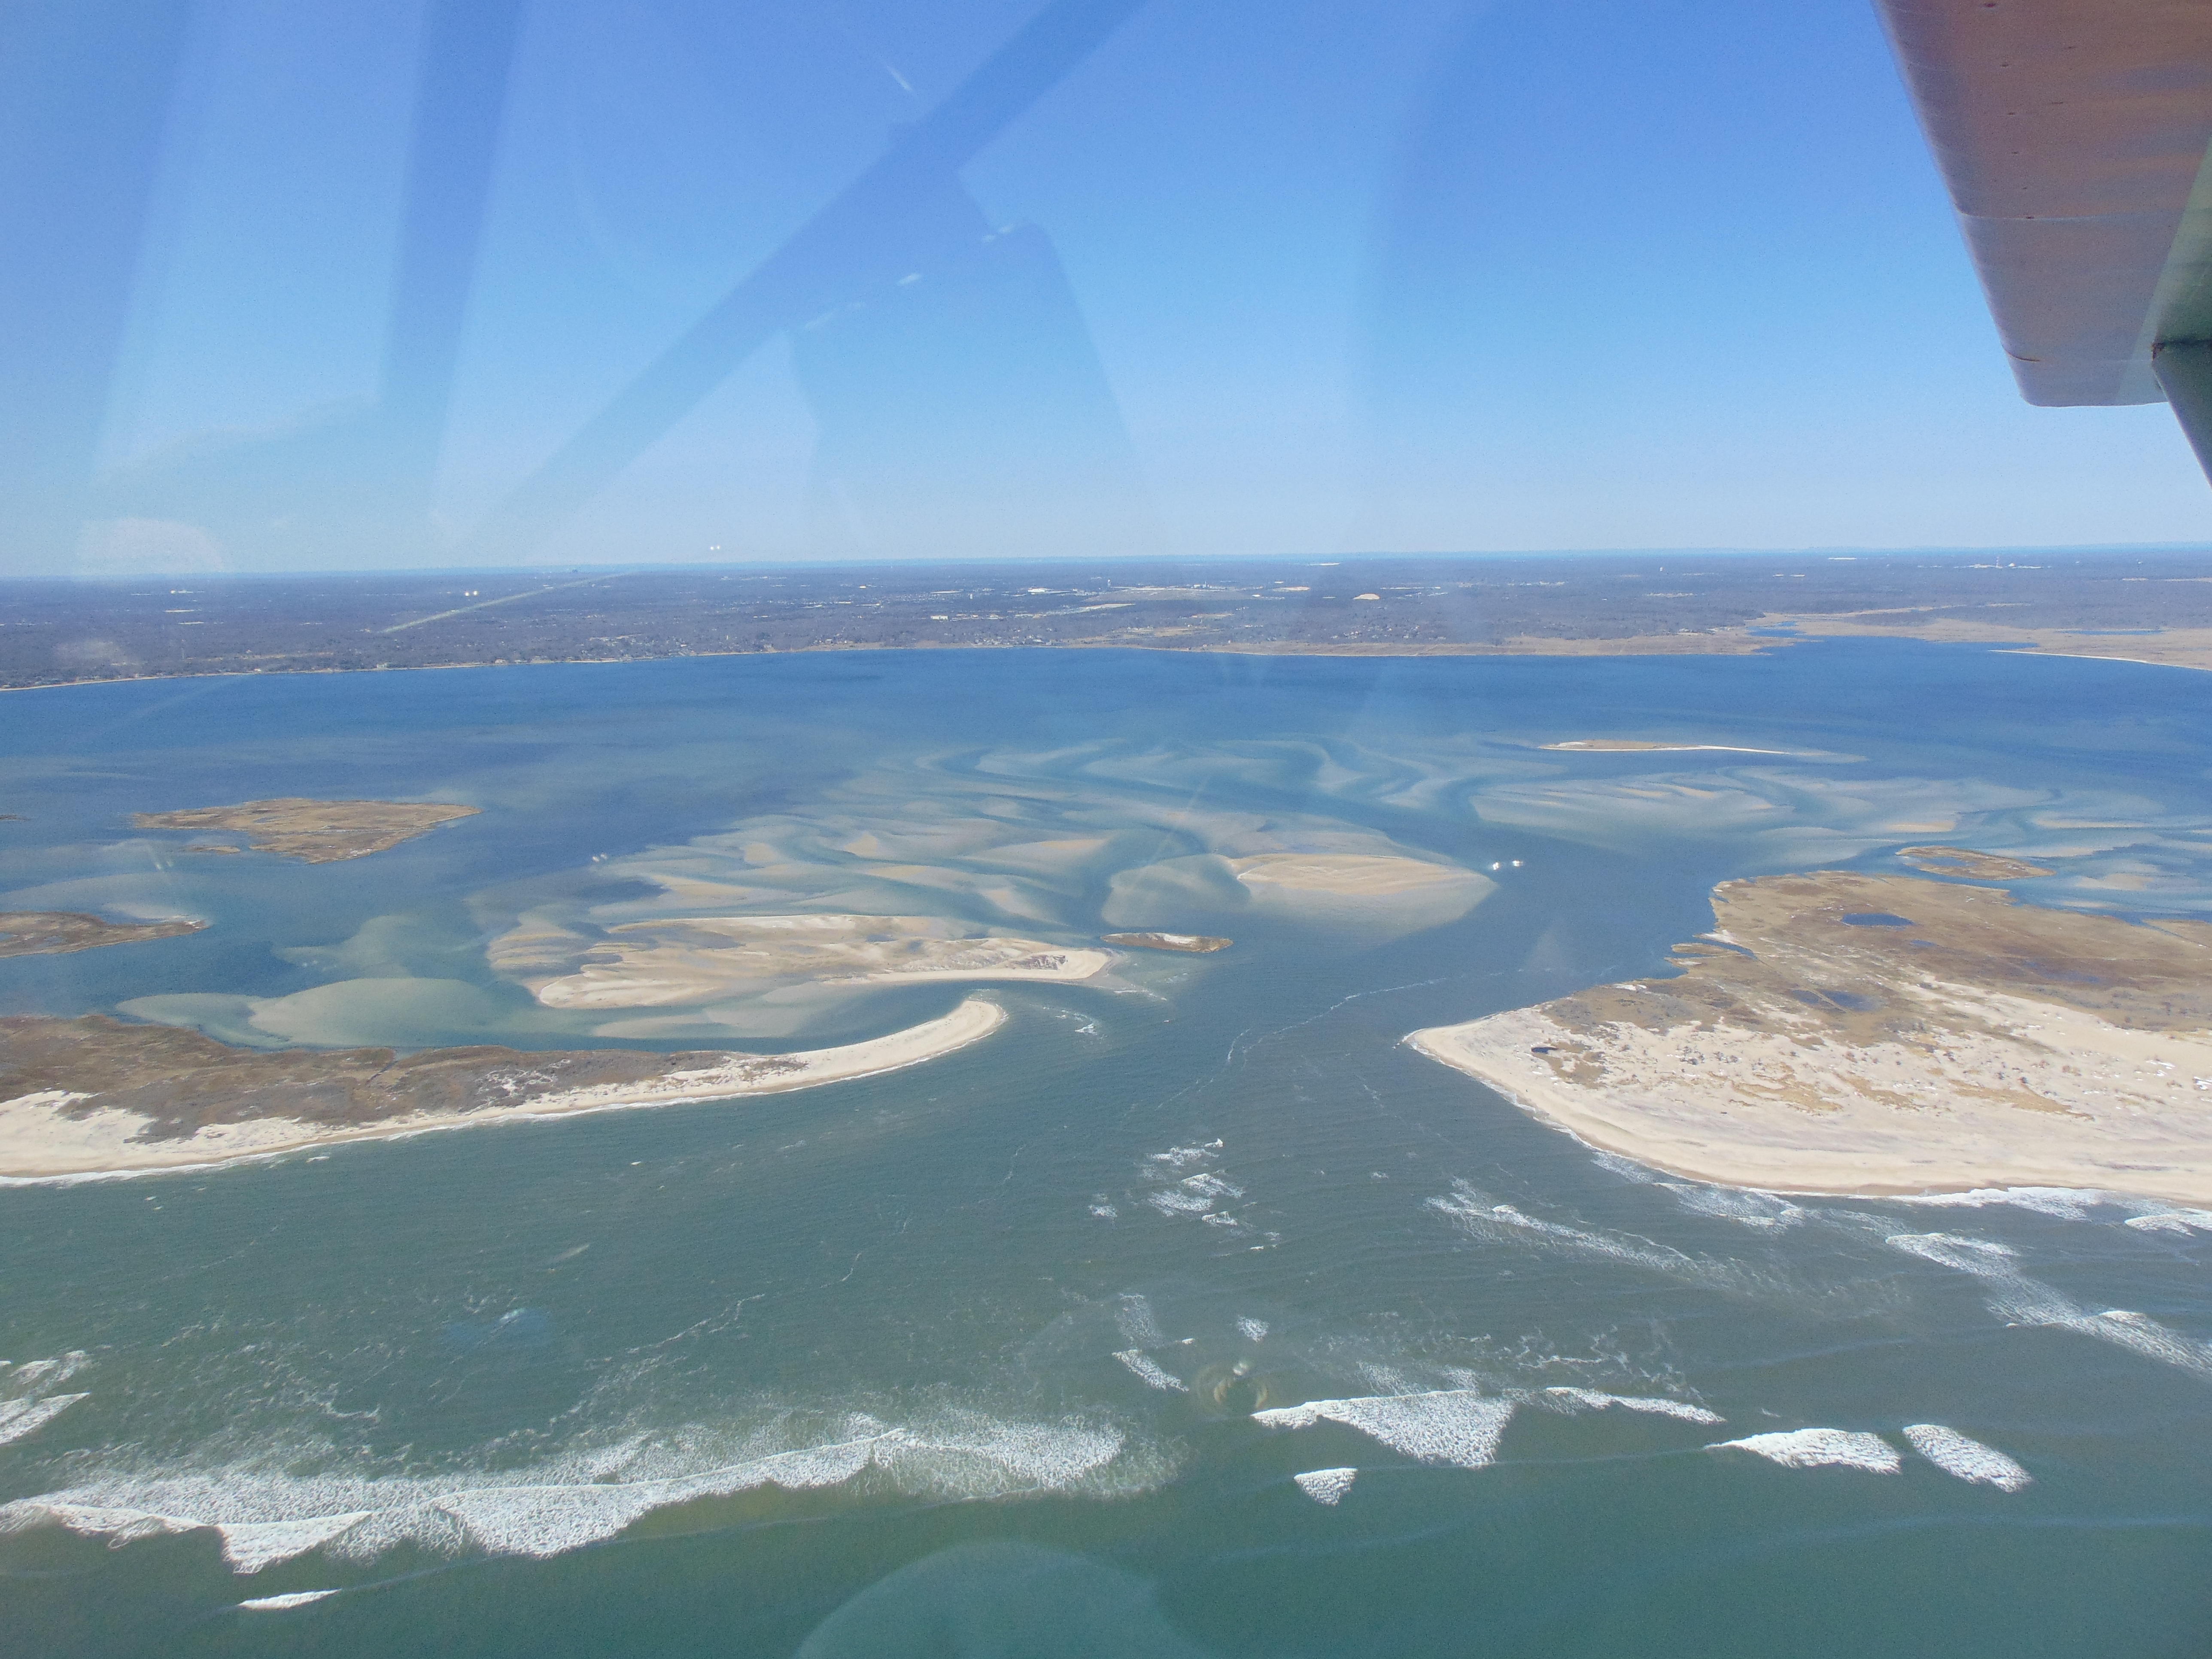
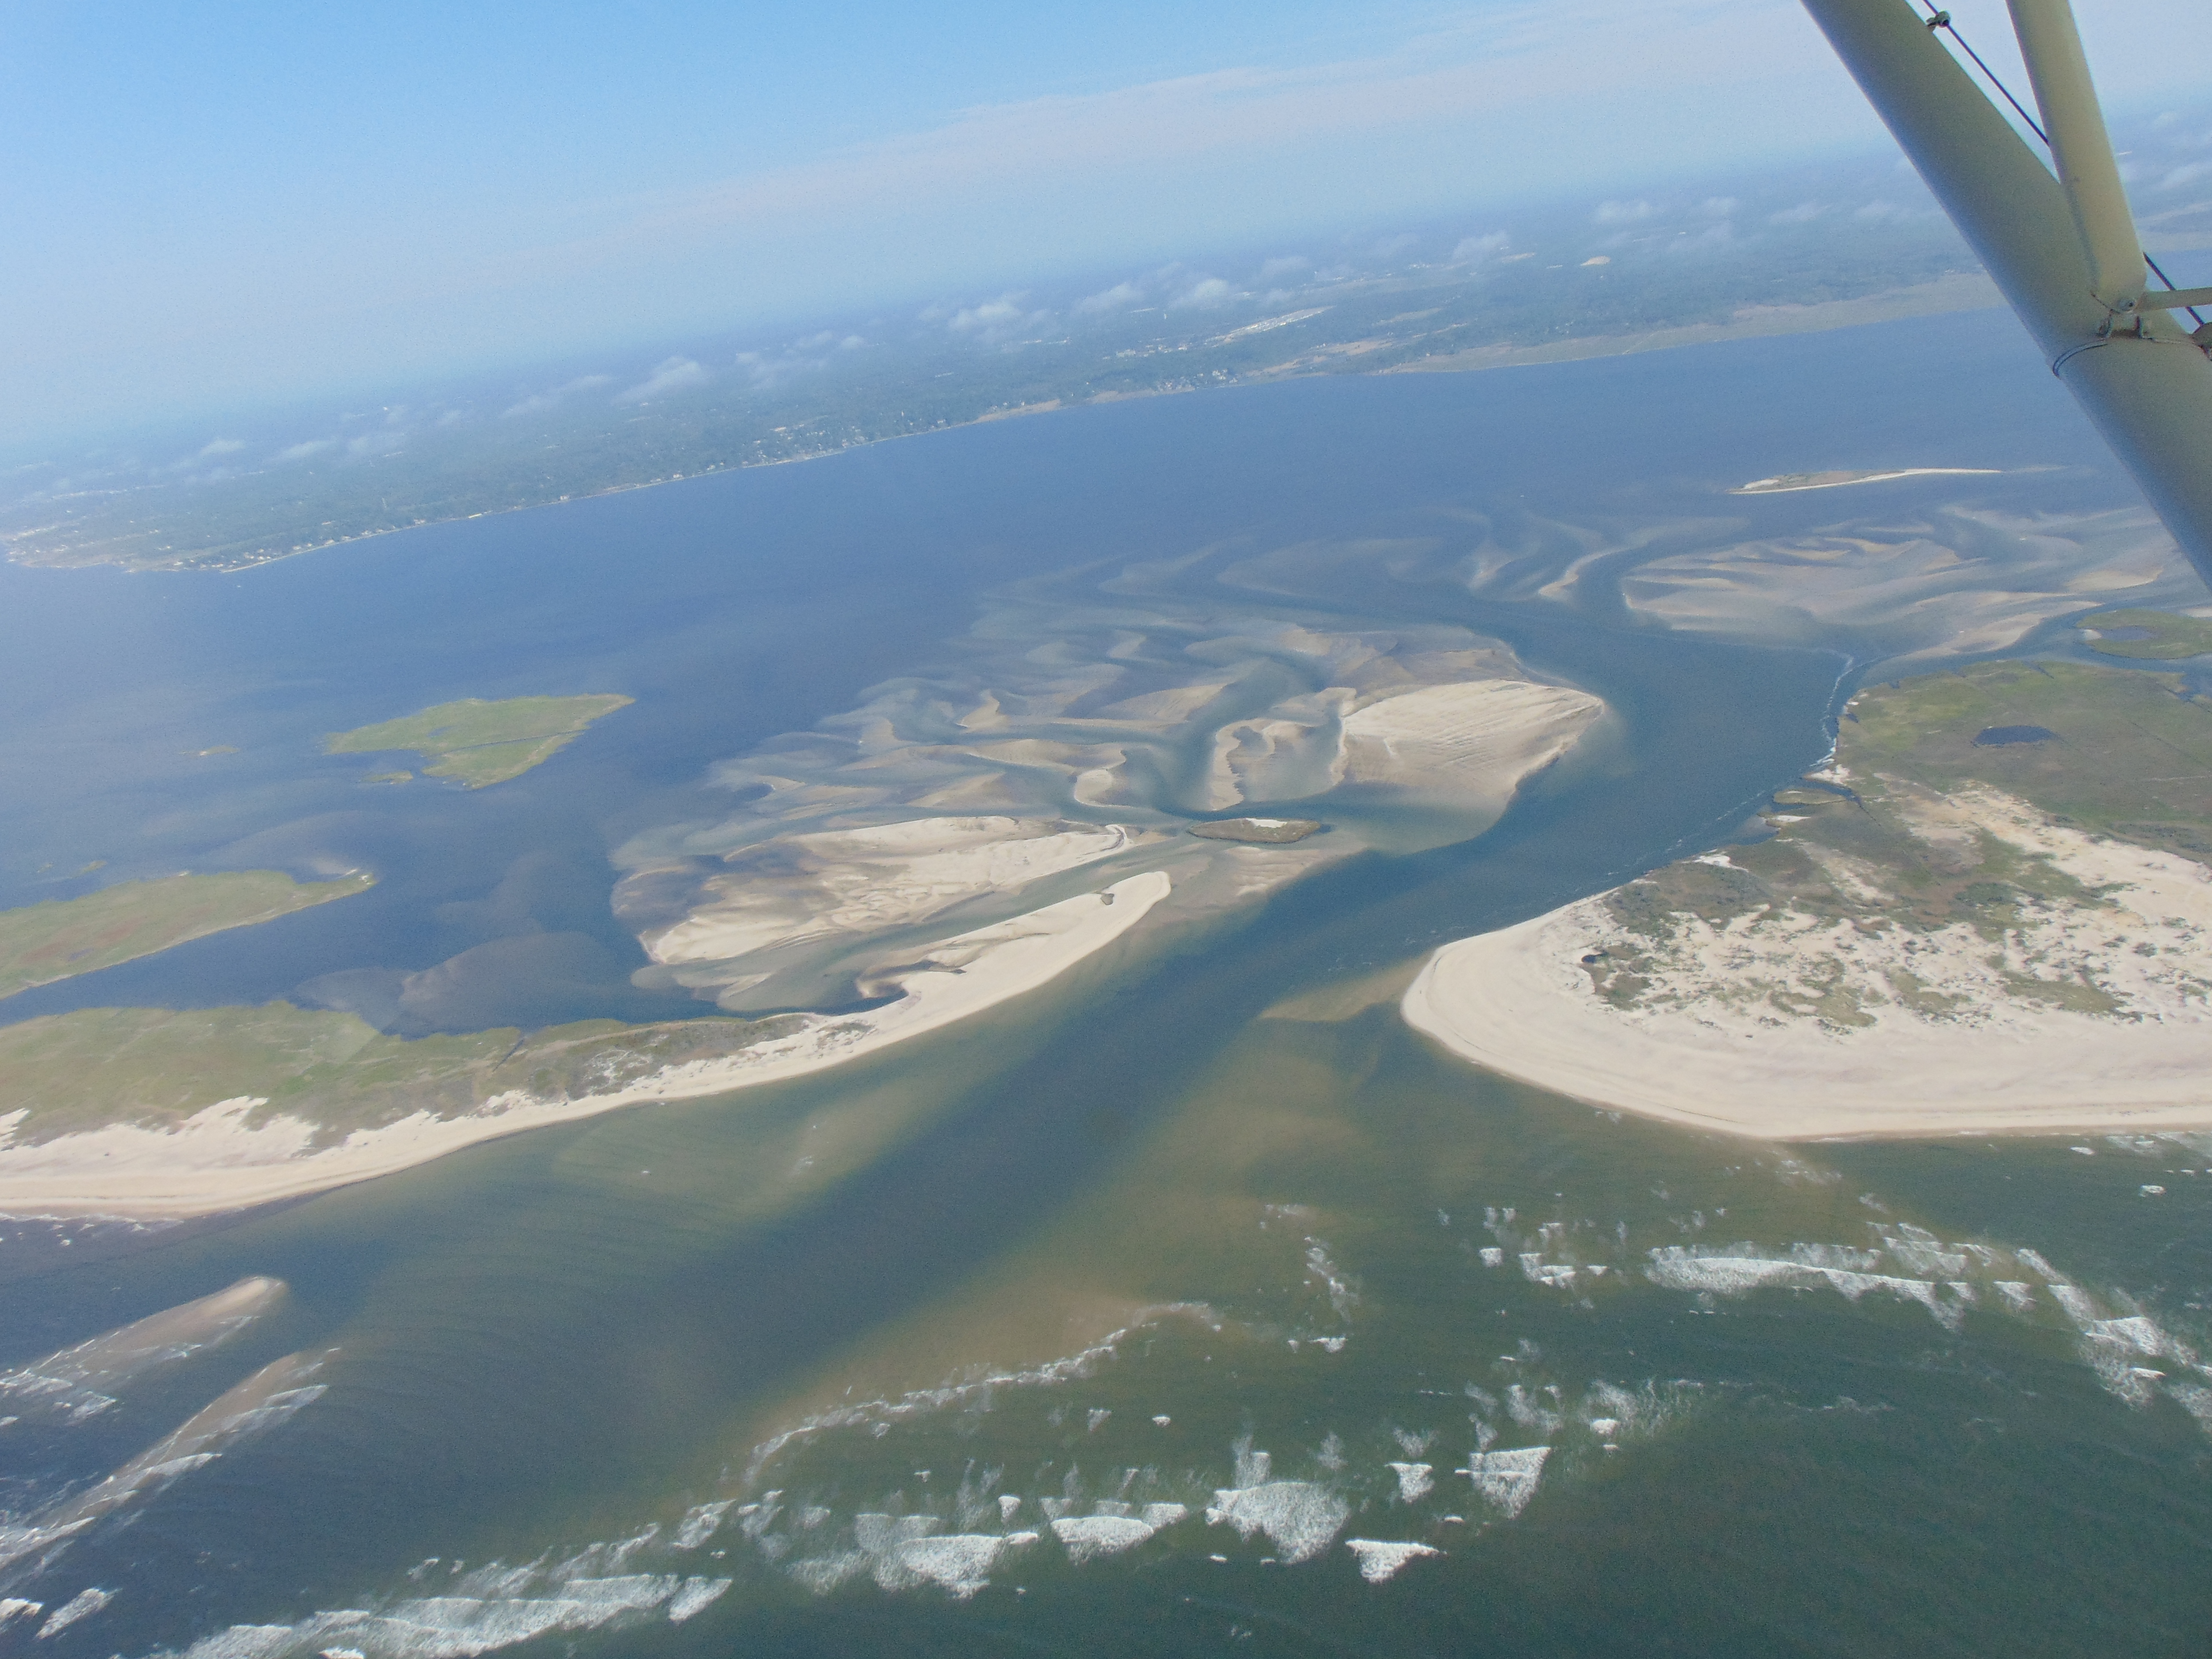
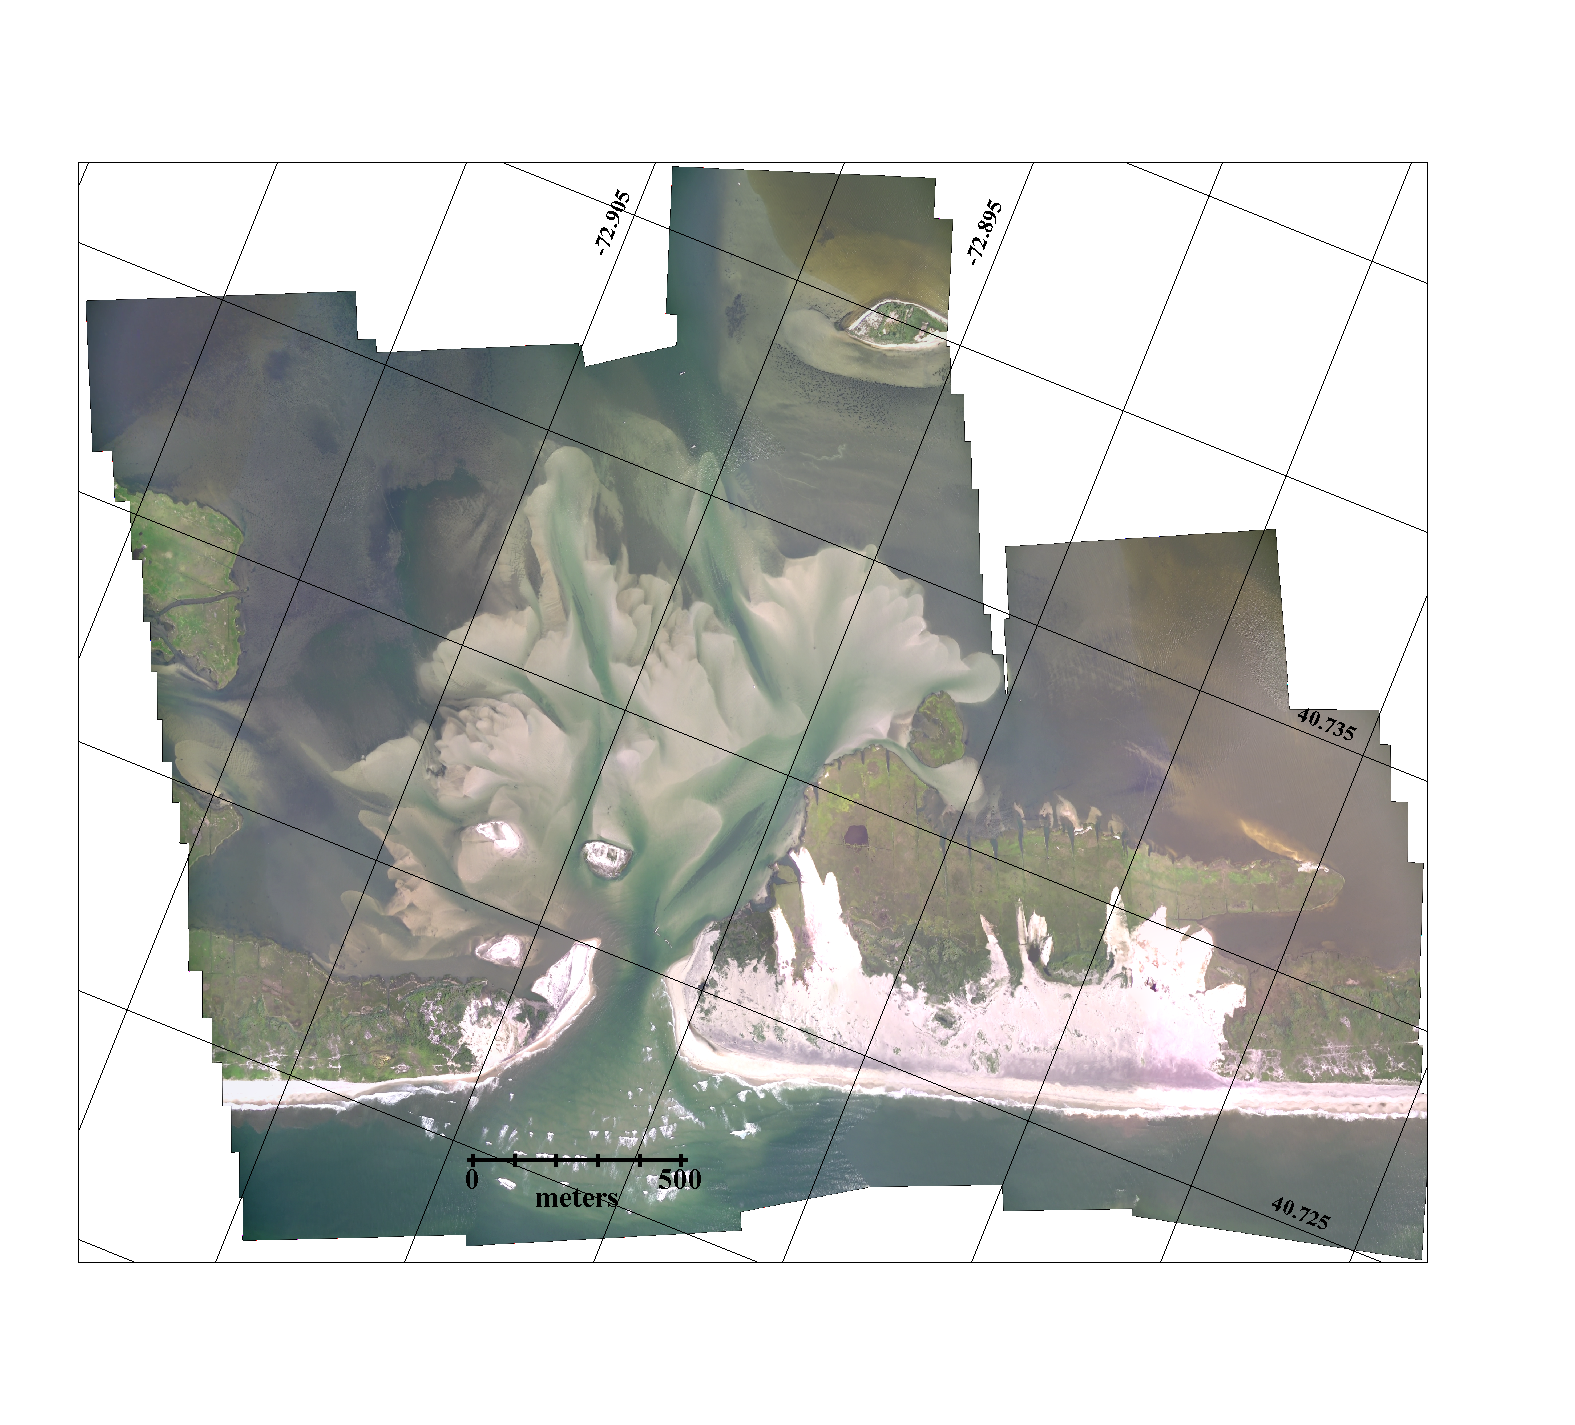
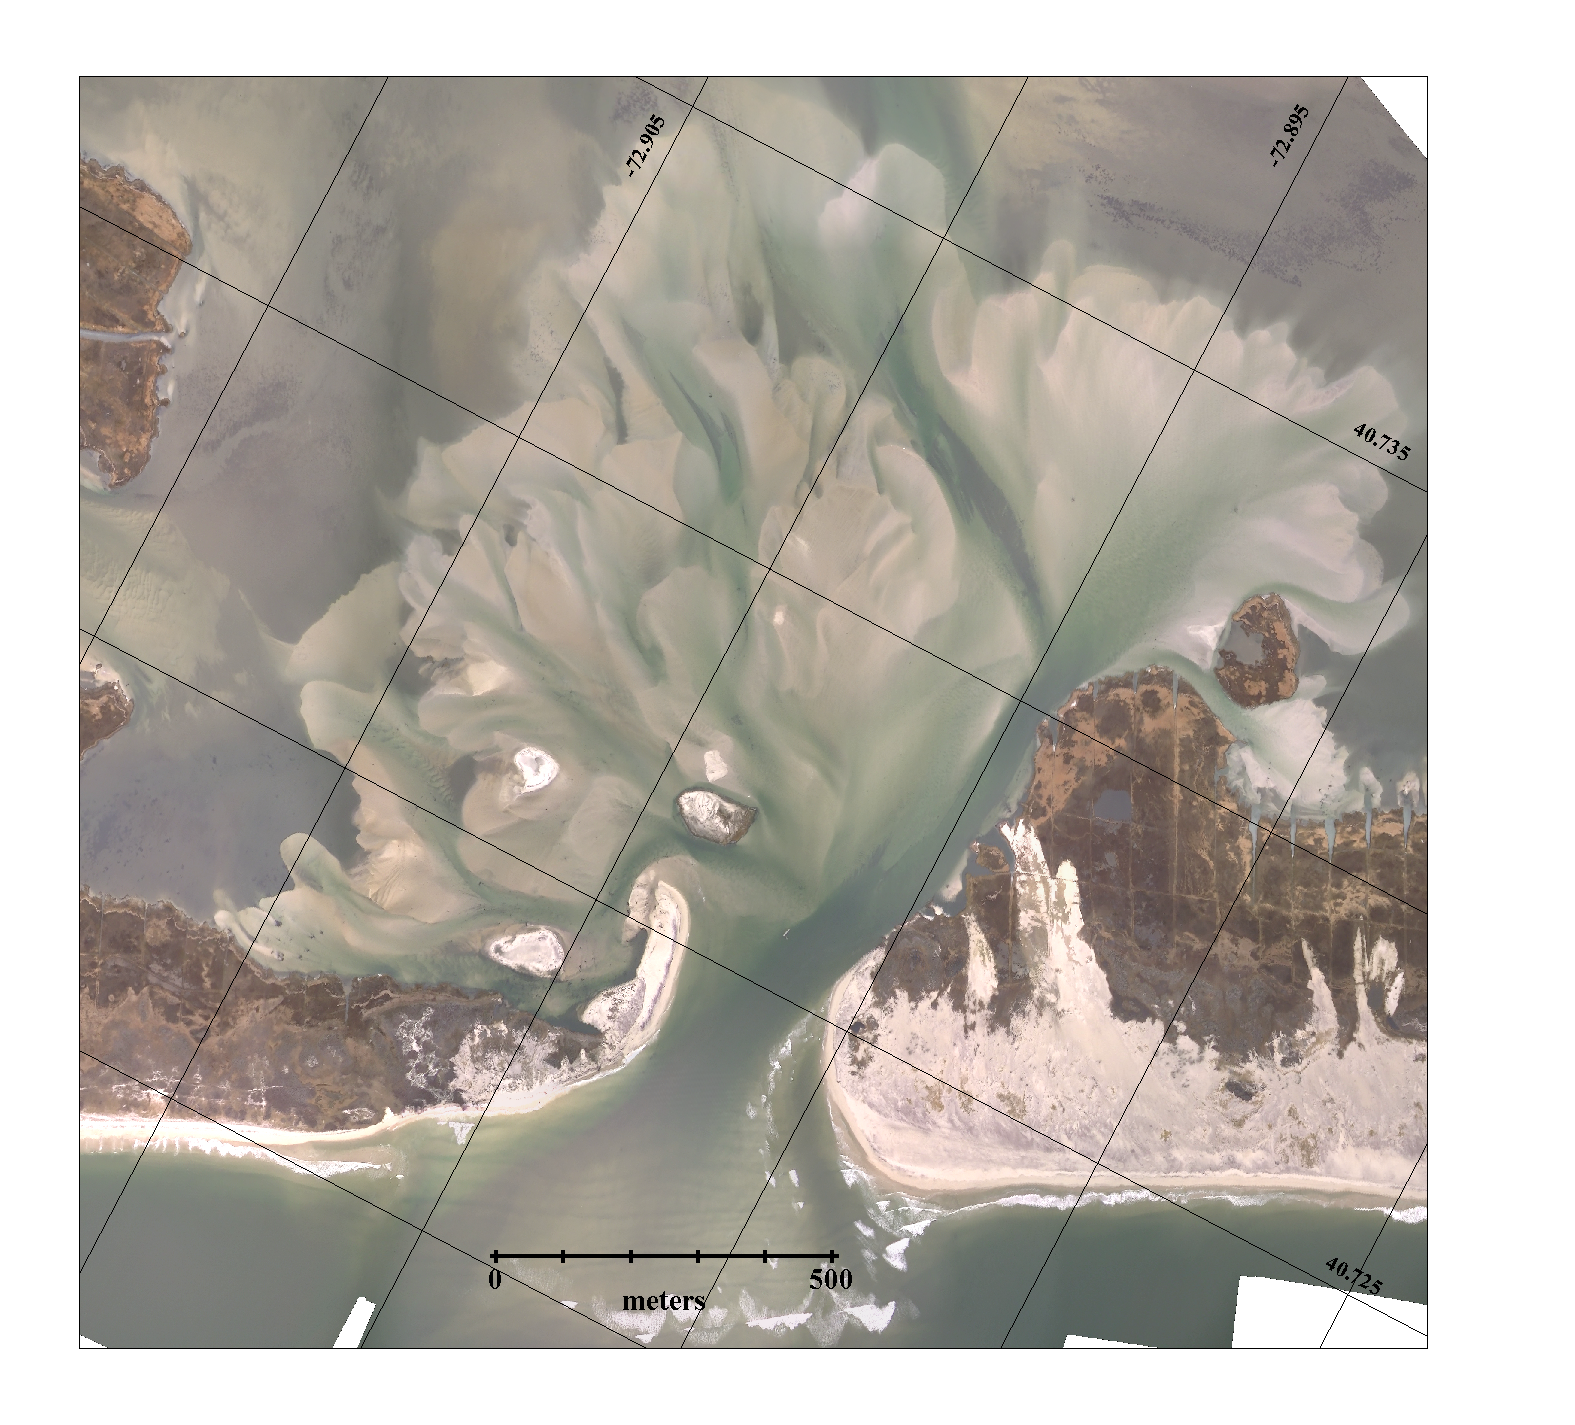
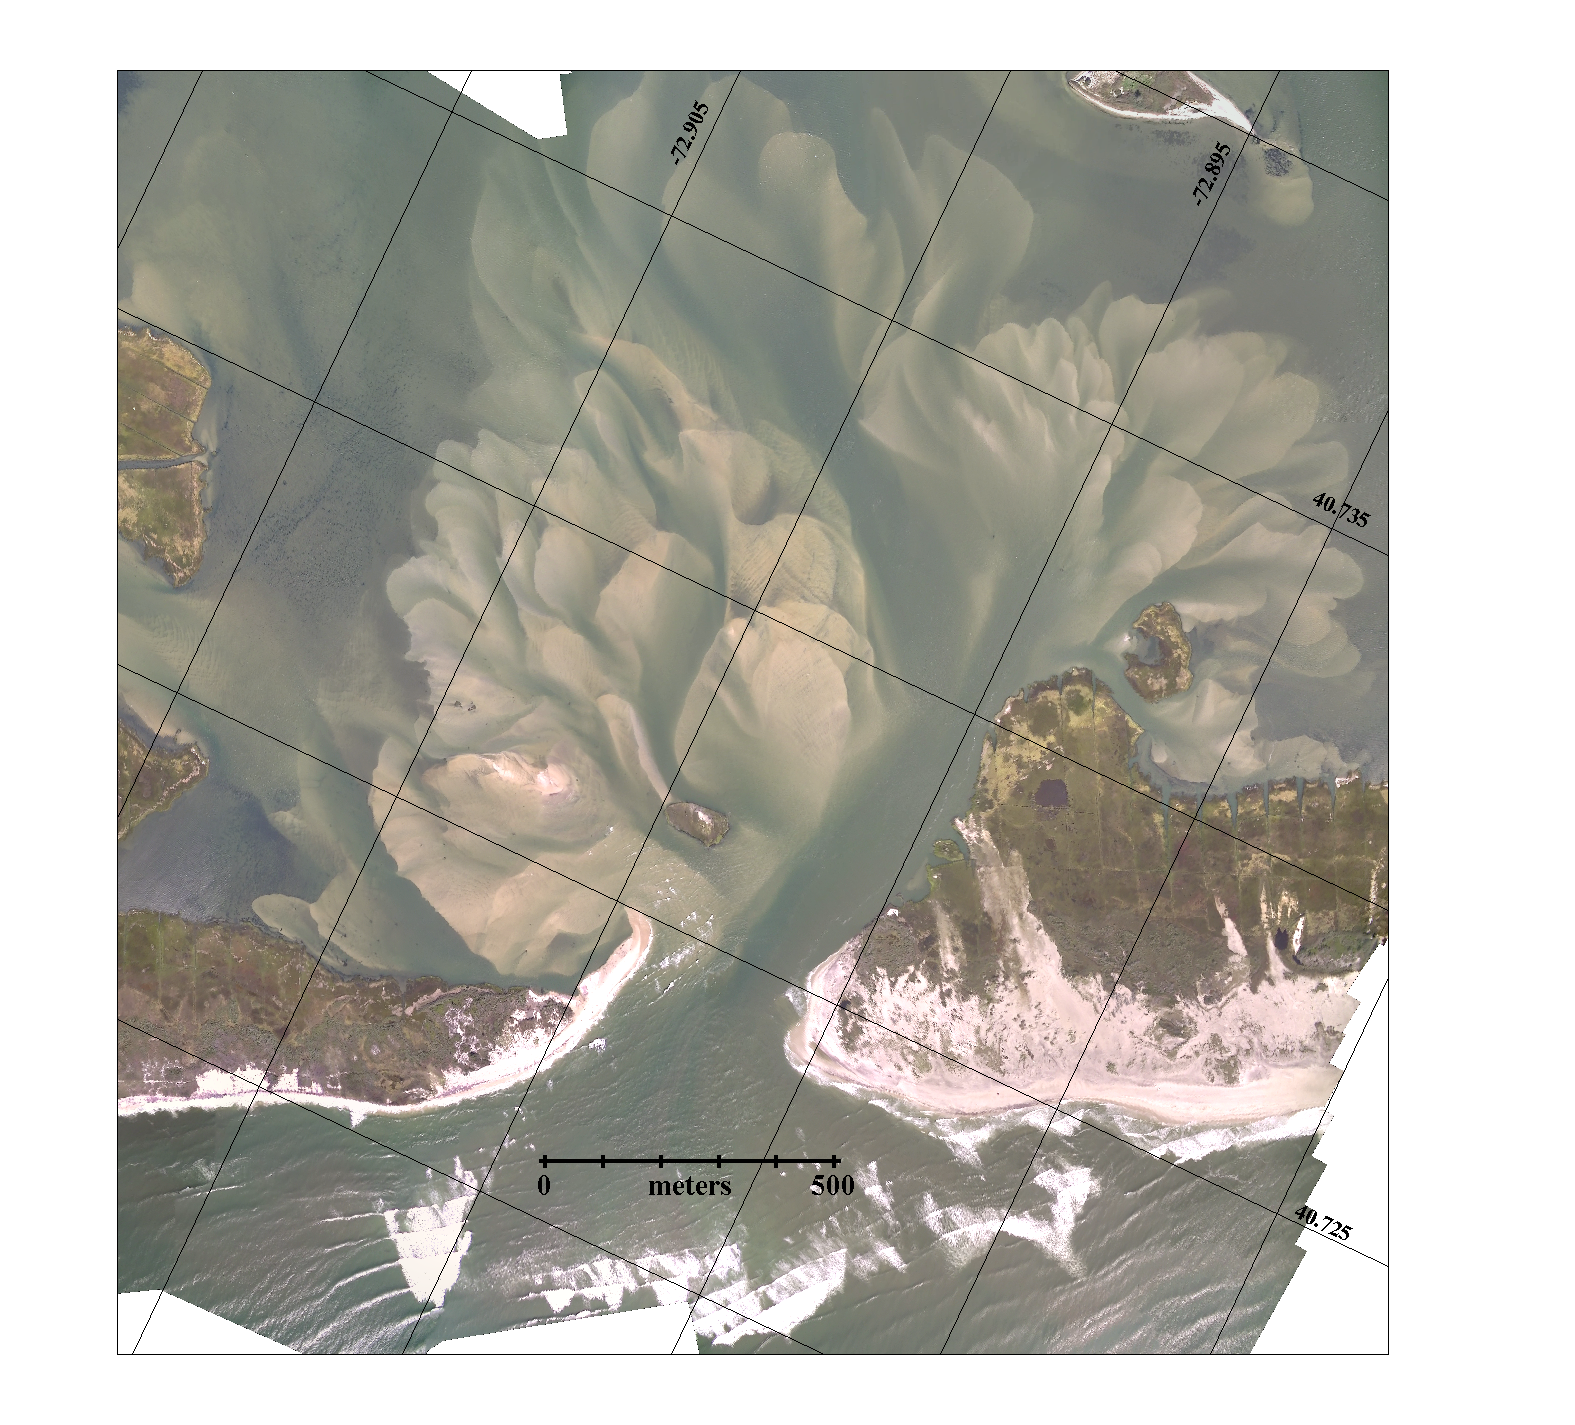
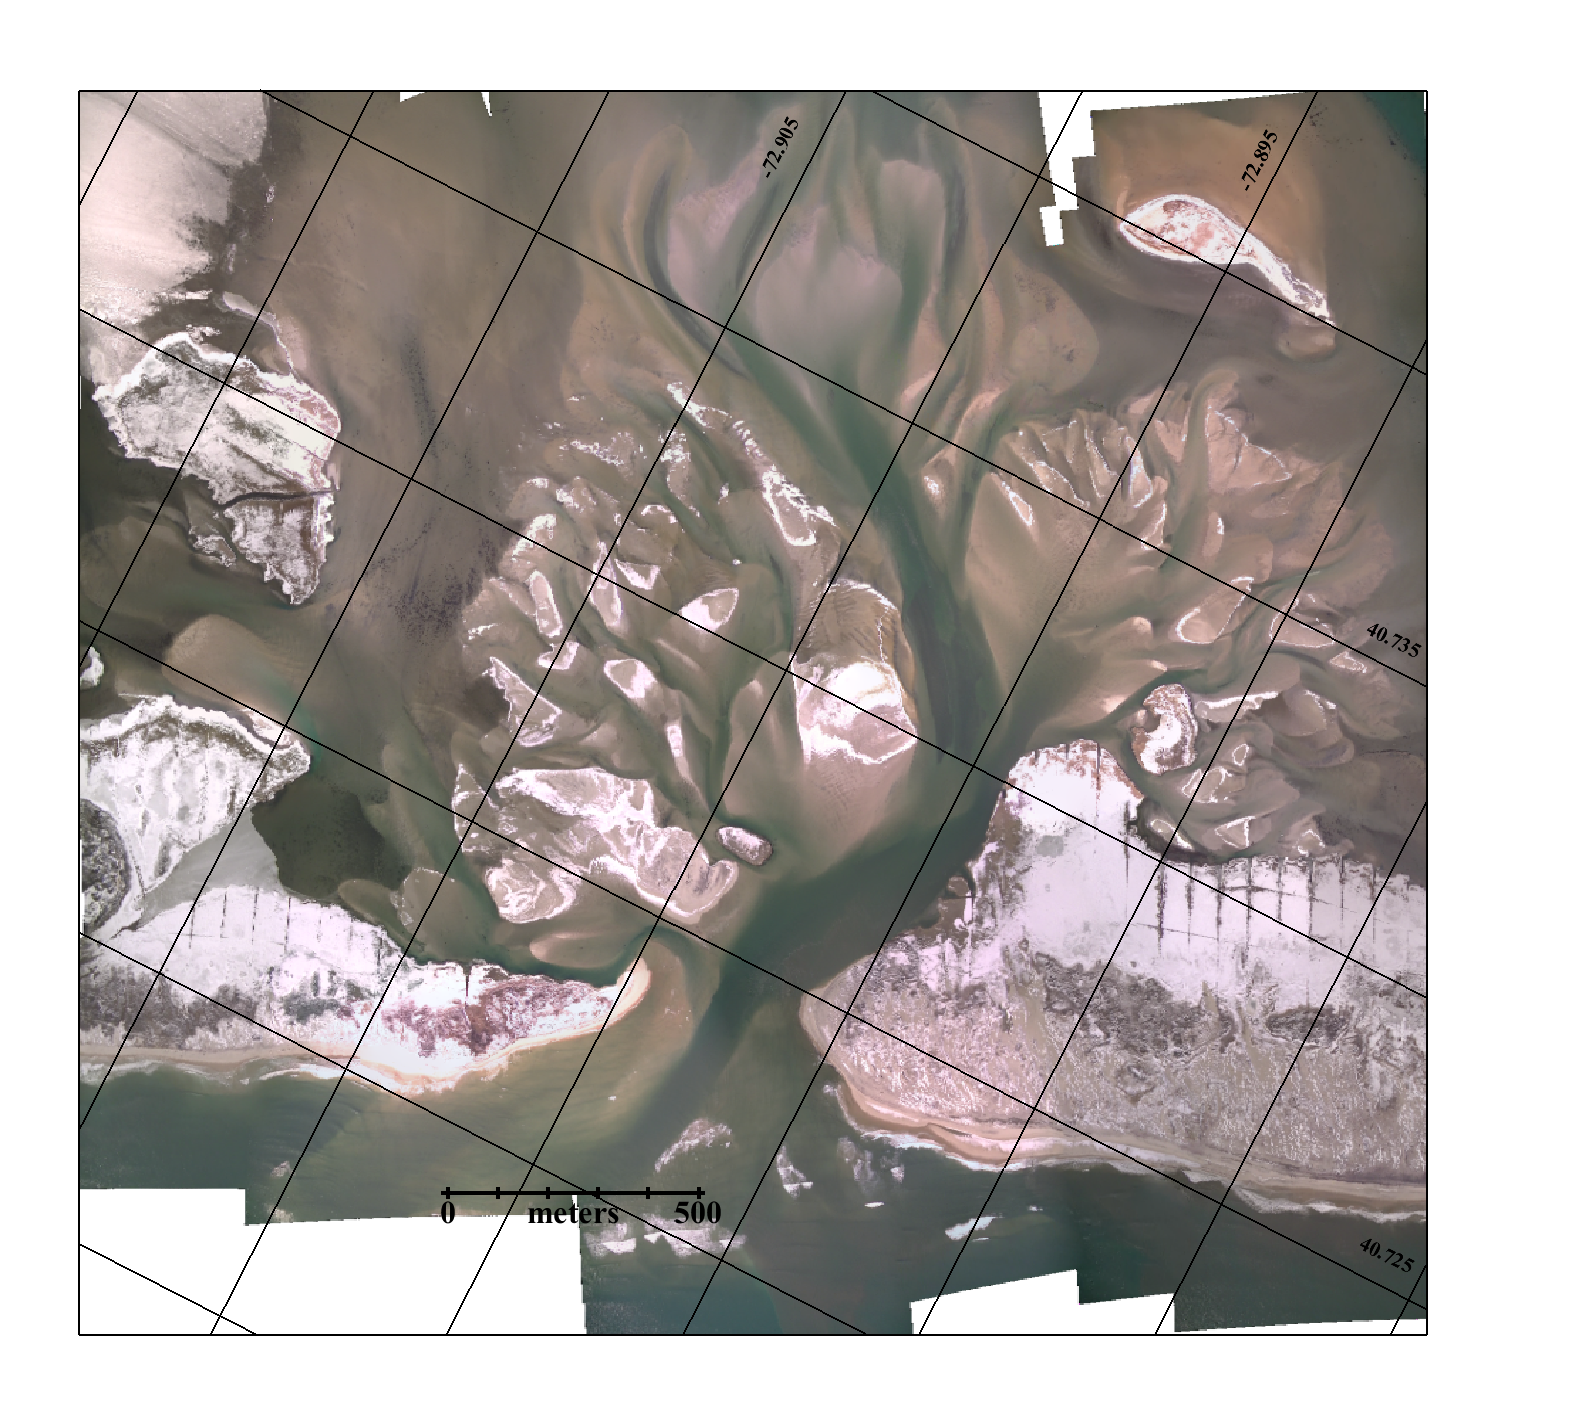
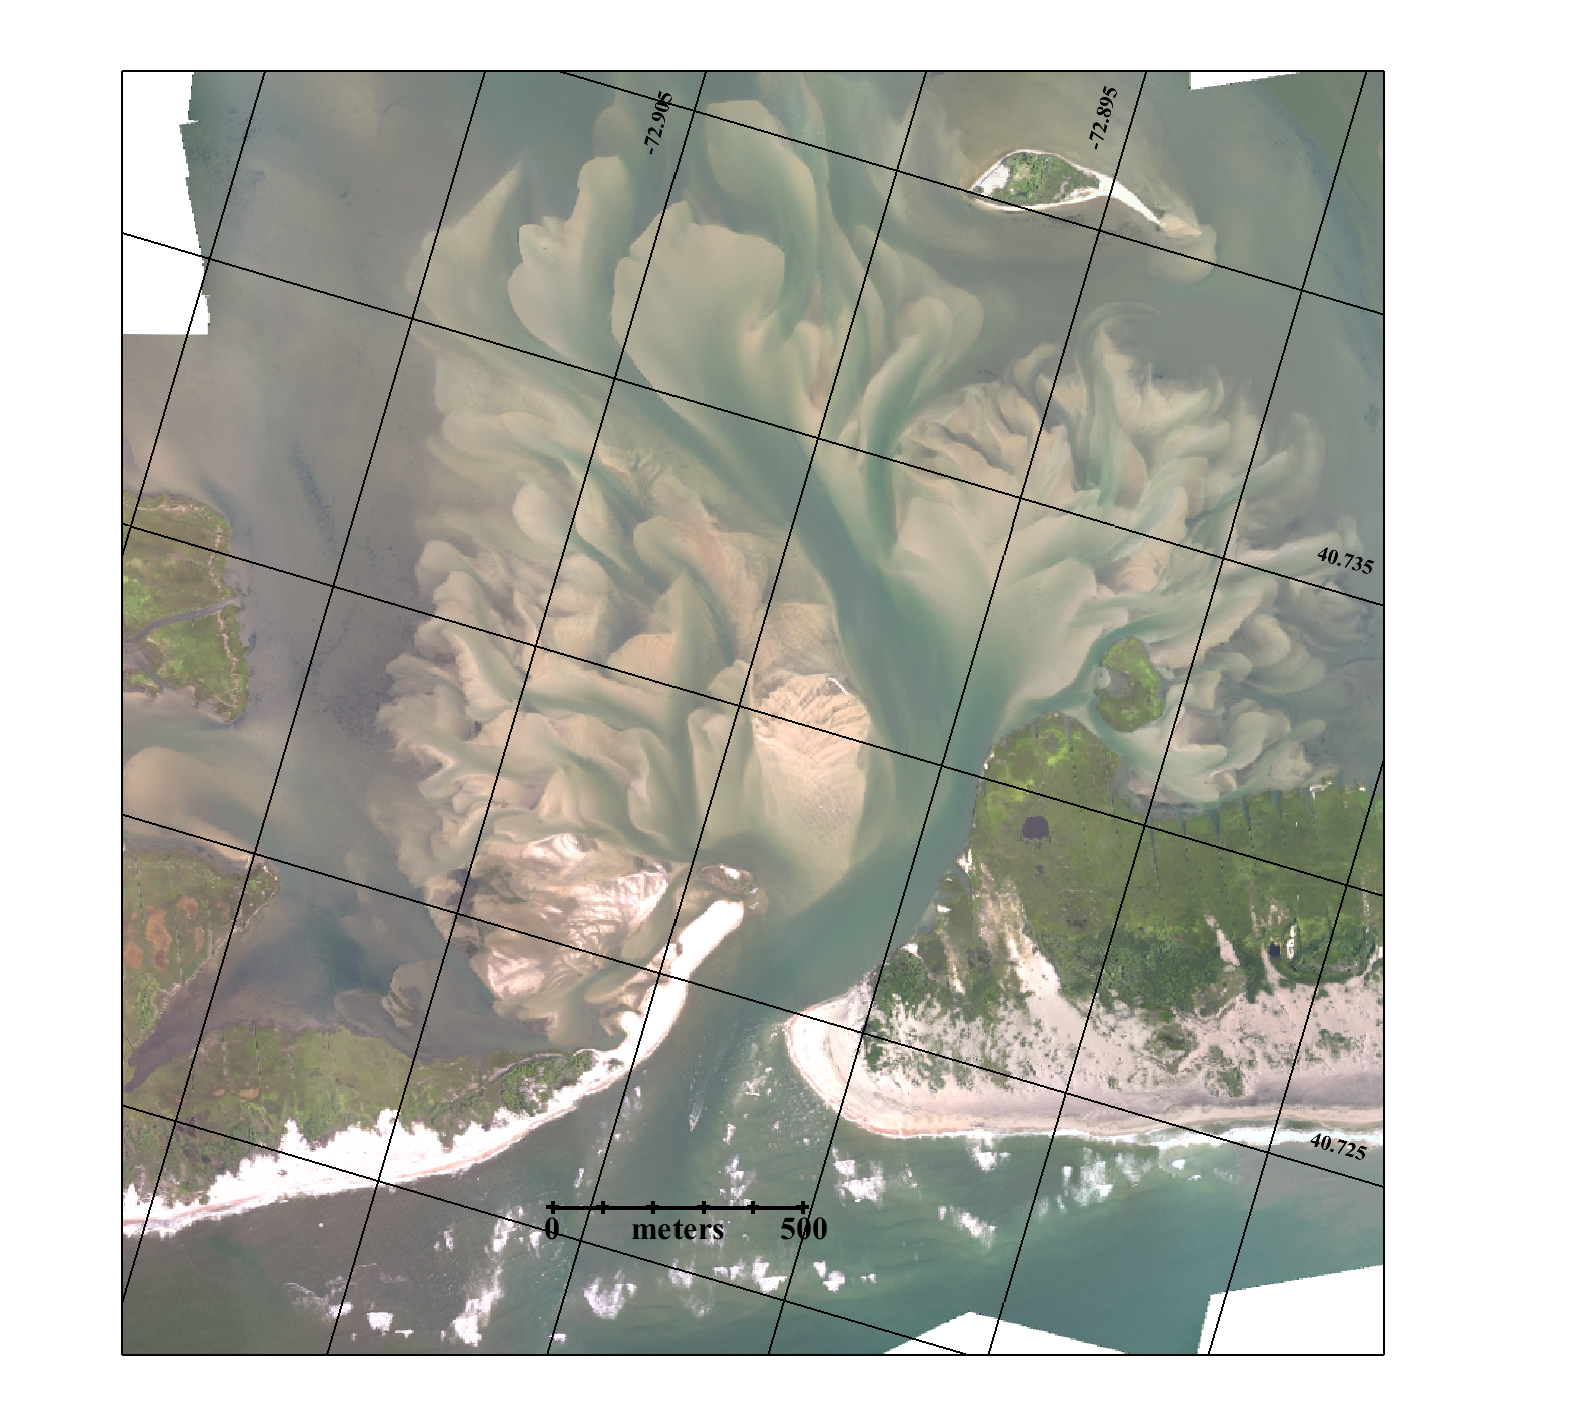
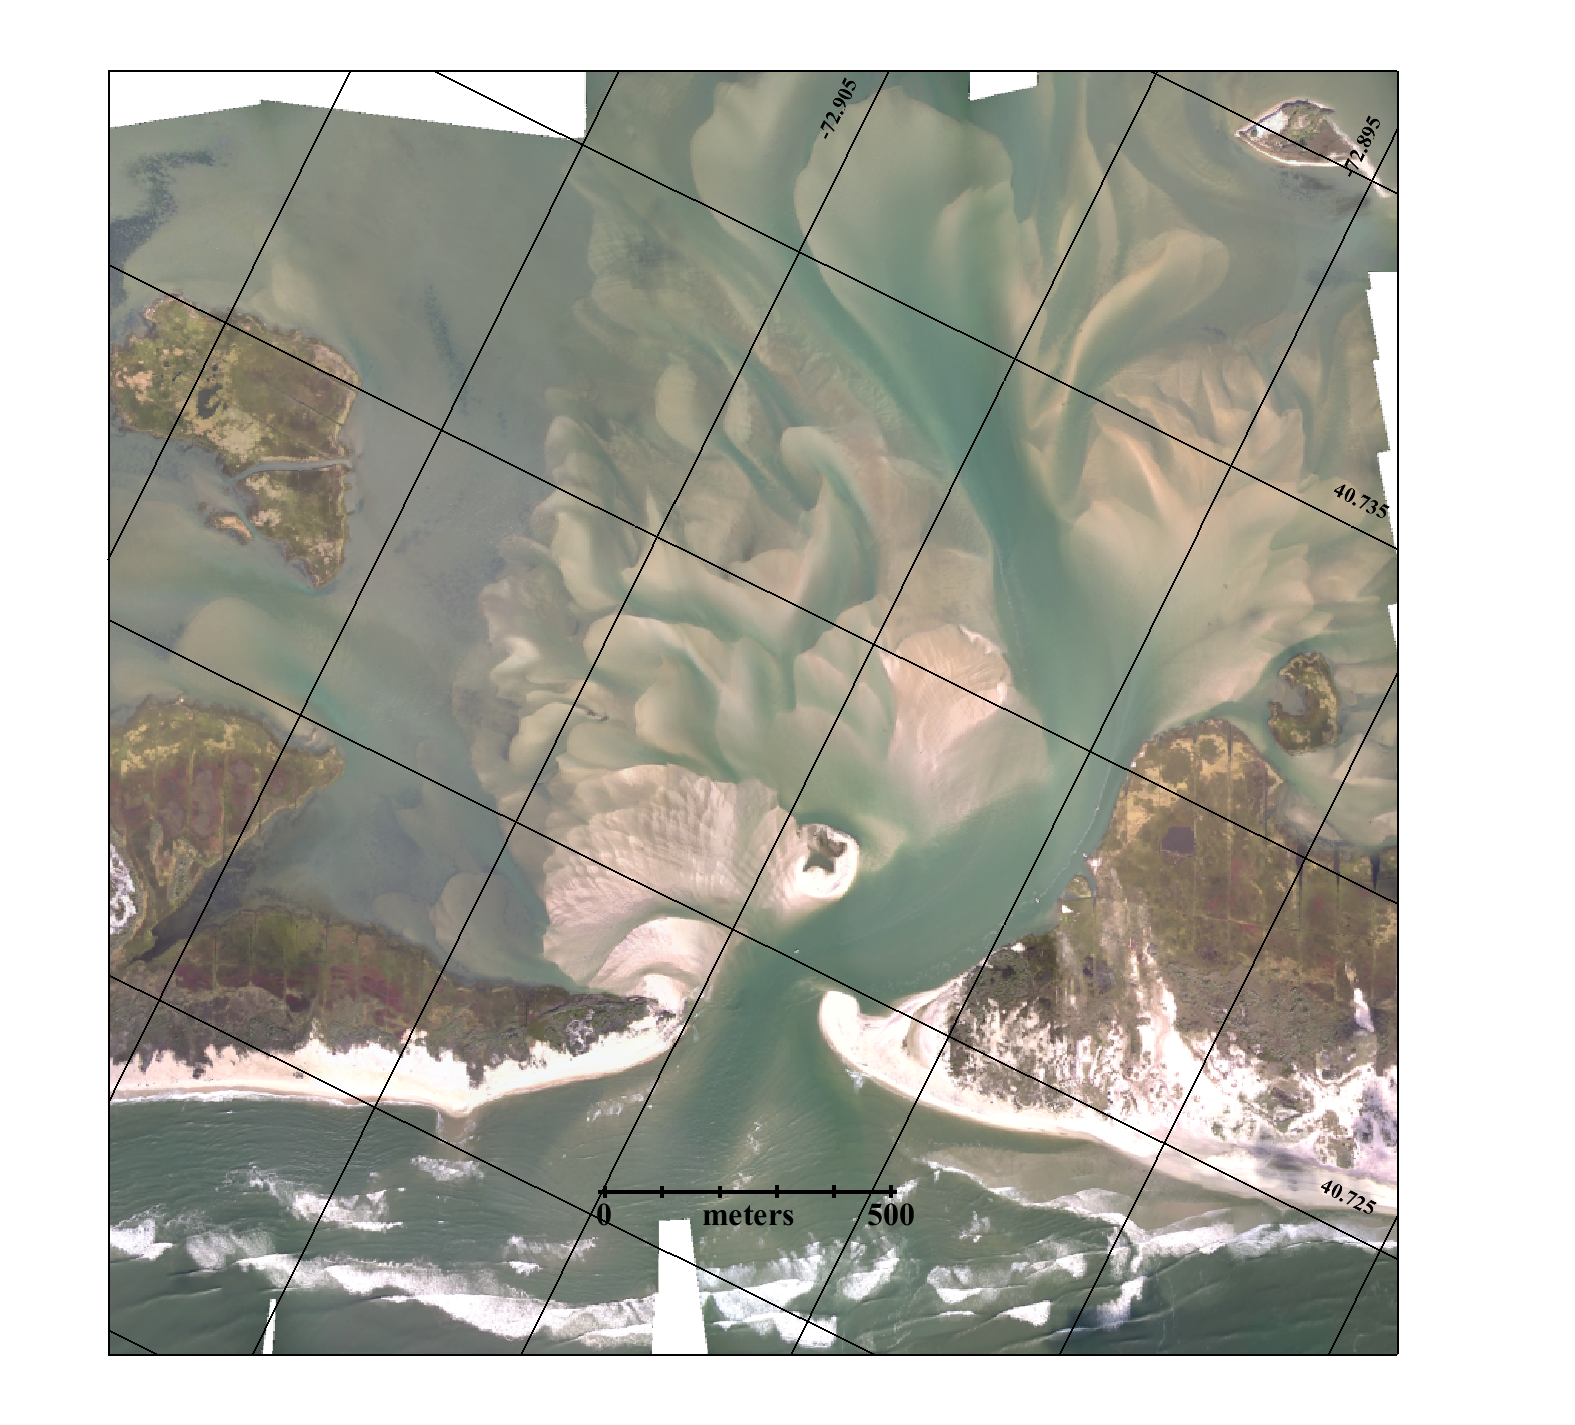
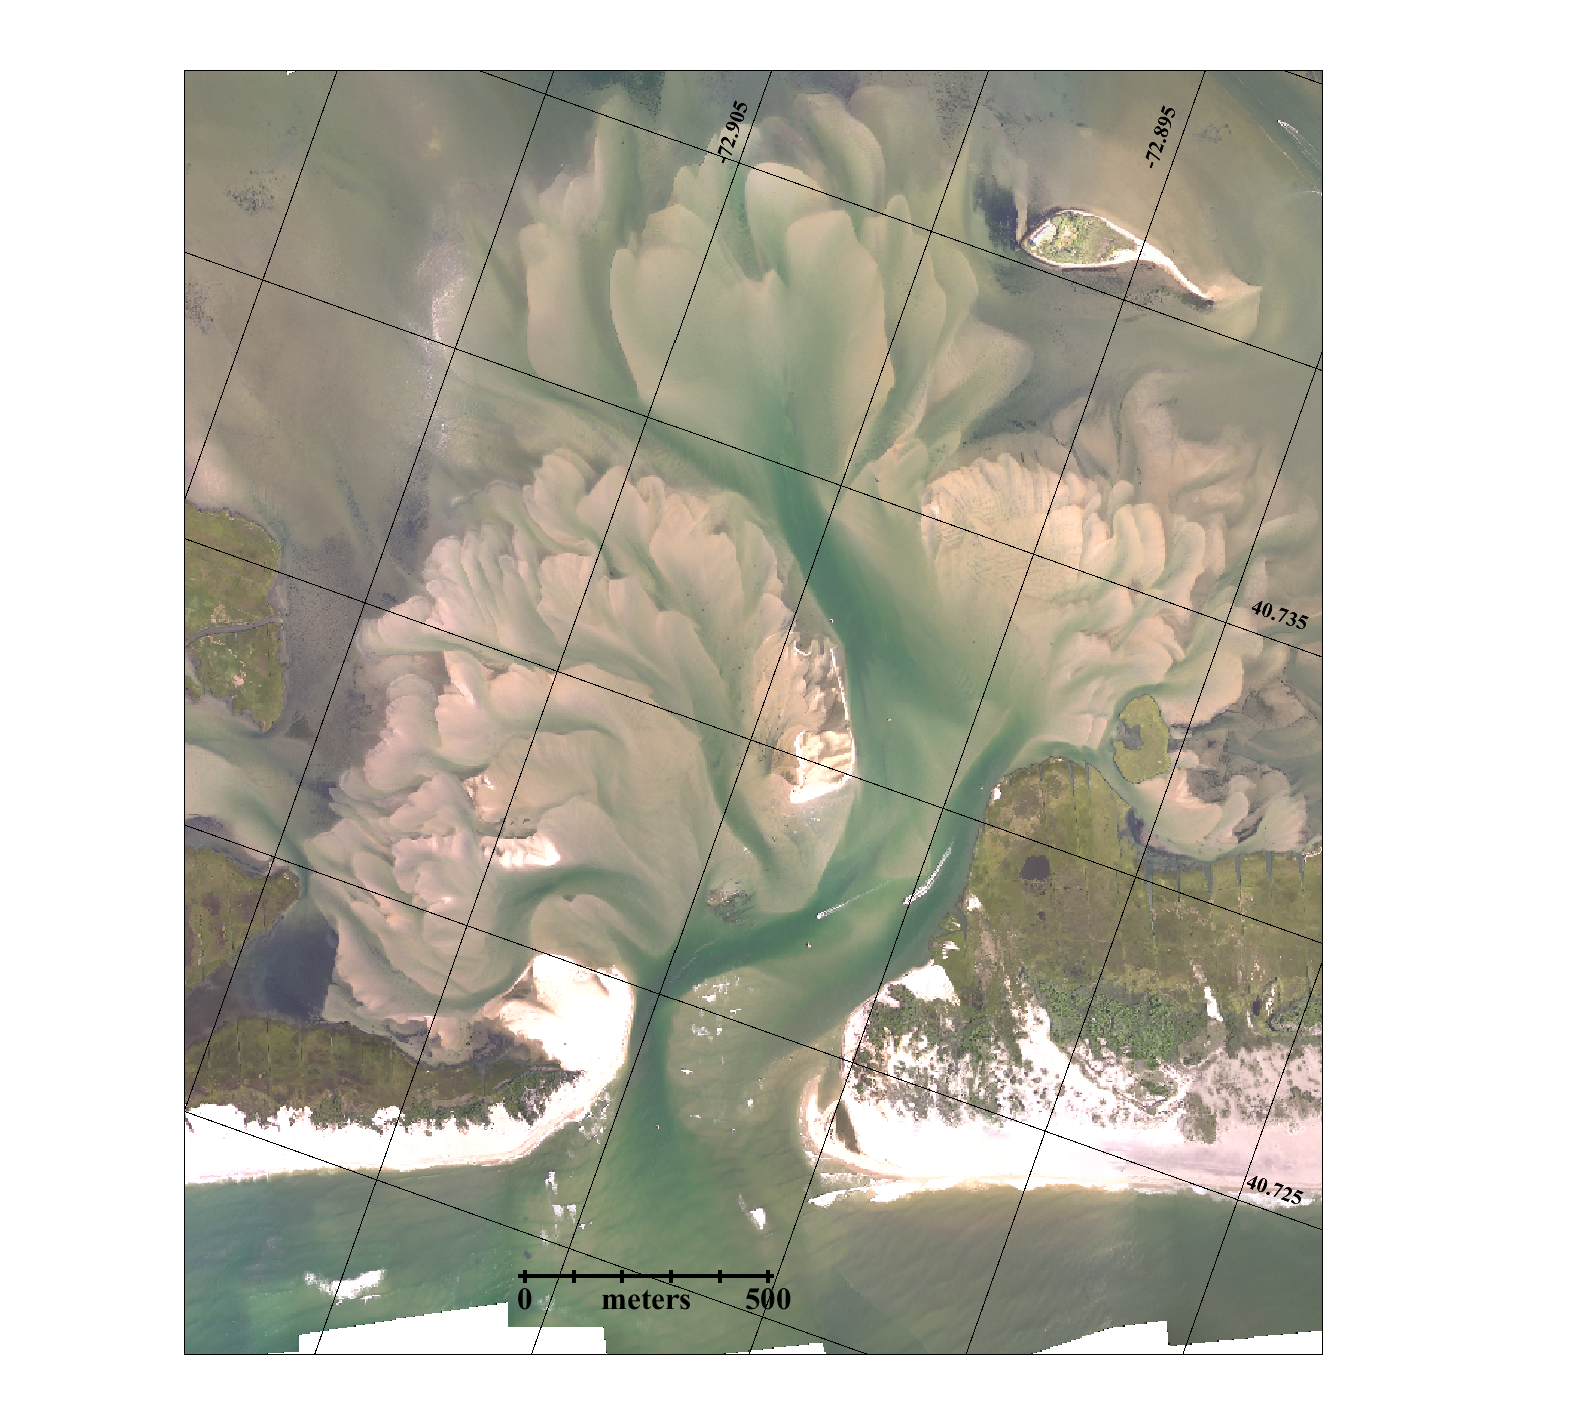
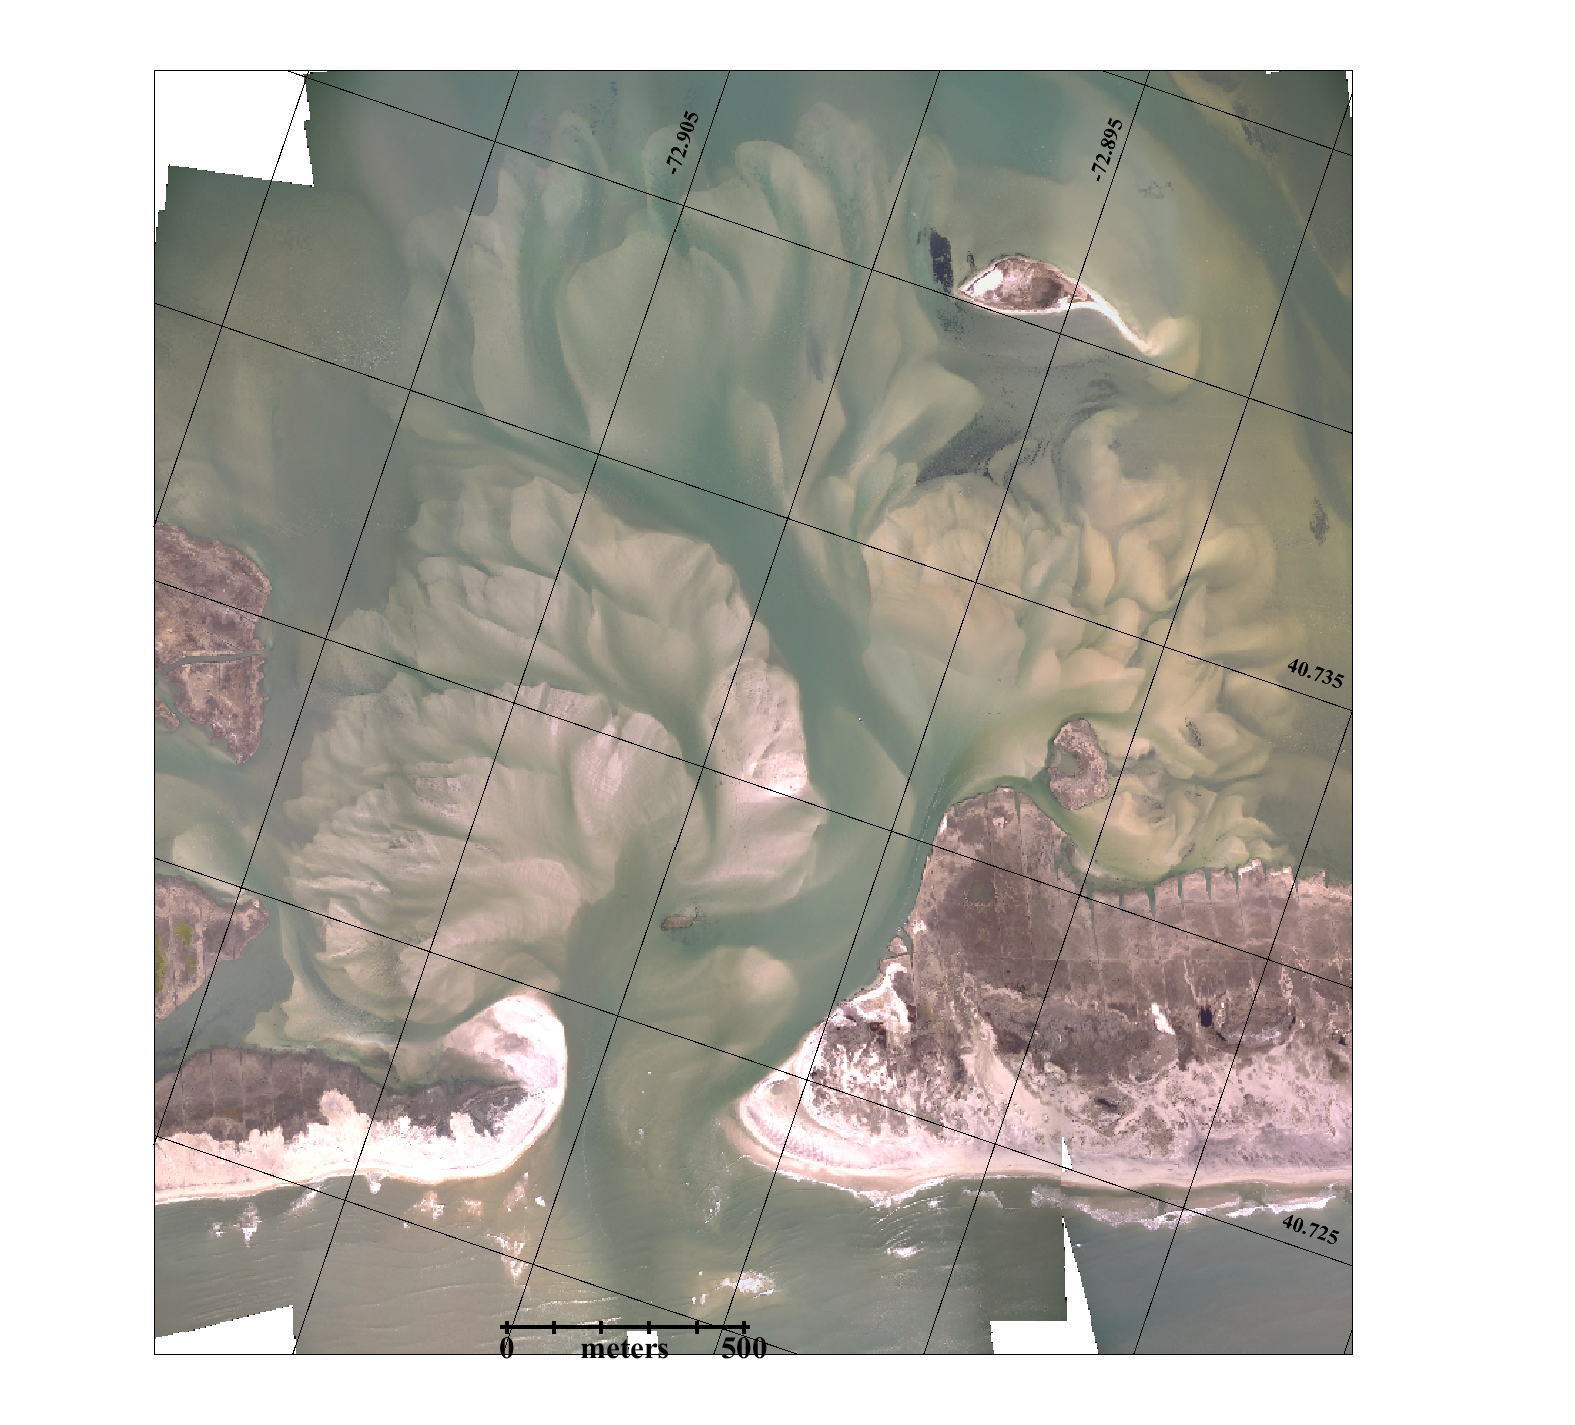
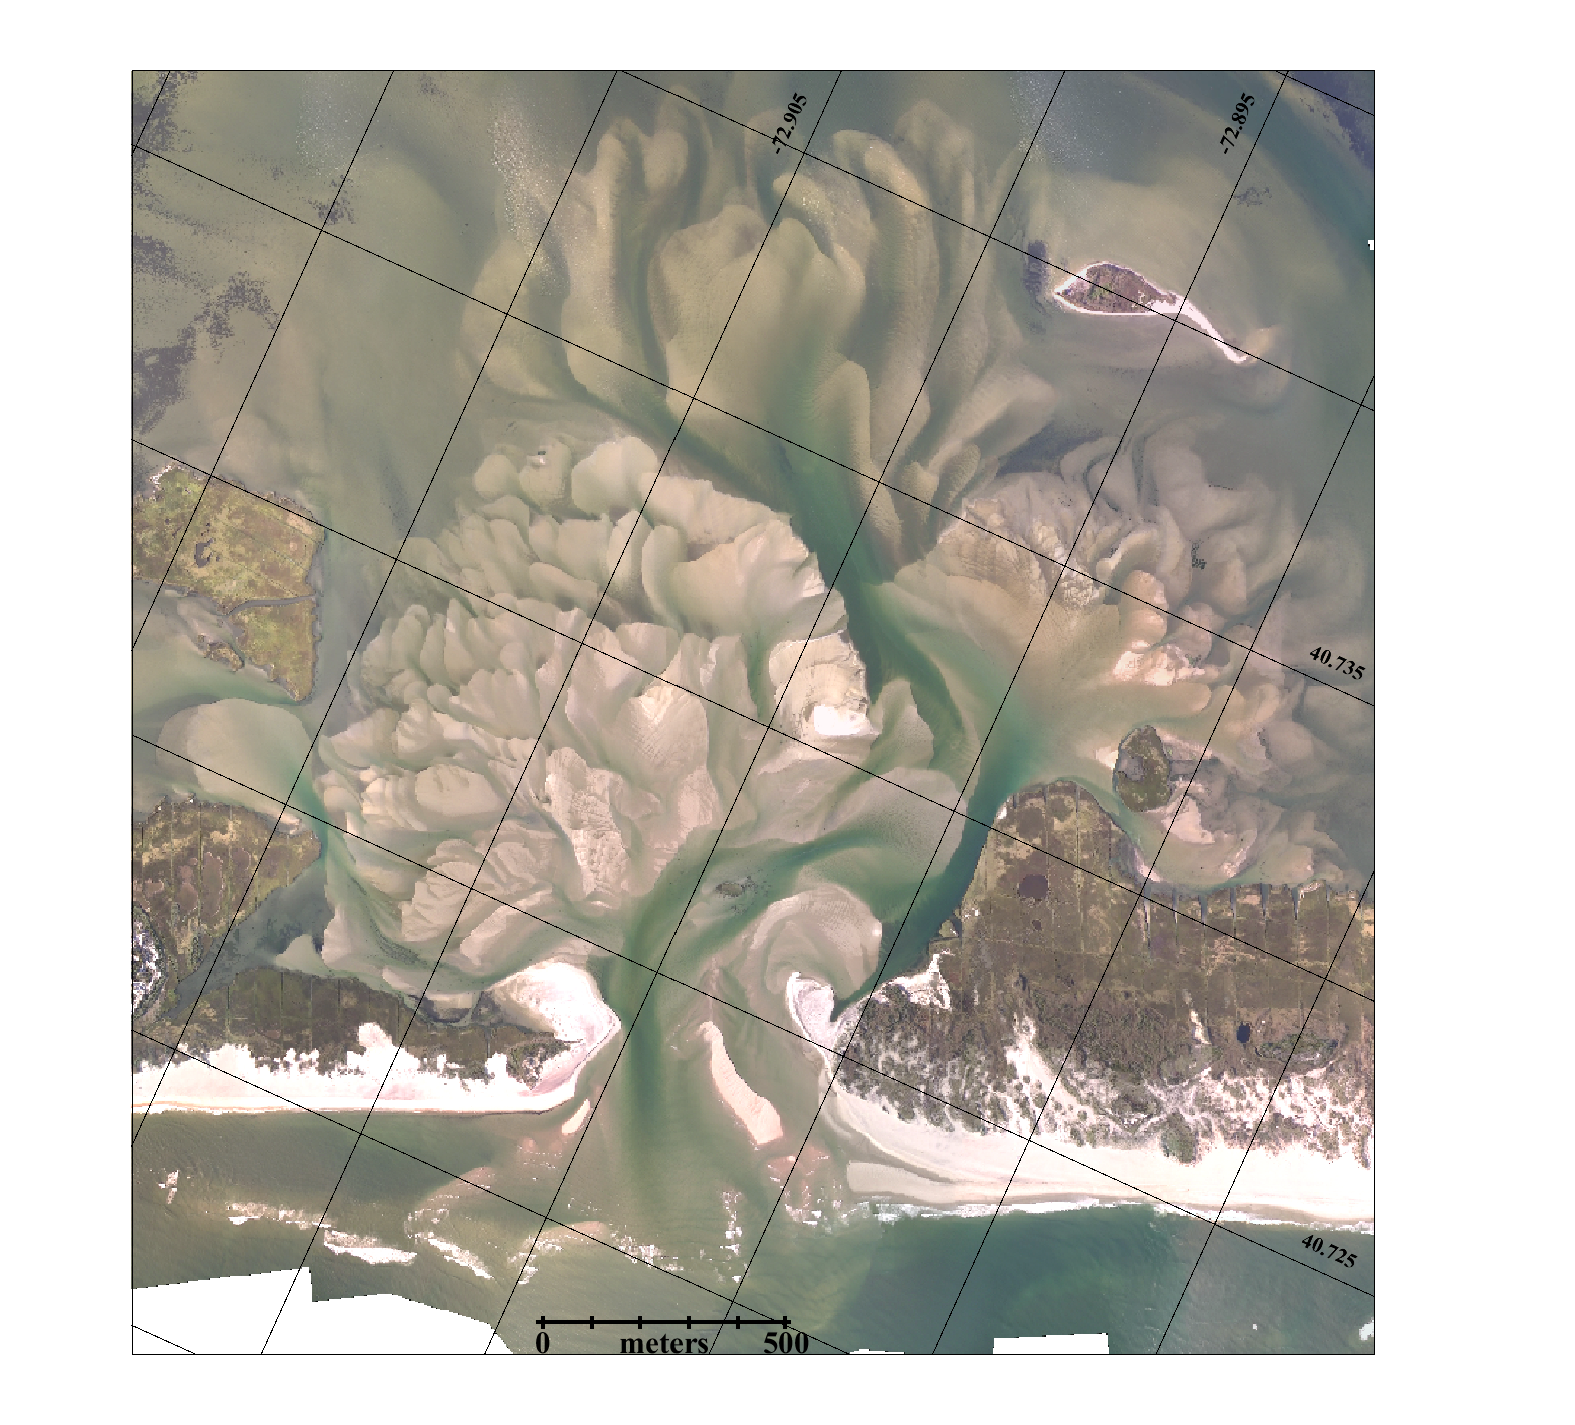
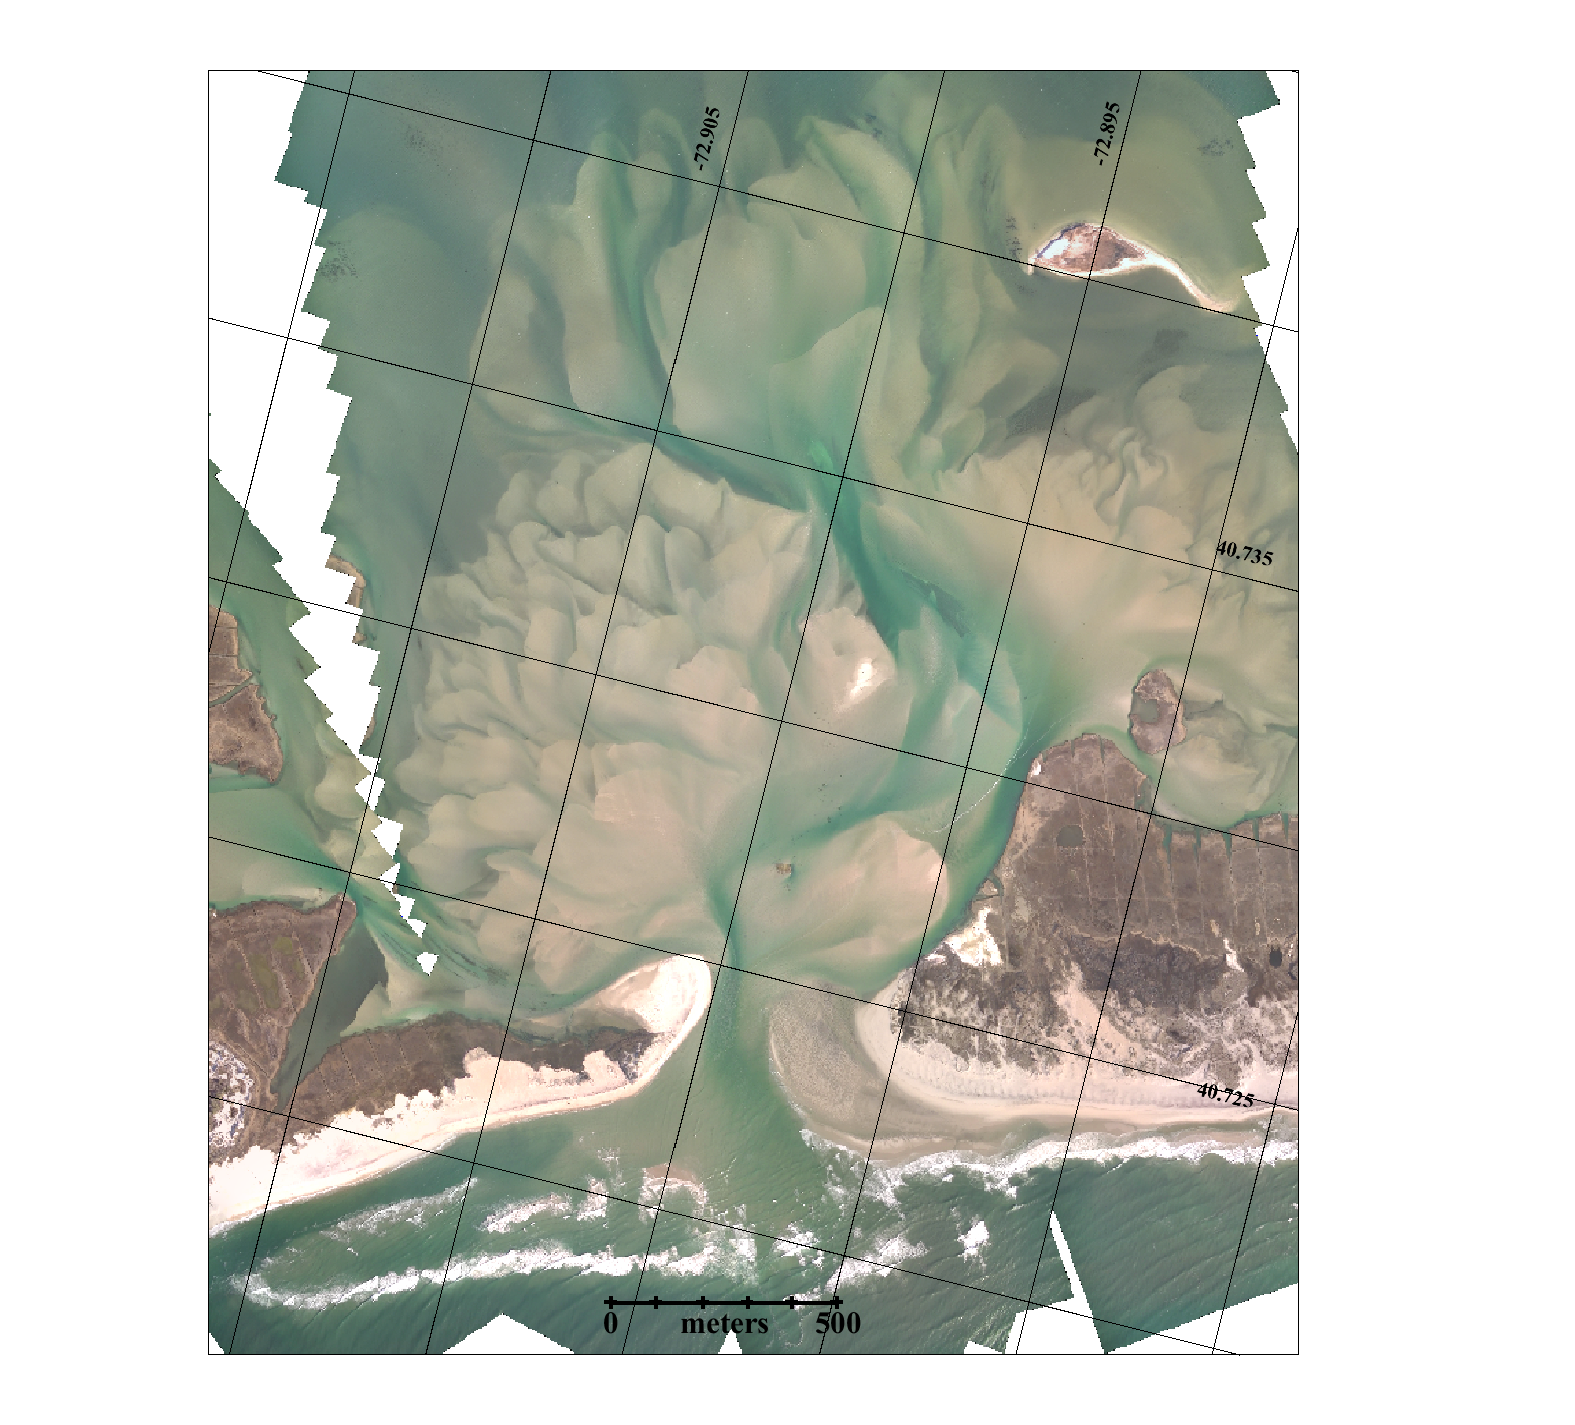
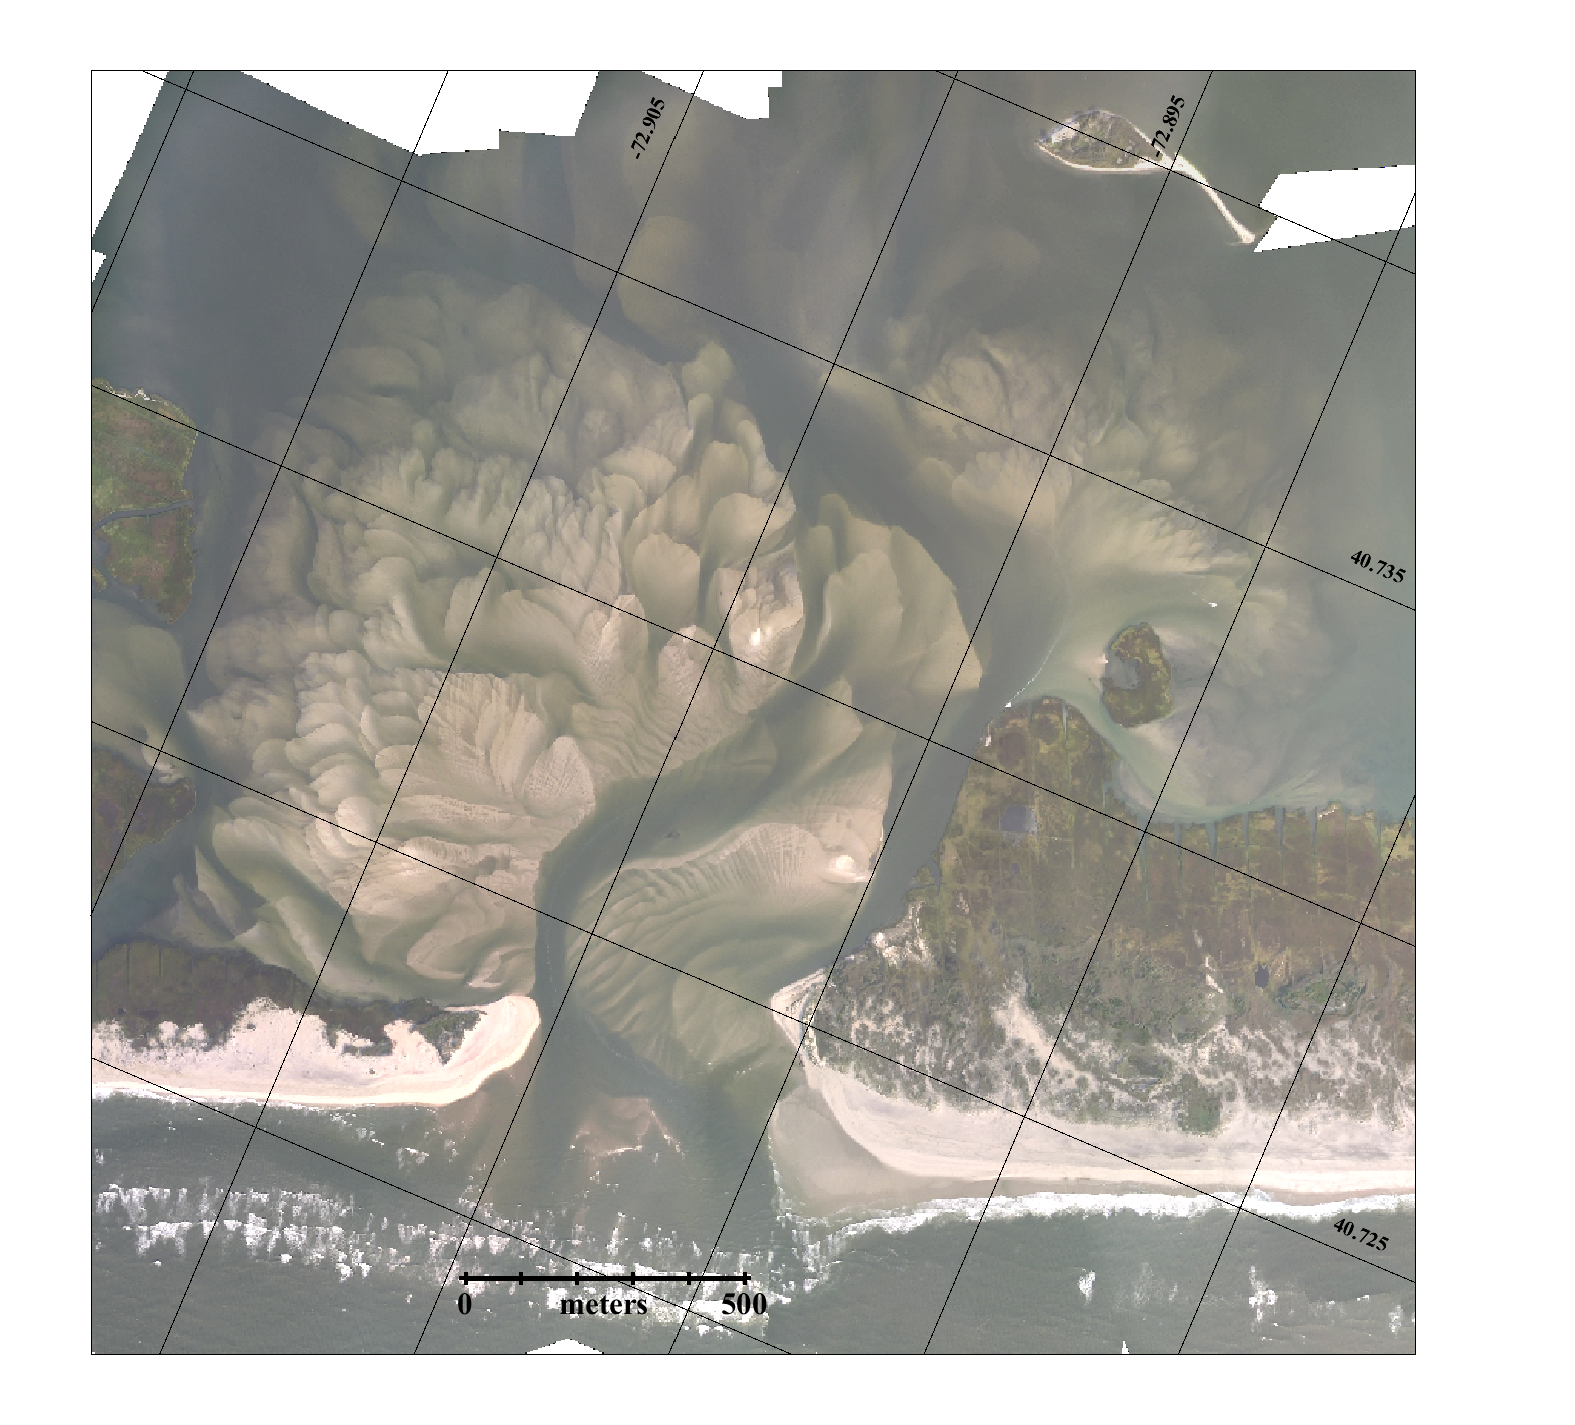
A series of reports on the breach development are listed below.
December 14, 2012 report on the new
inlet through November is available here.
On January 5, 2013 another aerial over flight took place and a
photo summary of the evolving breach at Old Inlet to the
present is available here.
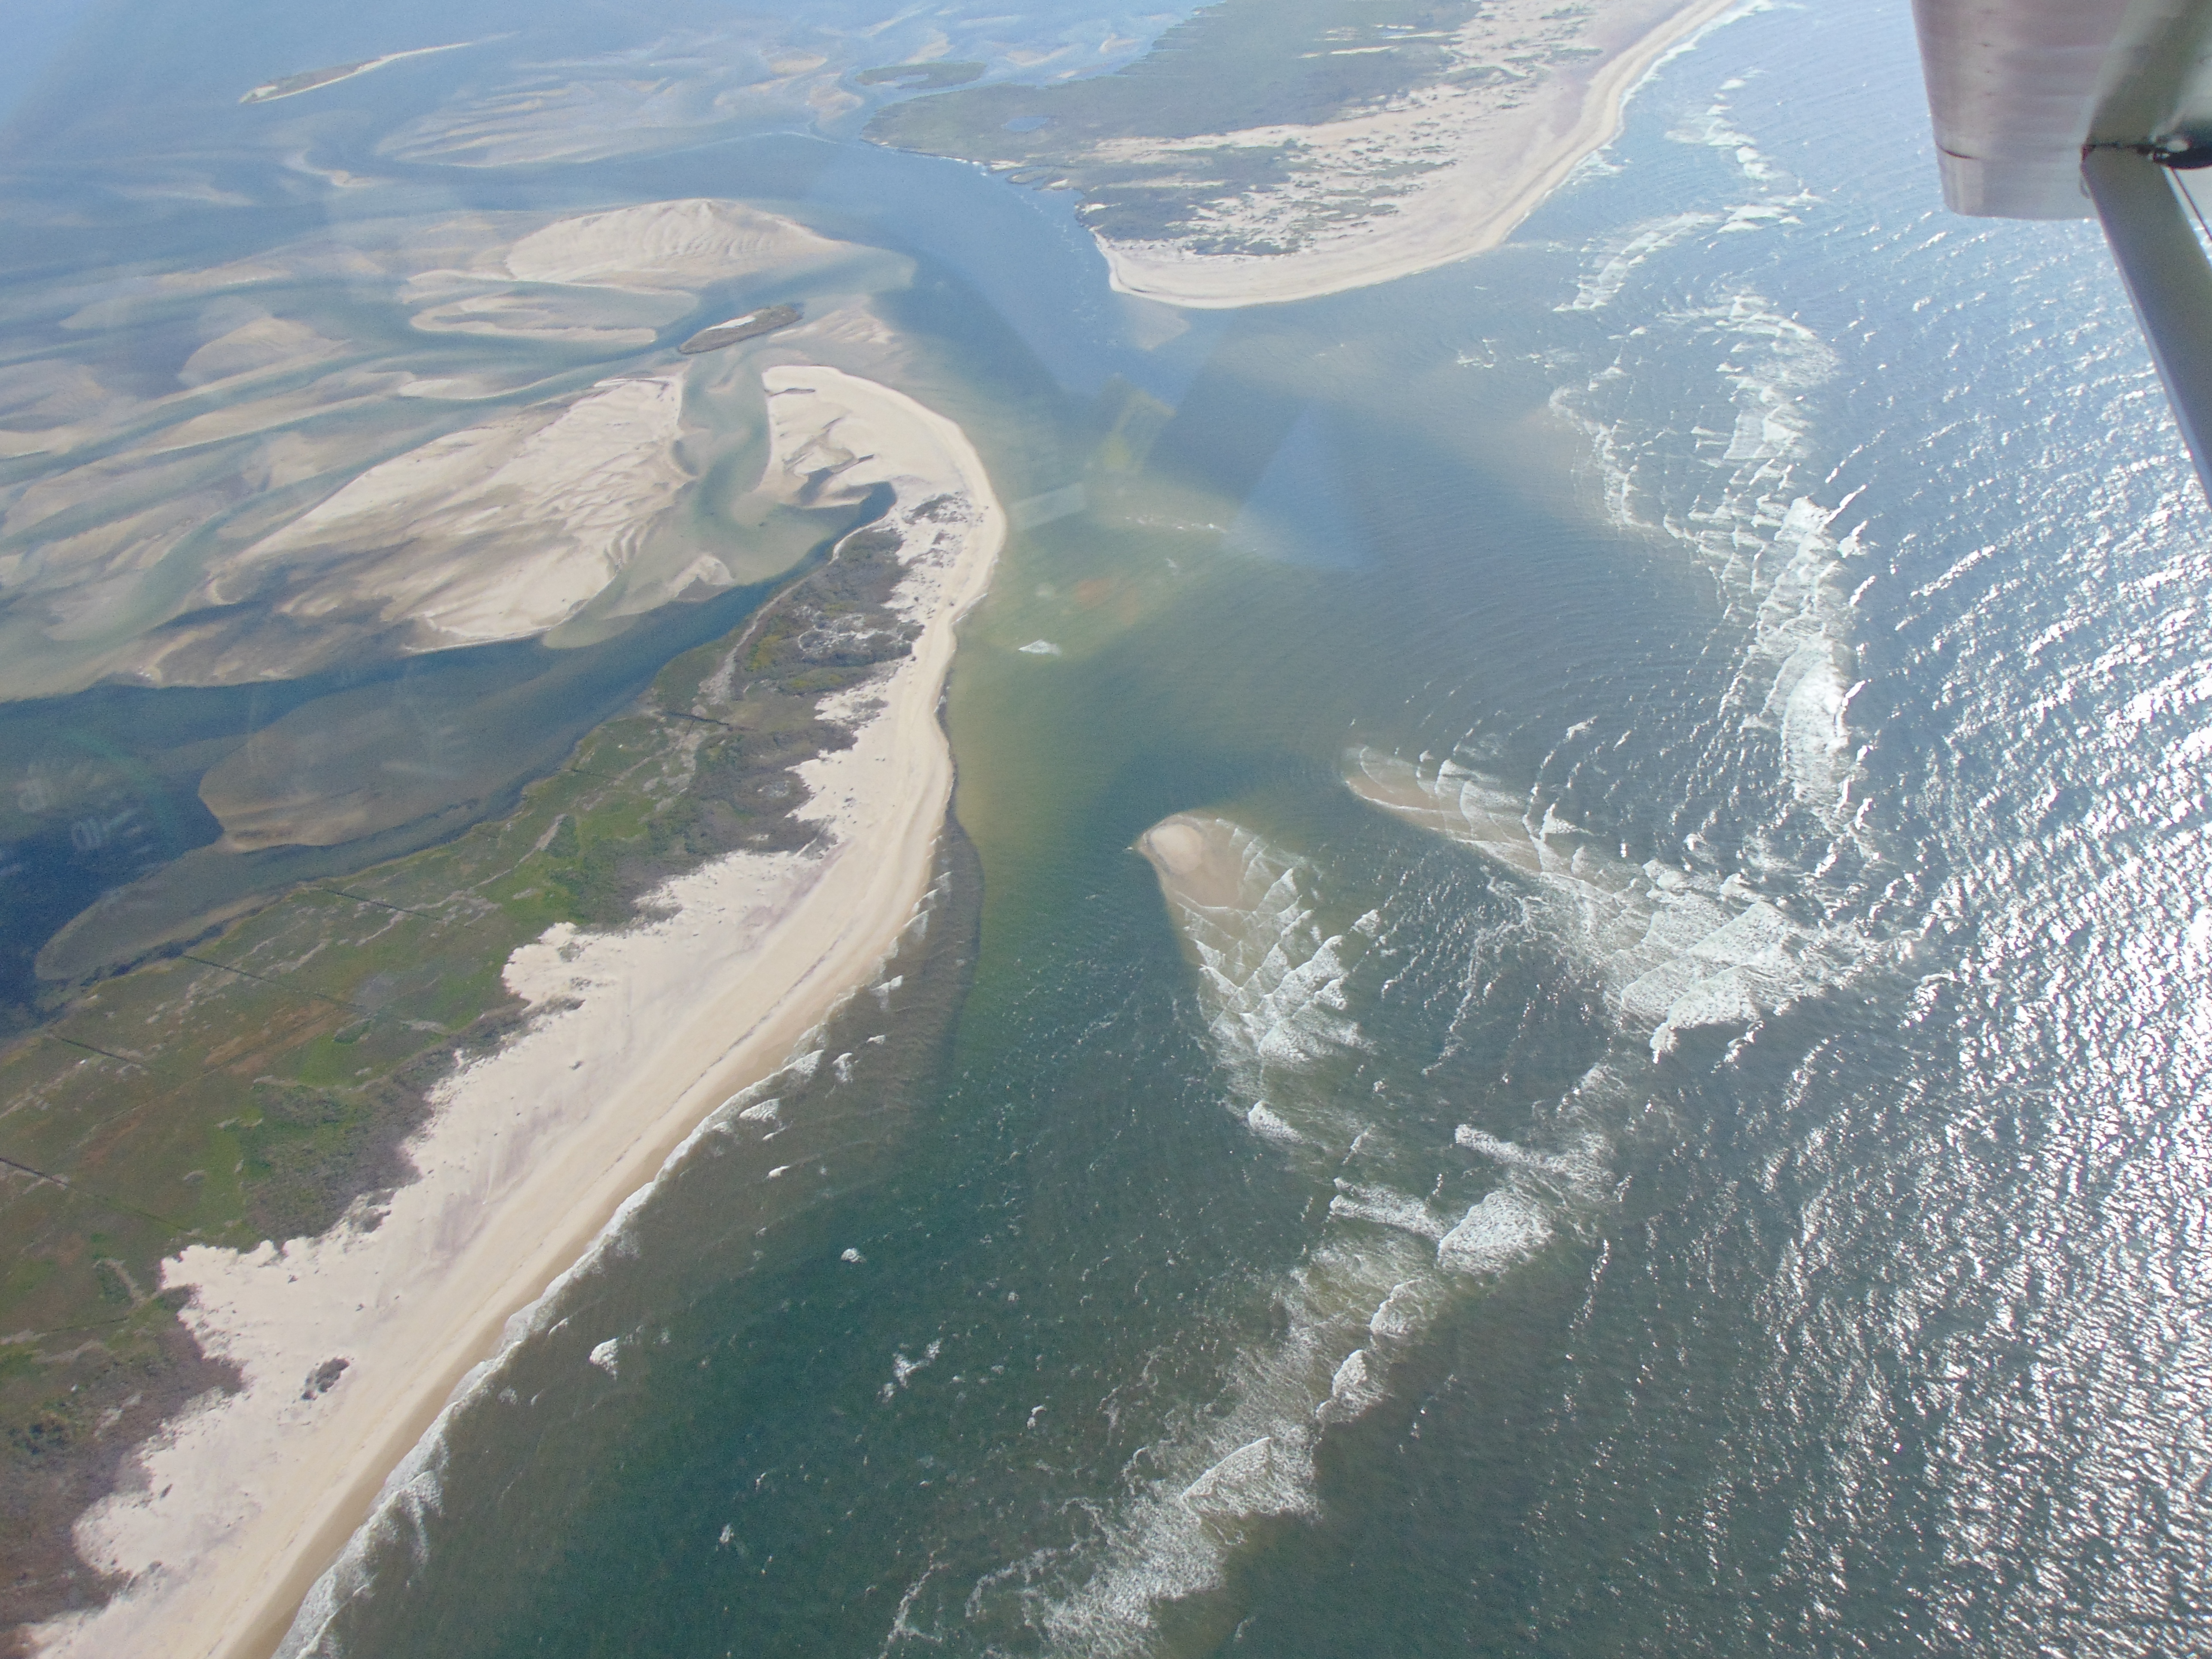
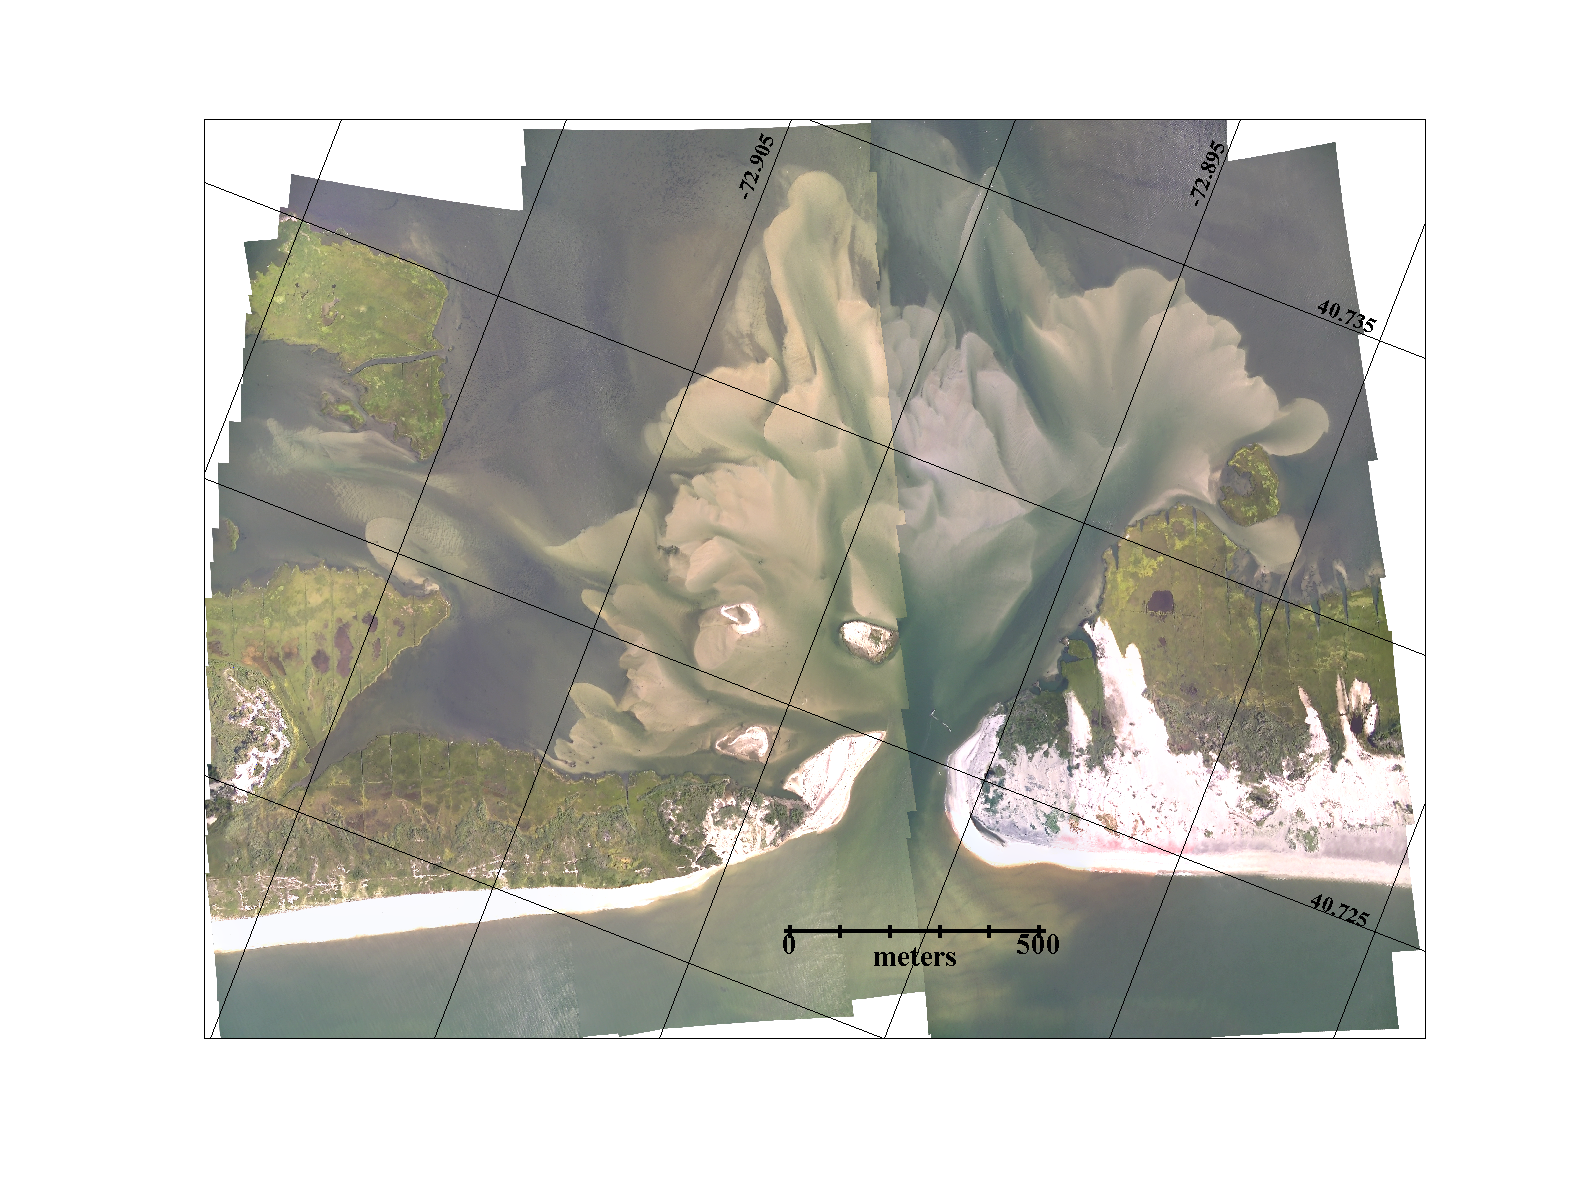
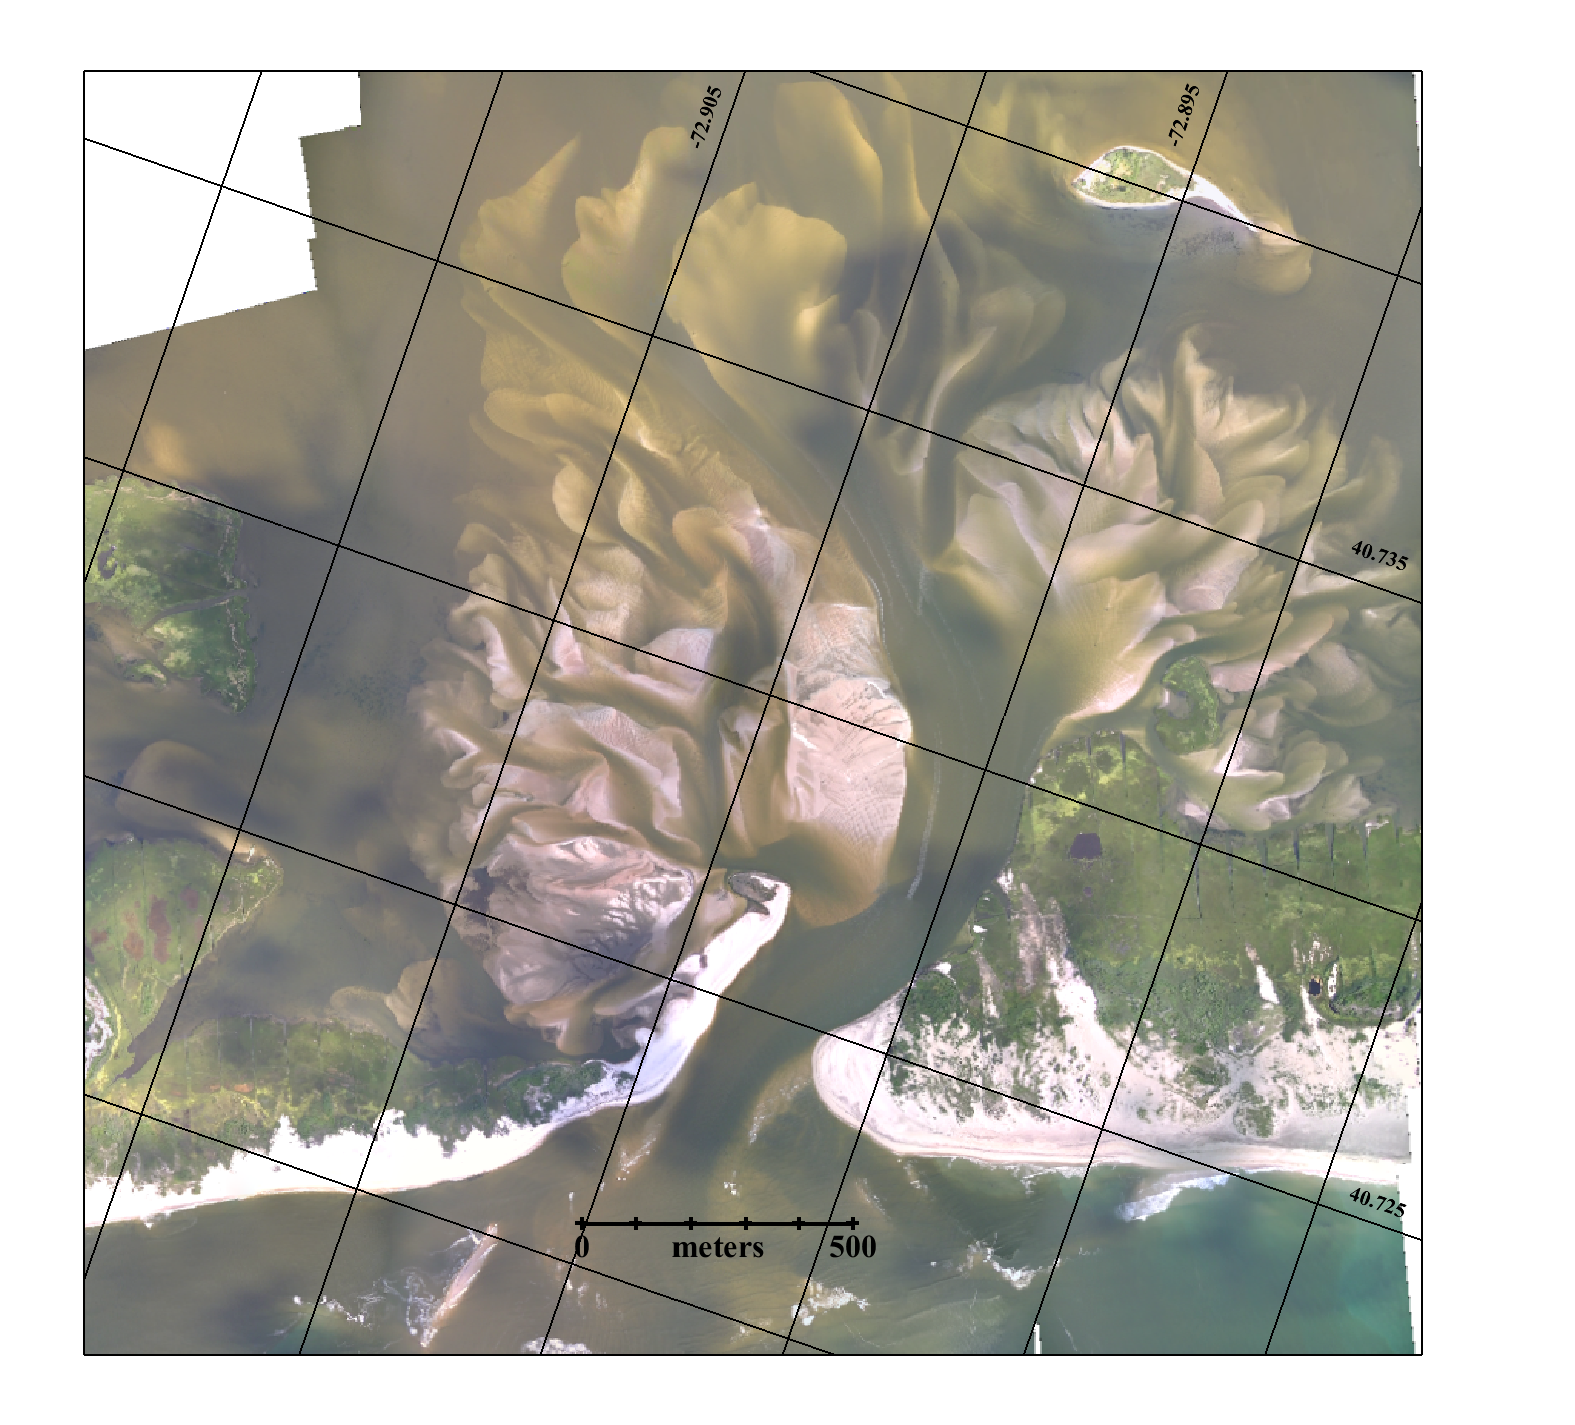
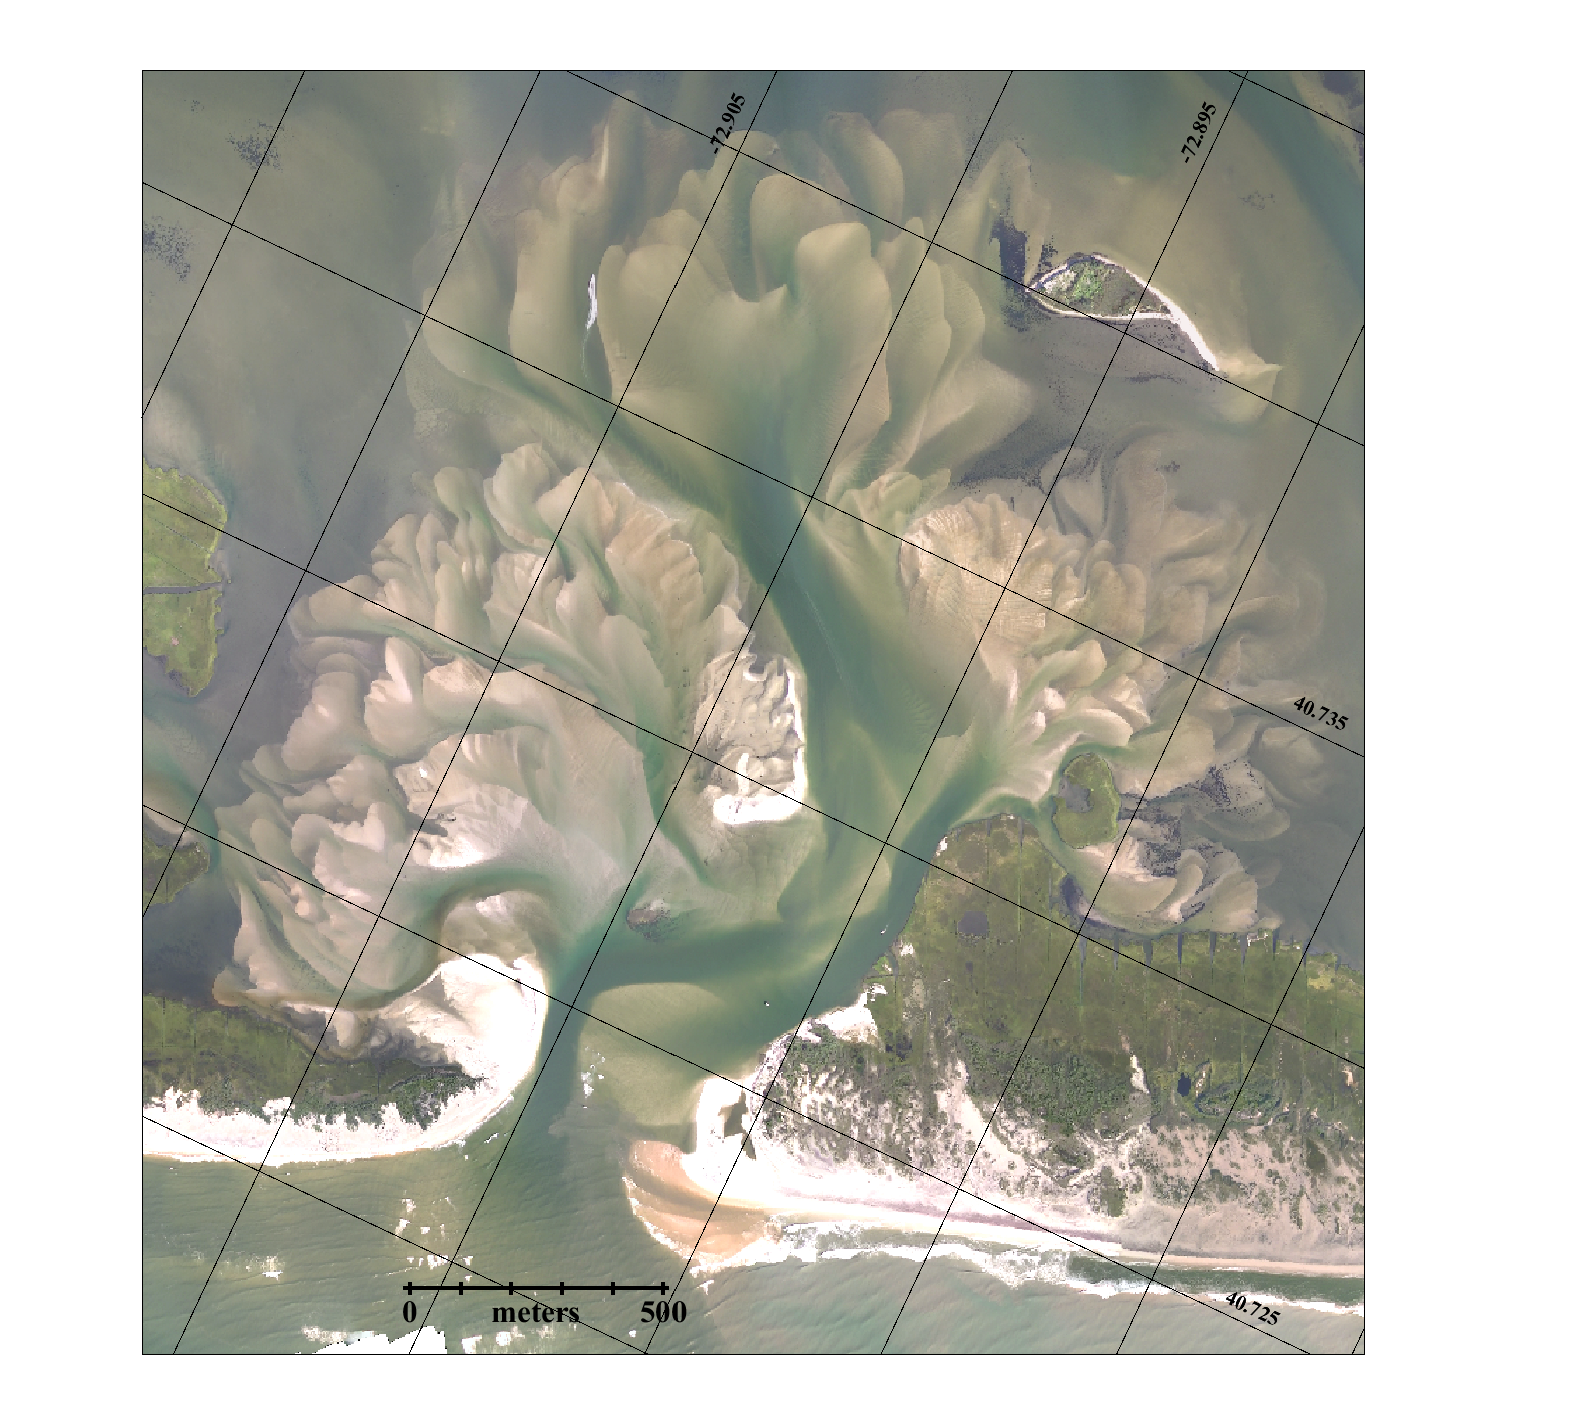
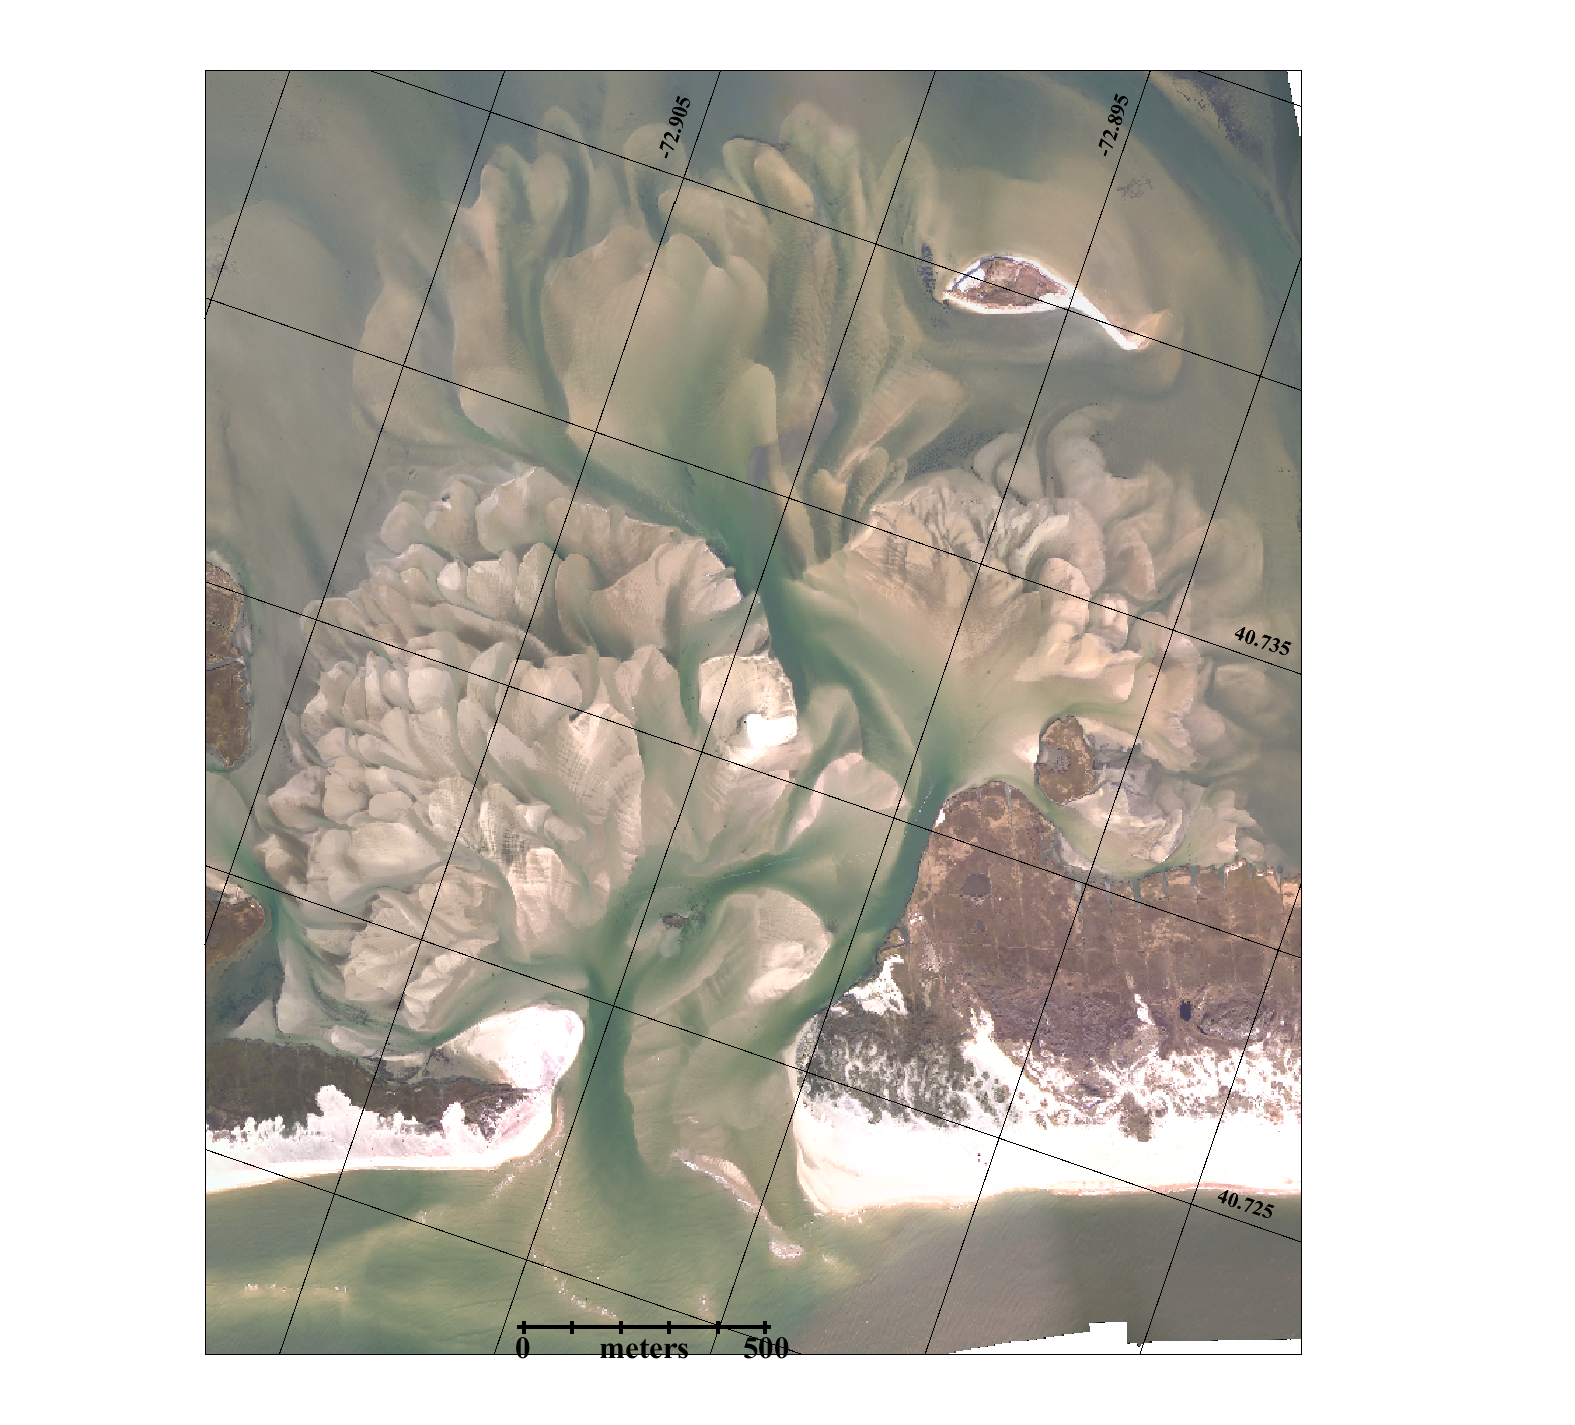
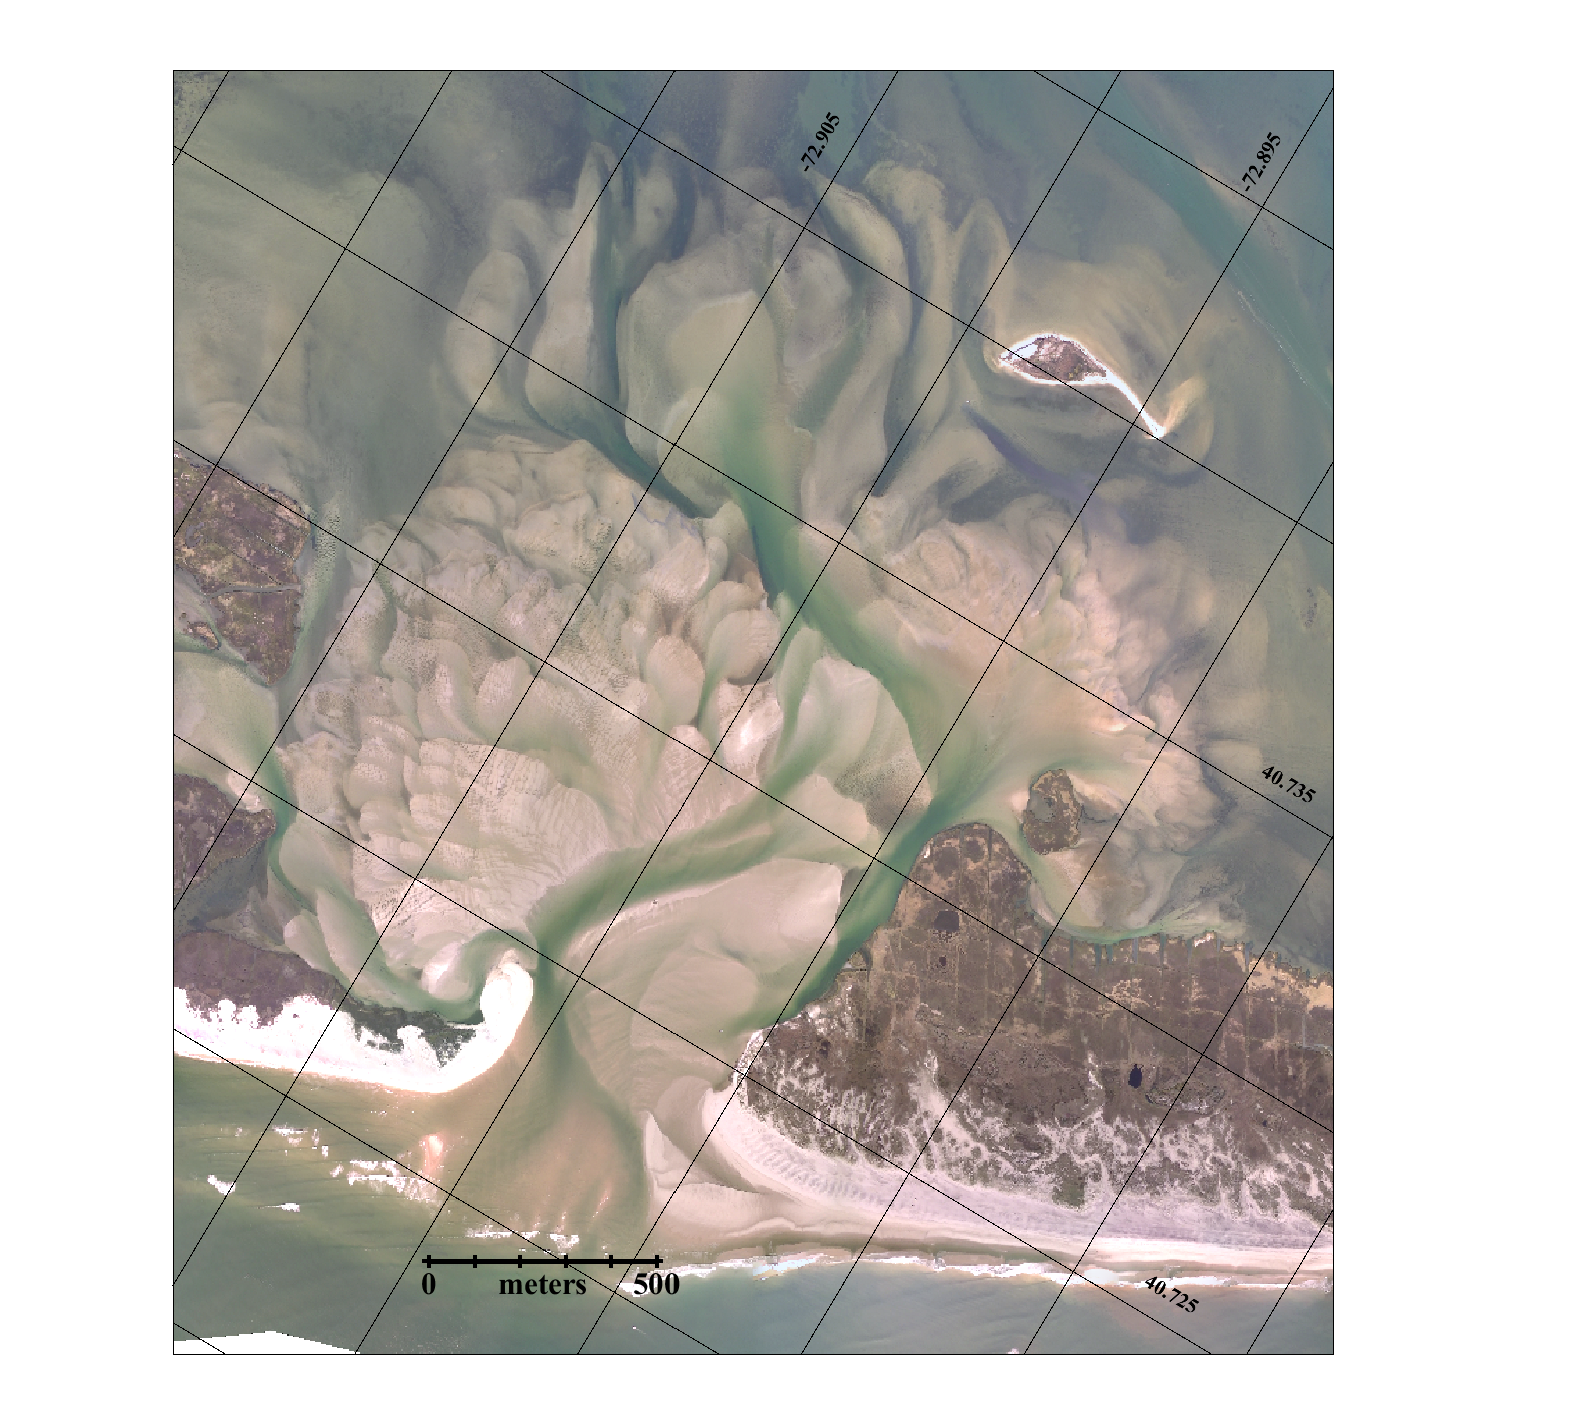
January 14, 2013 report on the inlet that goes through
December is available here.
The January 30th report on
the status of the inlet is available here.
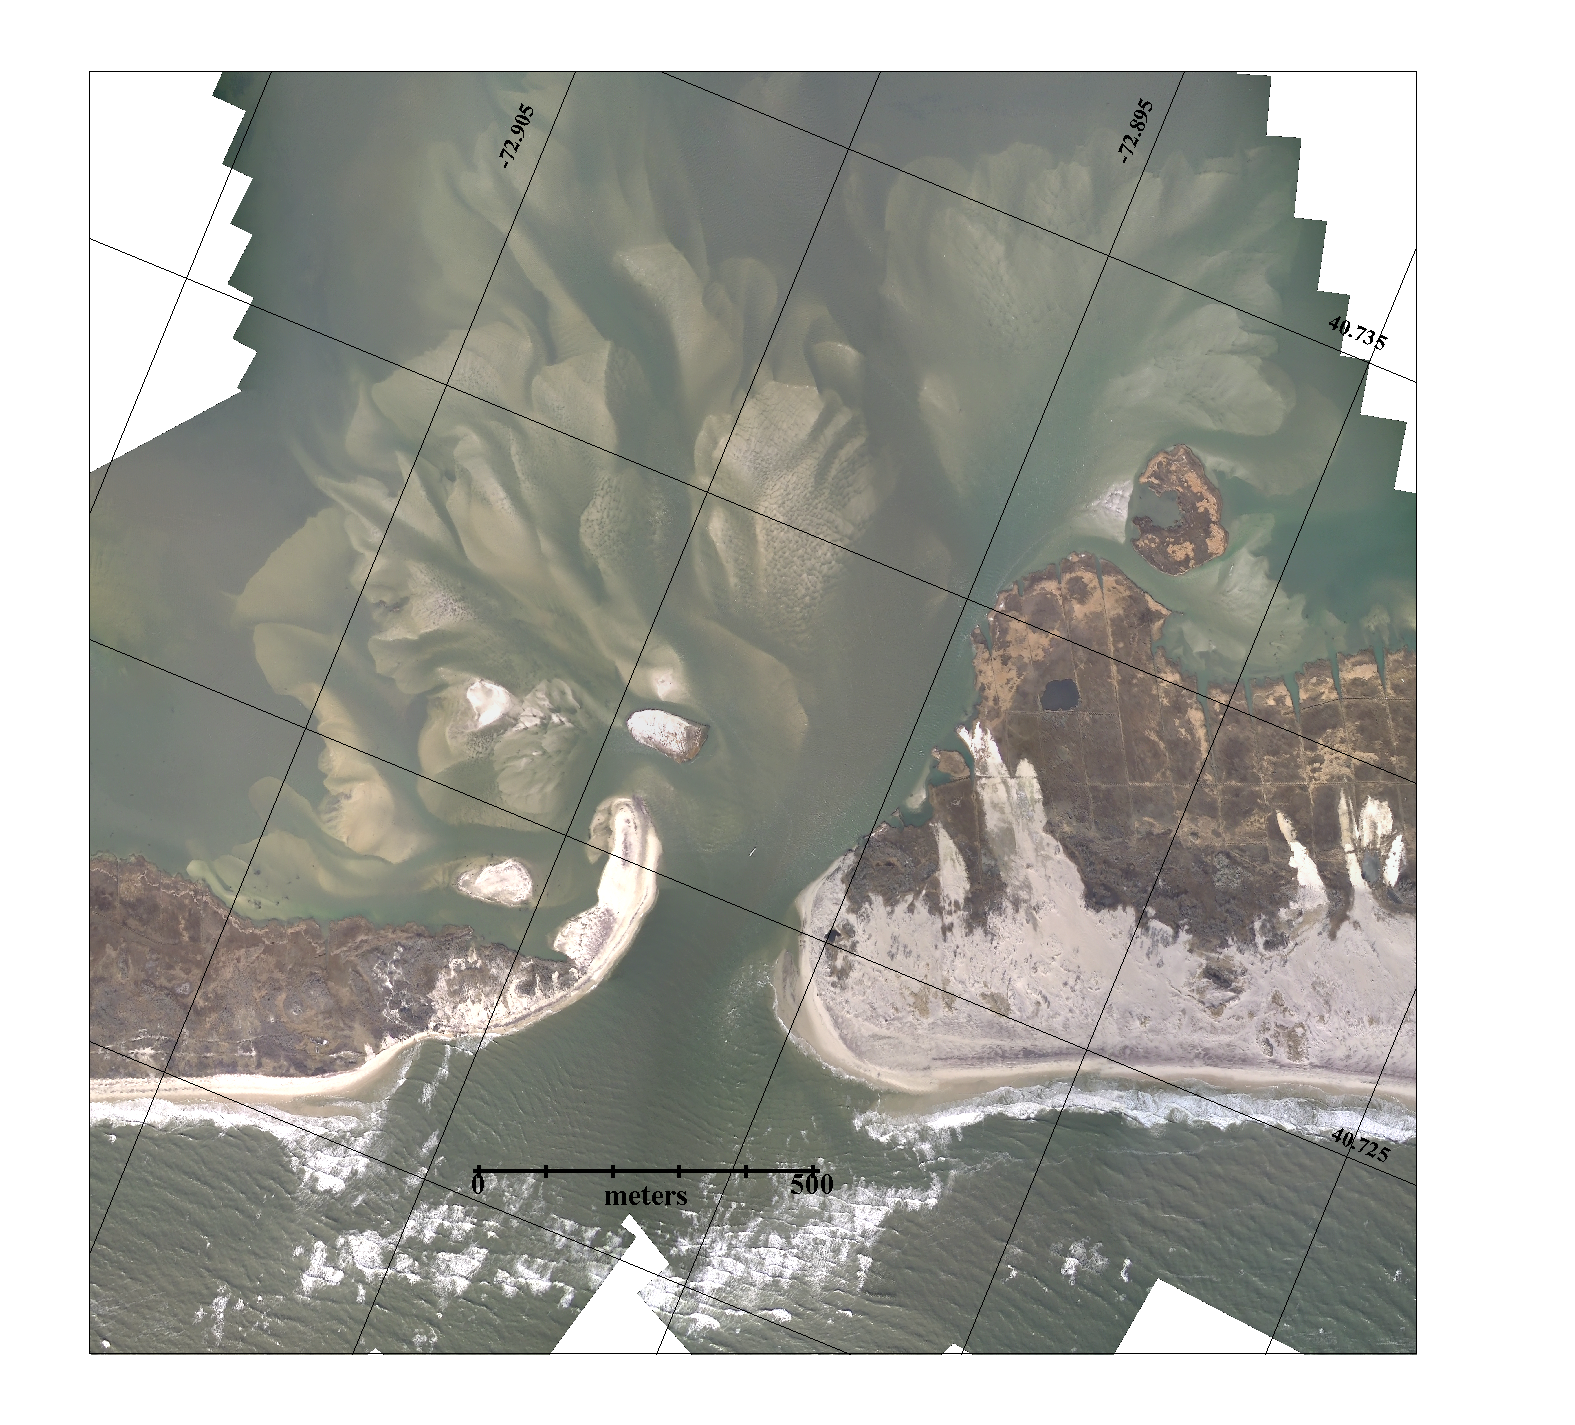
The February 27th report on the bay and inlet with new
bathymetry of the inlet is here.
The March 15th report on the inlet and the impact of
east-coast wide water level fluctuations is here.
The June 28th report on the inlet's evolution. the
cross-sectional area and changes in the Bay-wide salinity is here.
The 10th
report on the inlet's condition, issued Dec 12, 2013 is here.
The 11th report on the inlet's condition, issued Oct 20, 2014
is here.
The 12th report on the inlet's condition, issued Jan 9, 2015
is here.
The 14th report on the inlet's condition, issued Aug 7, 2015
is here.
The 15th
report on the inlet's condition, issued March 16, 2016 is here.
The 16th report on the inlet's condition, issued Sept 14, 2016
is here.
The 17th report on the inlet/breach's condition, issued July
12, 2017 is here.
The 18th
report on the inlet/breach's condition, issued Oct 28, 2017 is
here.
The 19th report on the
inlet/breach's condition, issued Oct 29, 2018 is here.
The 20th report on the
inlet/breach's condition, issued Feb 15, 2019 is here
The 21th
report on the inlet/breach's condition, issued Sep 24, 2019 is
here.
The 22th
report on the inlet/breach's condition, issued Feb 15, 2020 is
here.
The 23th report on the
inlet/breach's condition, issued Jan 14, 2021 is here.
The 24th
report on the inlet/breach's condition, issued Mar 18, 2021 is
here.
The 25th
report on the inlet/breach's condition, issued Nov 4, 2021 is
here.
The 27th report on the
inlet/breach's condition, issued Mar 18 2022 is here.
Peer
reviewed publication by Hinrichs et al (2018) on the impact
of the breach on Great South Bay
April
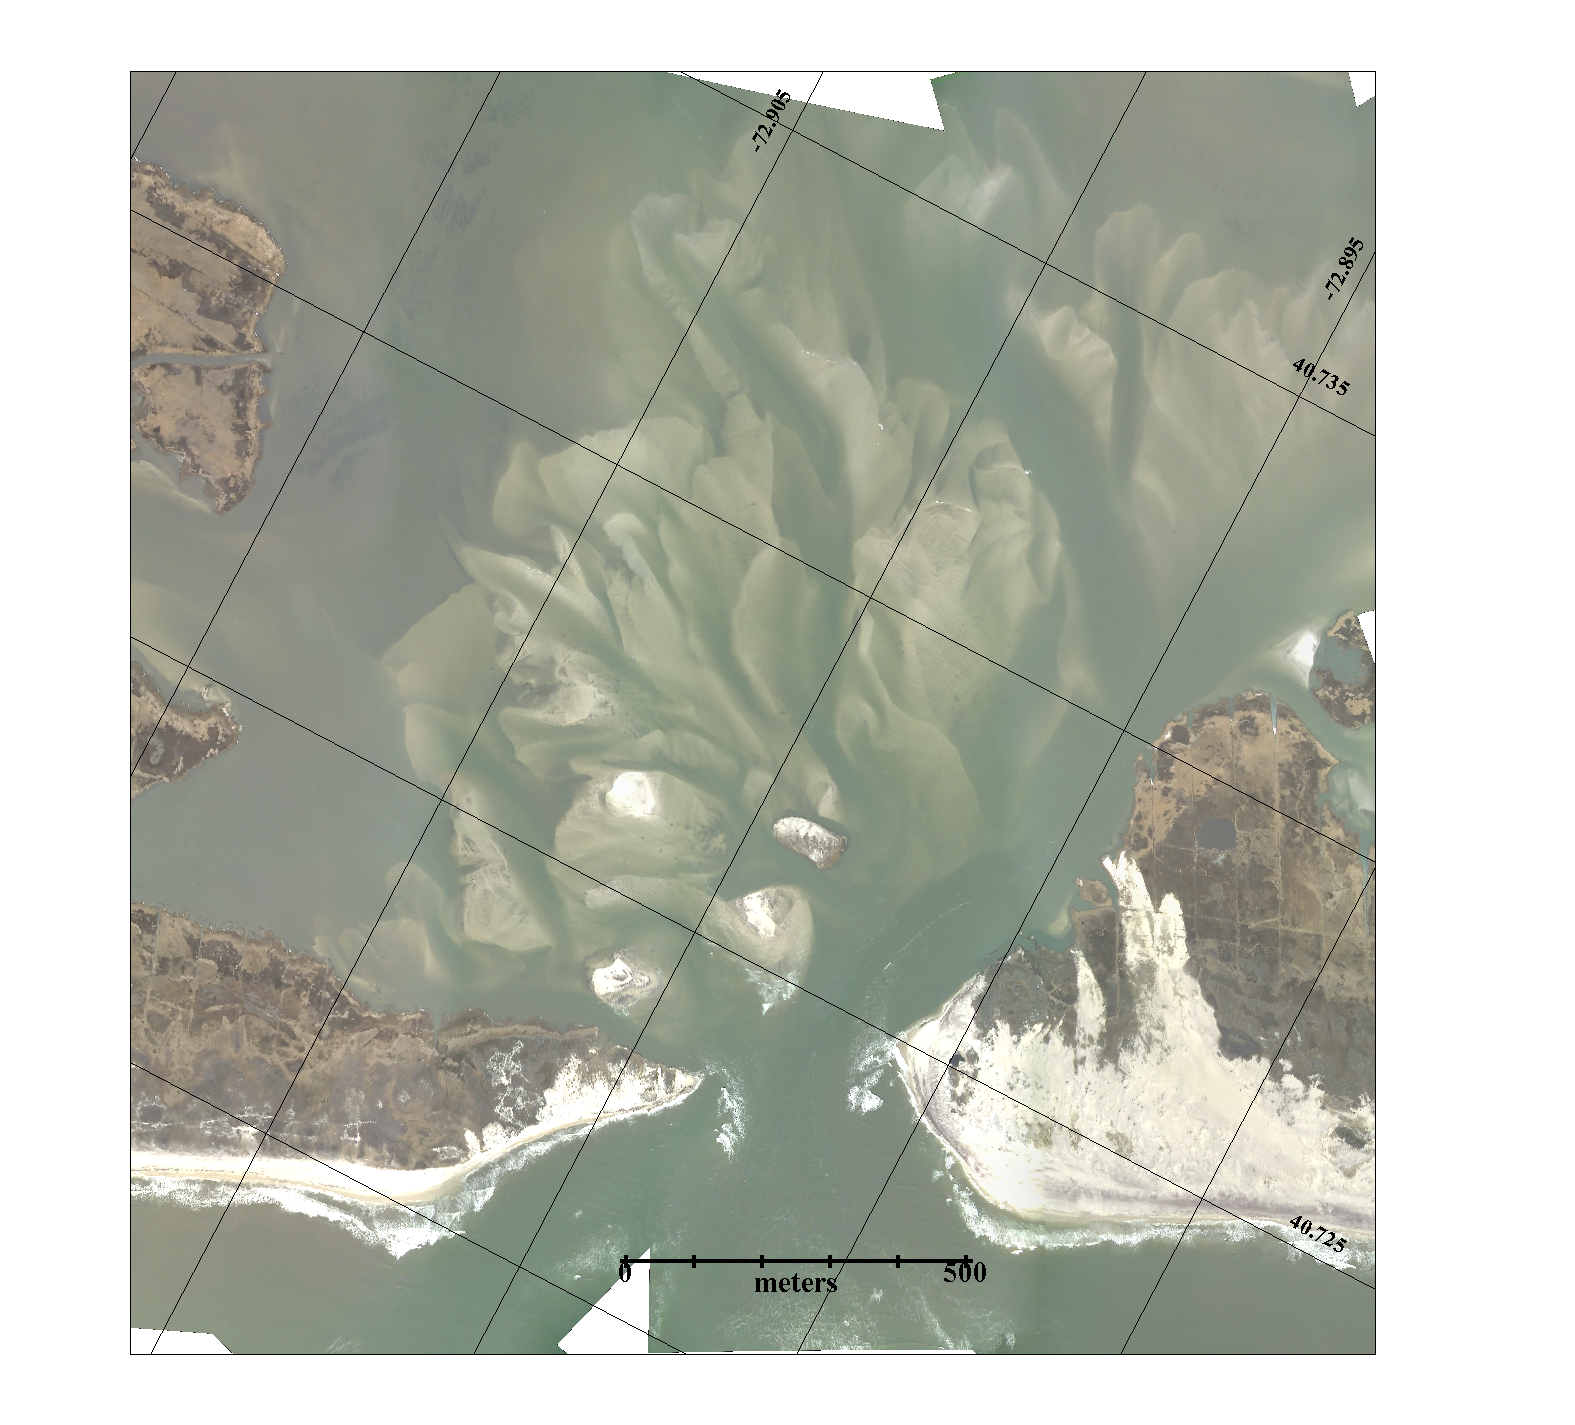
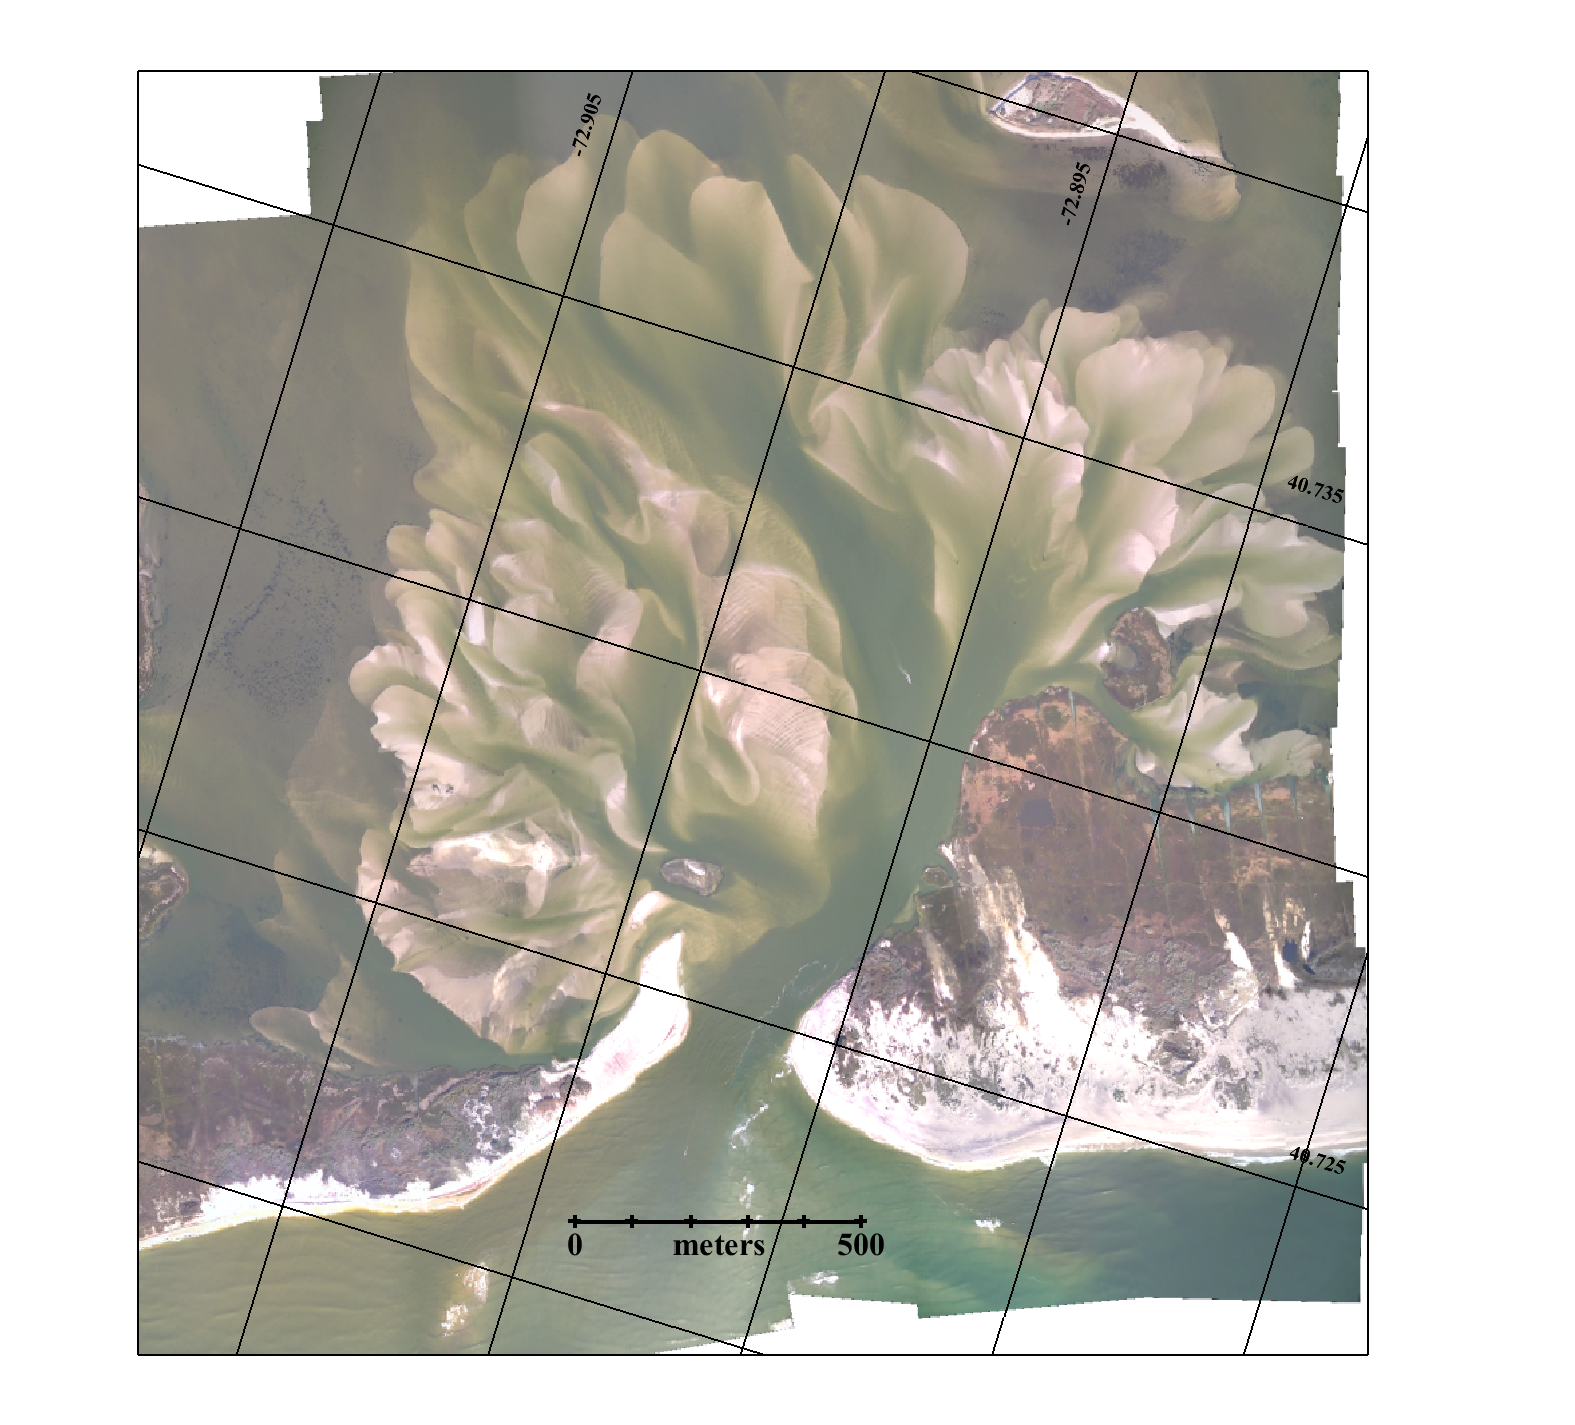
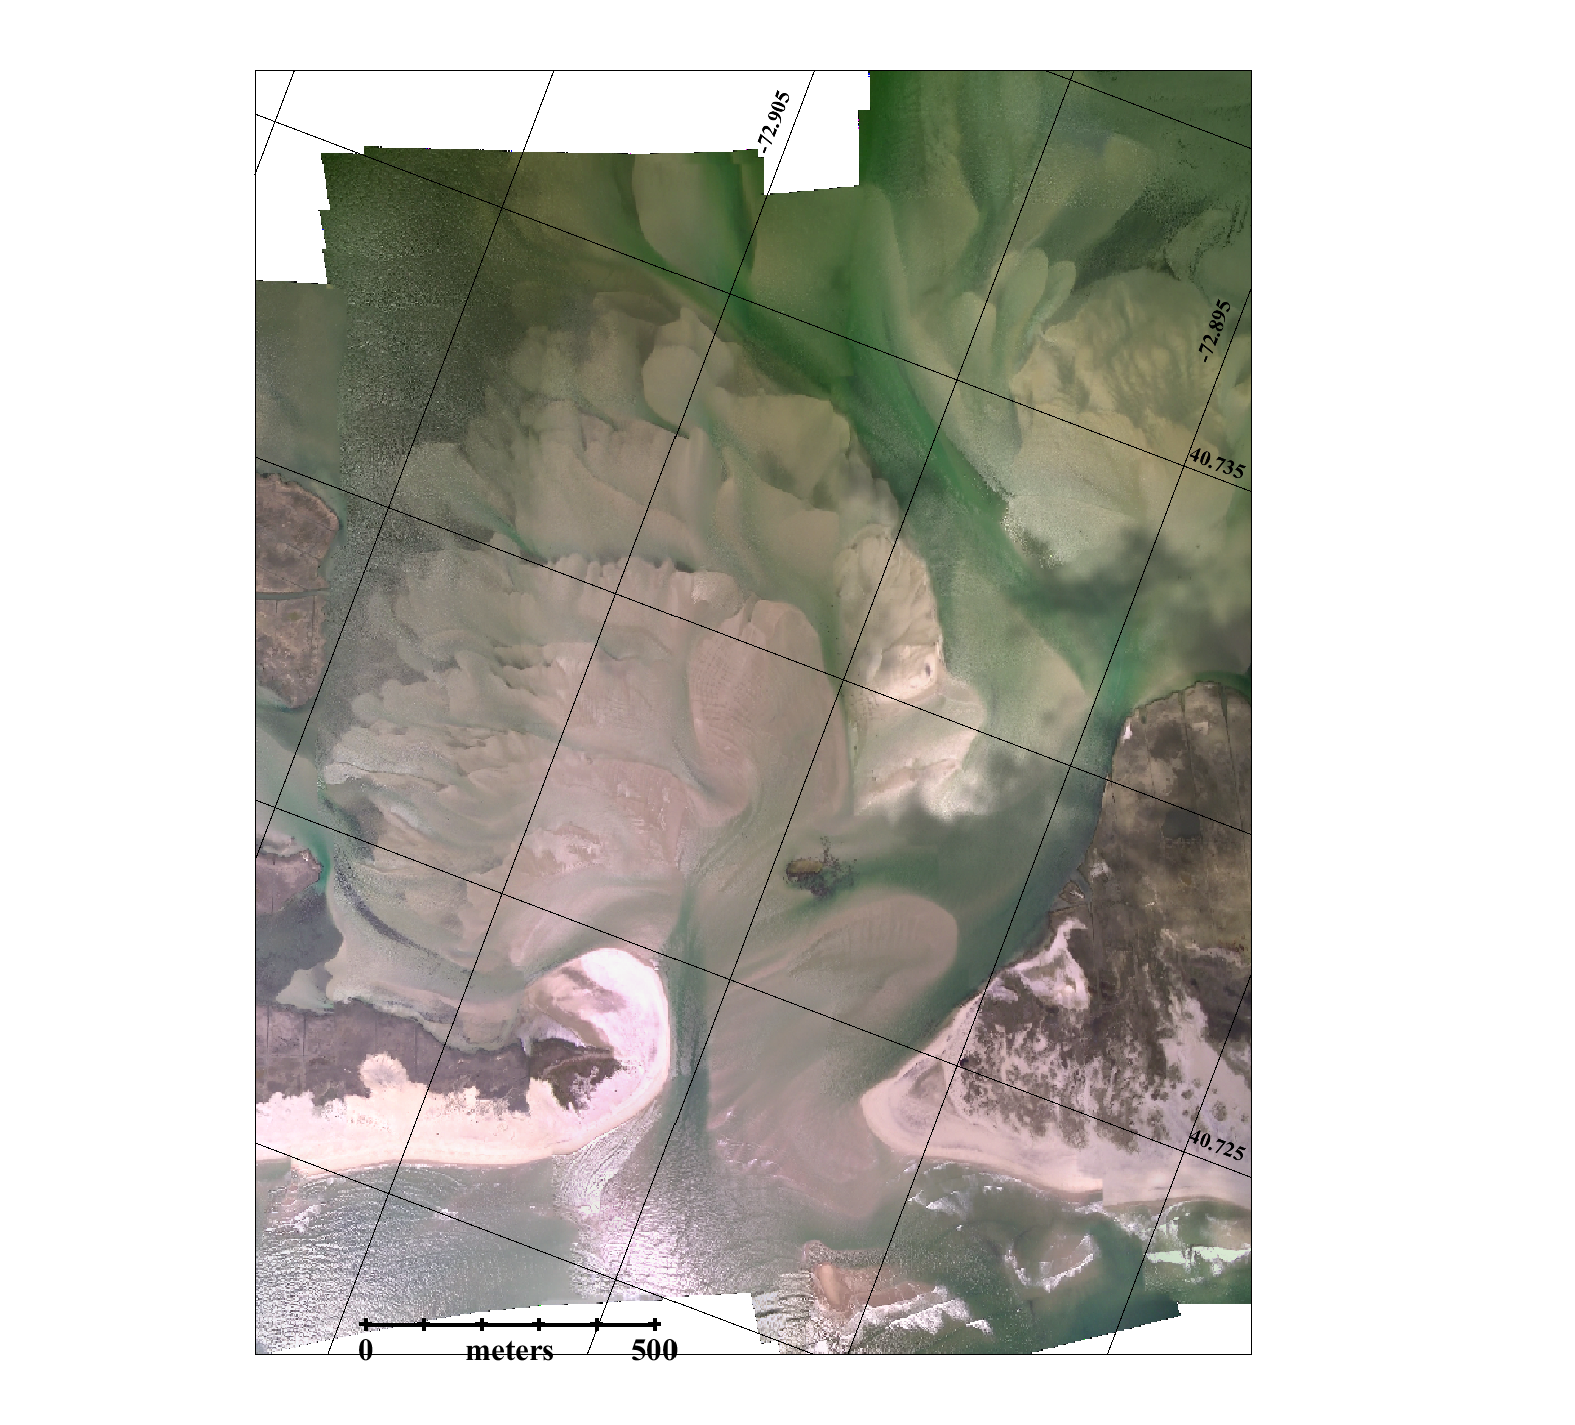
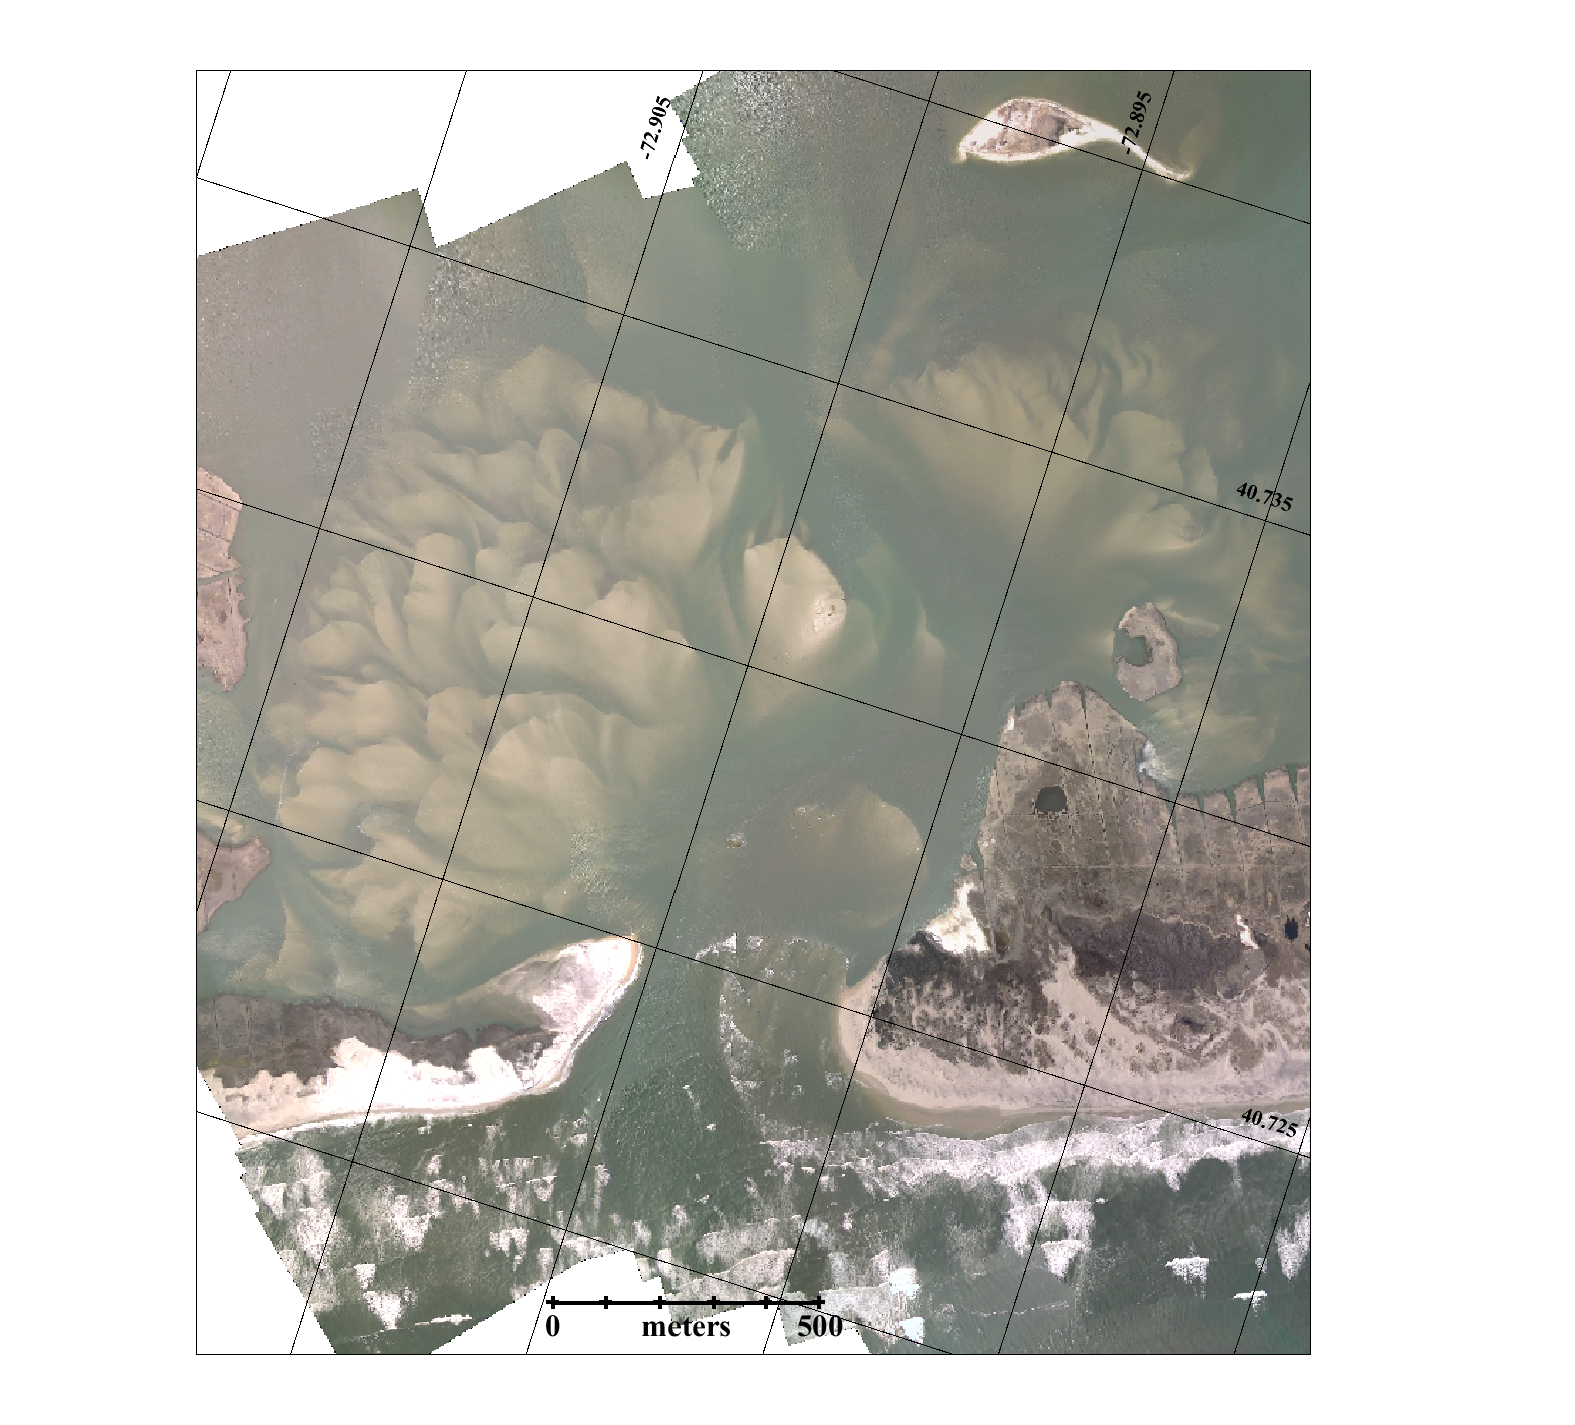
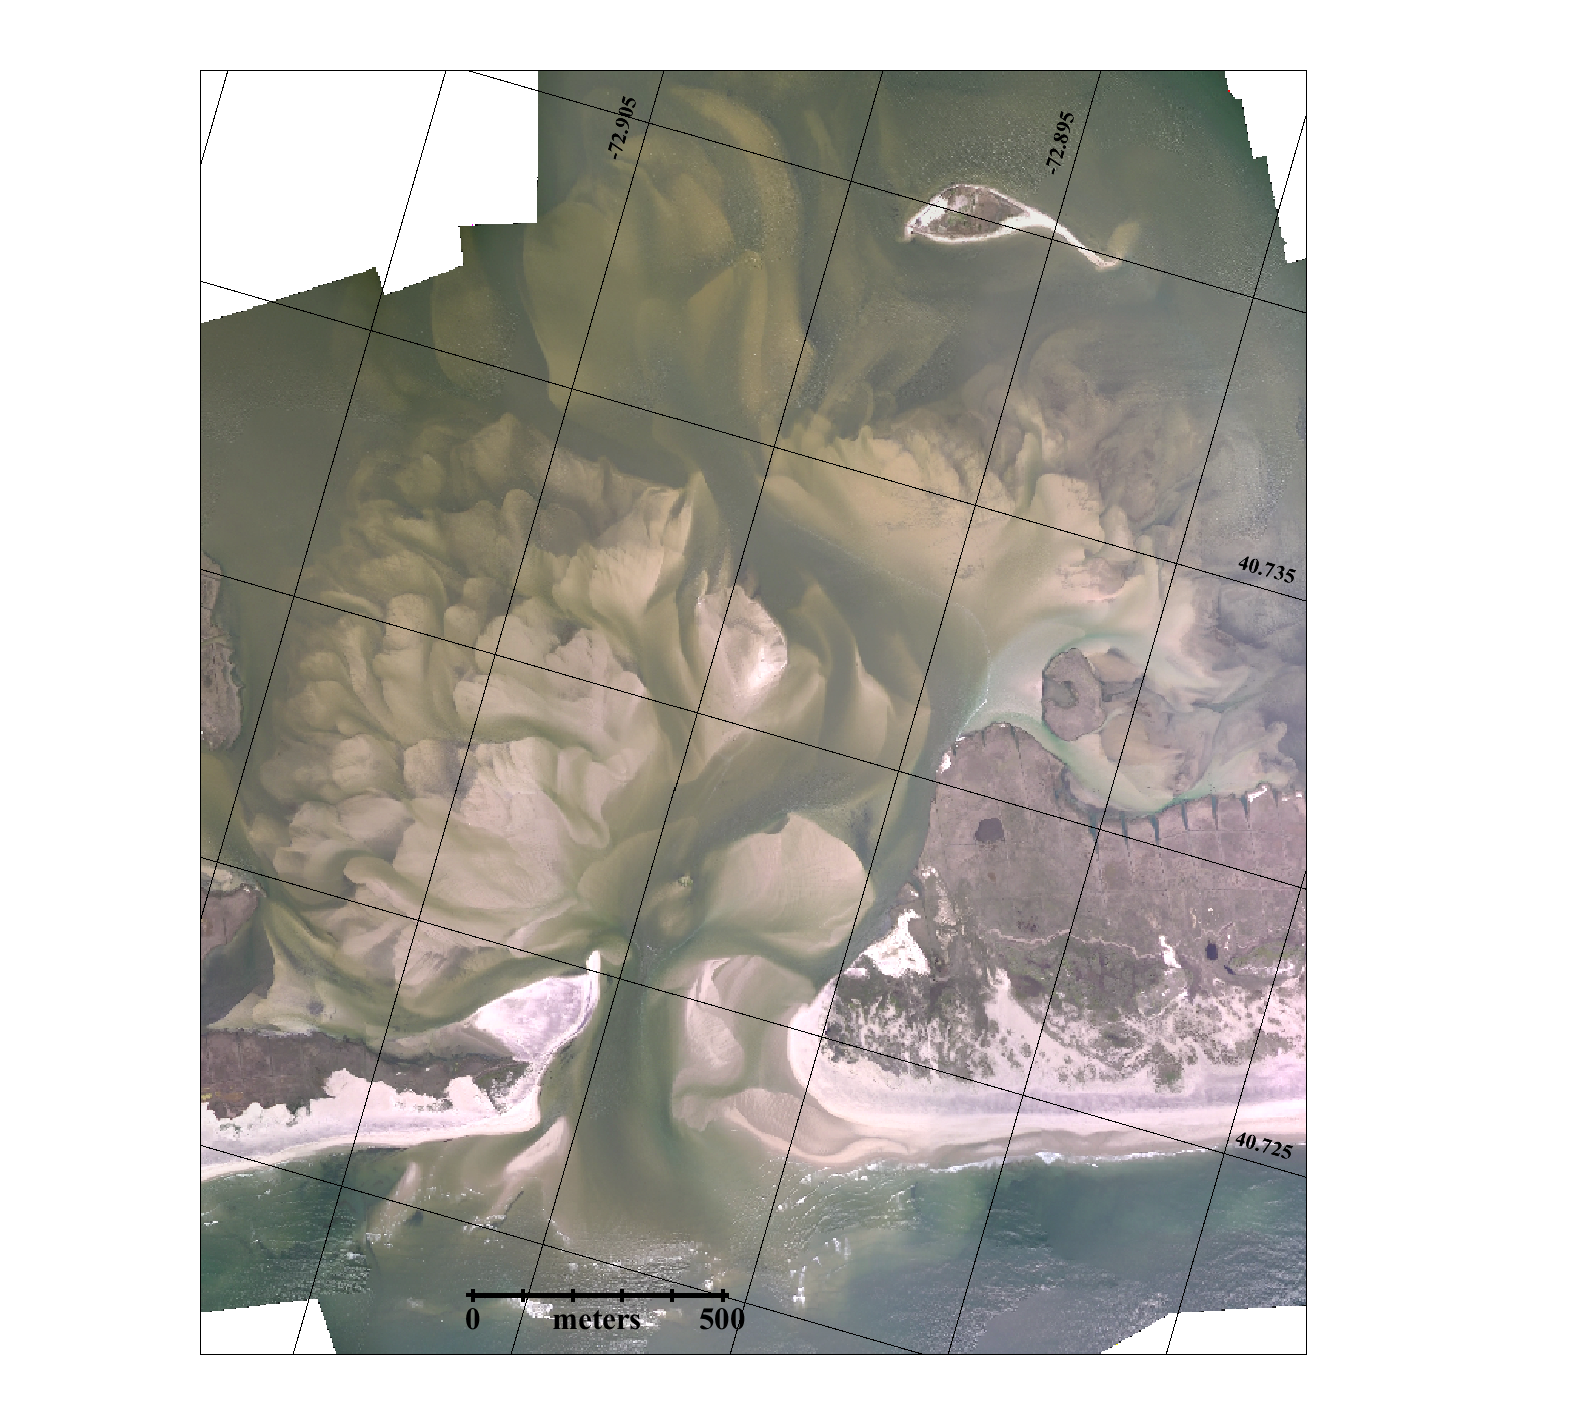
2005 (CF) |
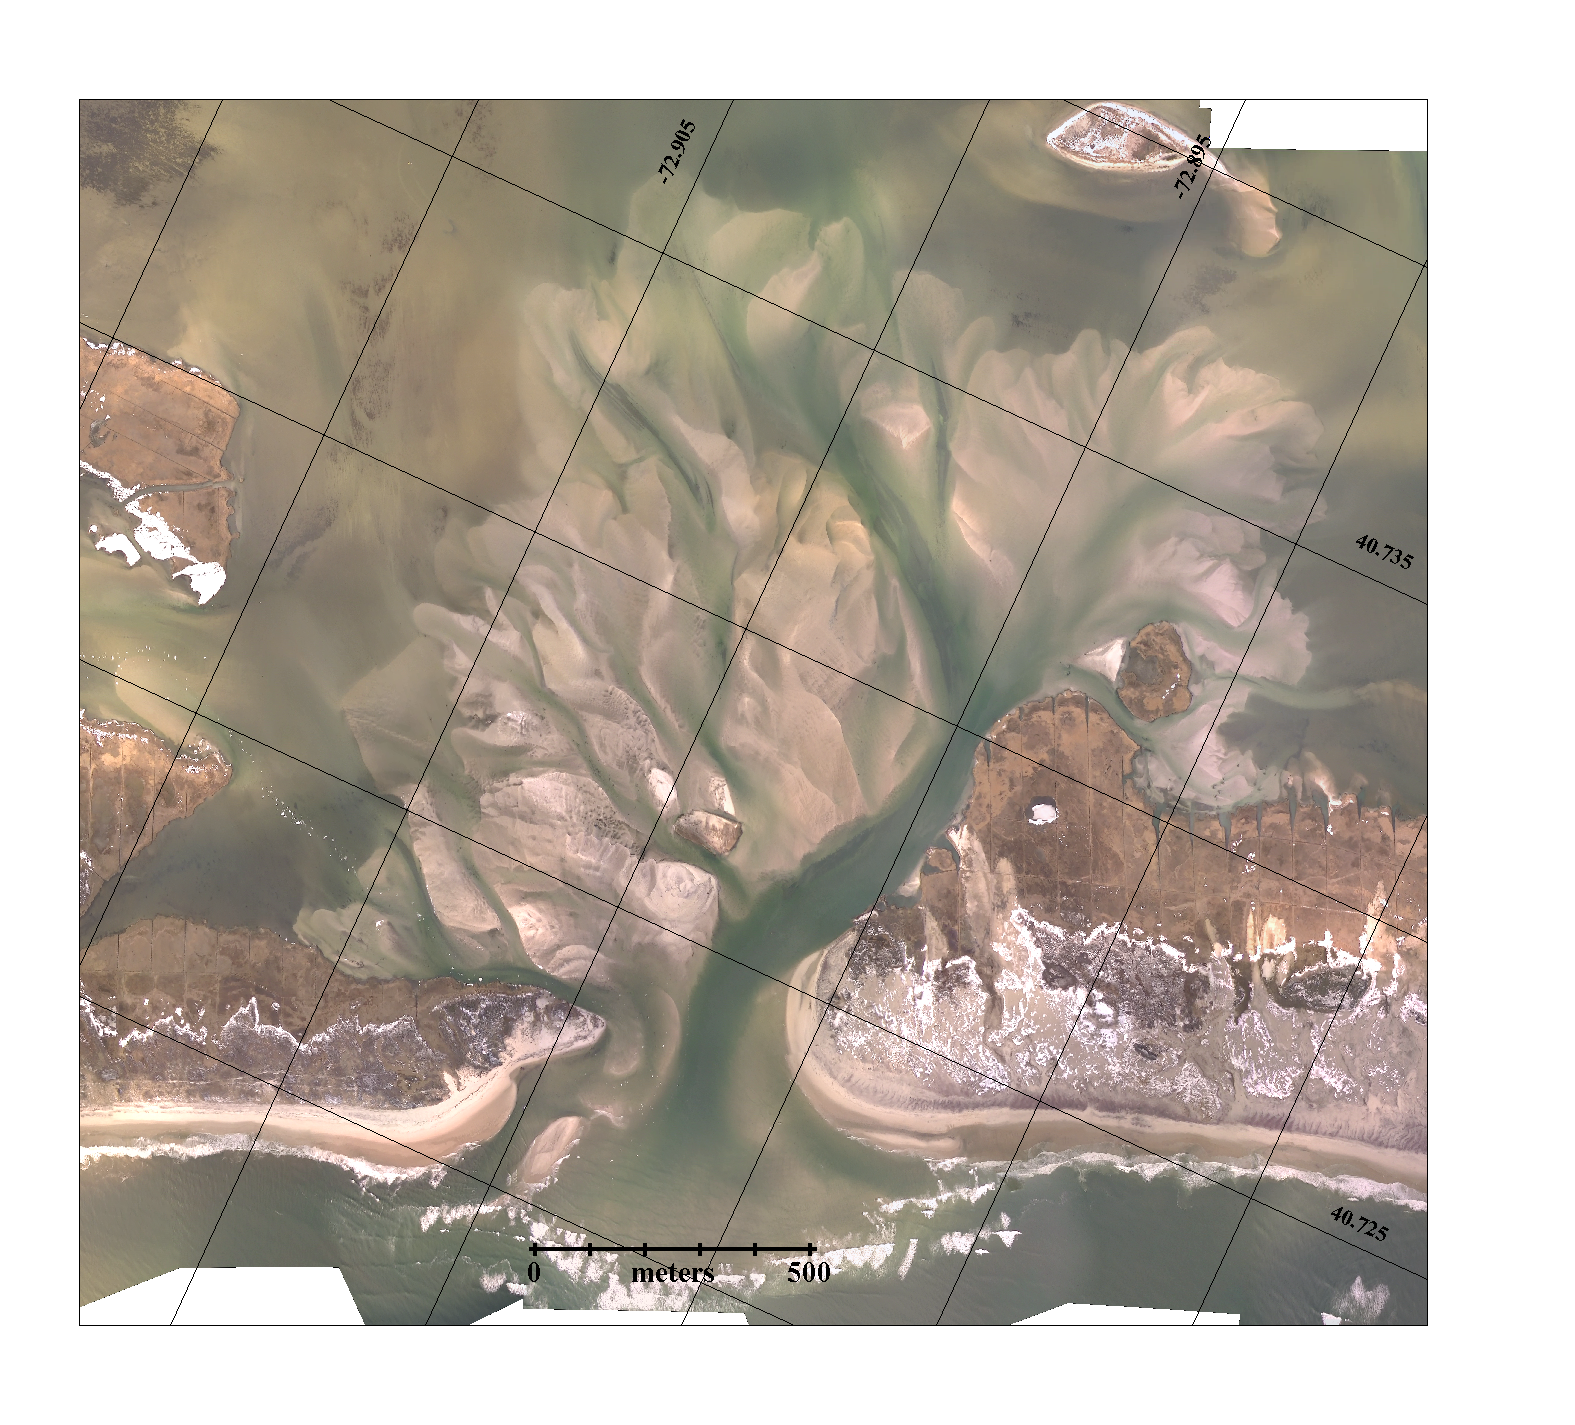
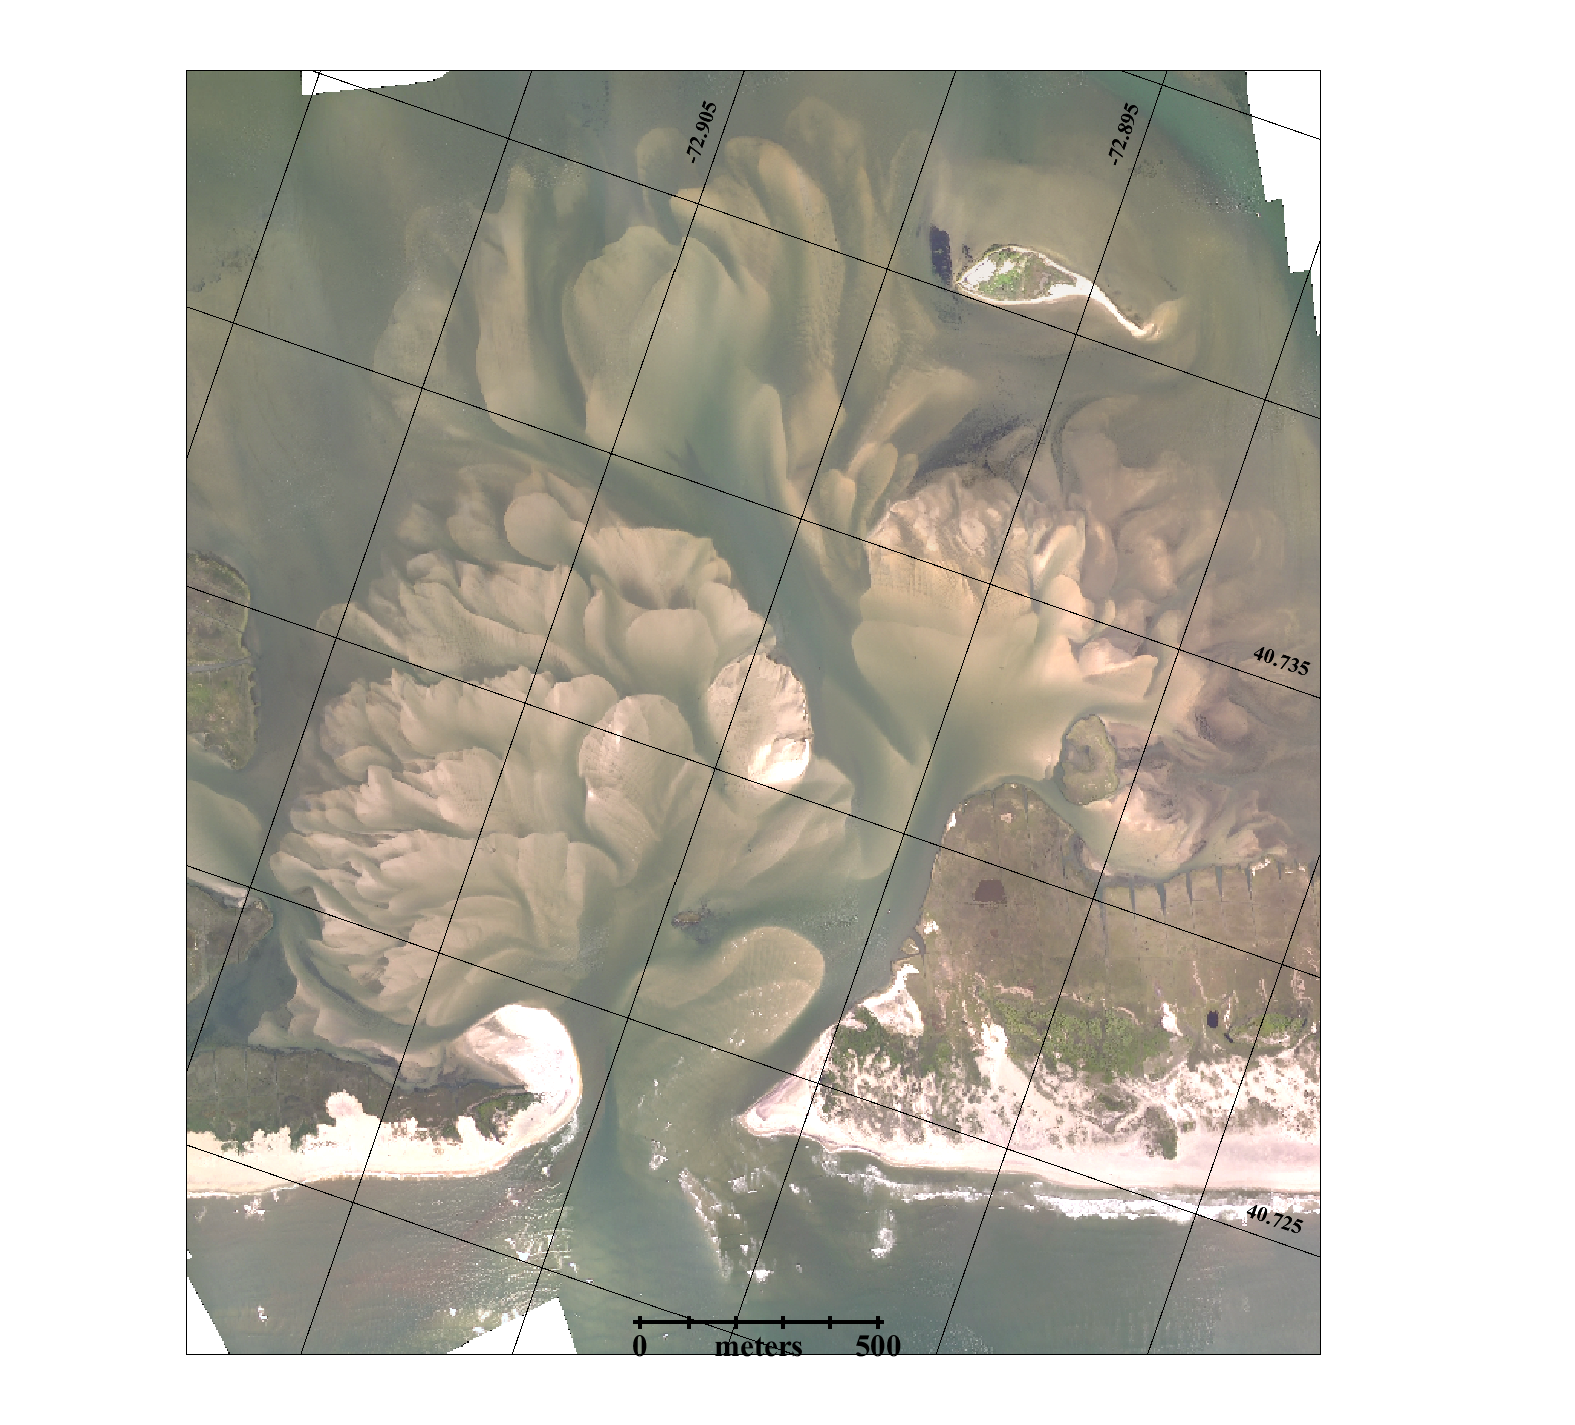
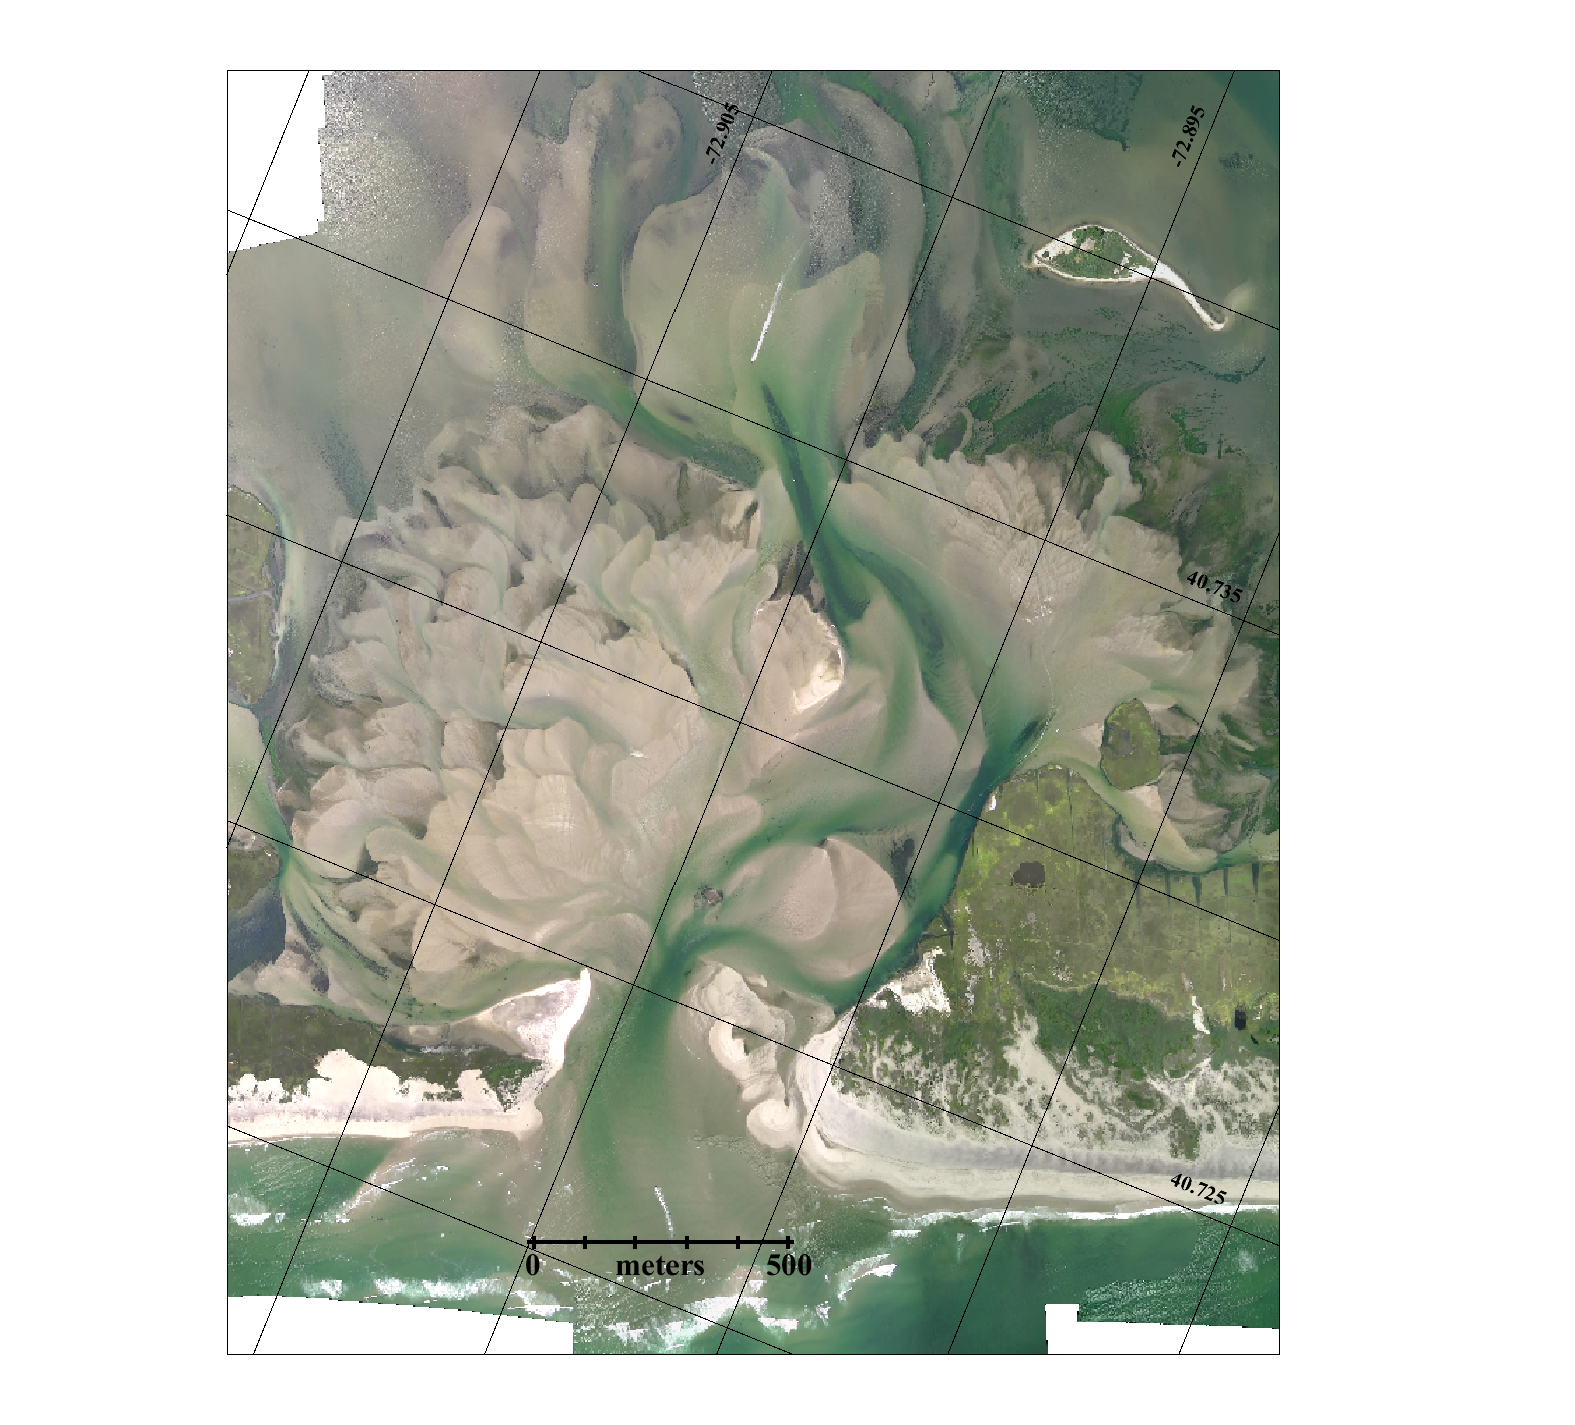
Nov 3, 2012 (CF&RG)
|
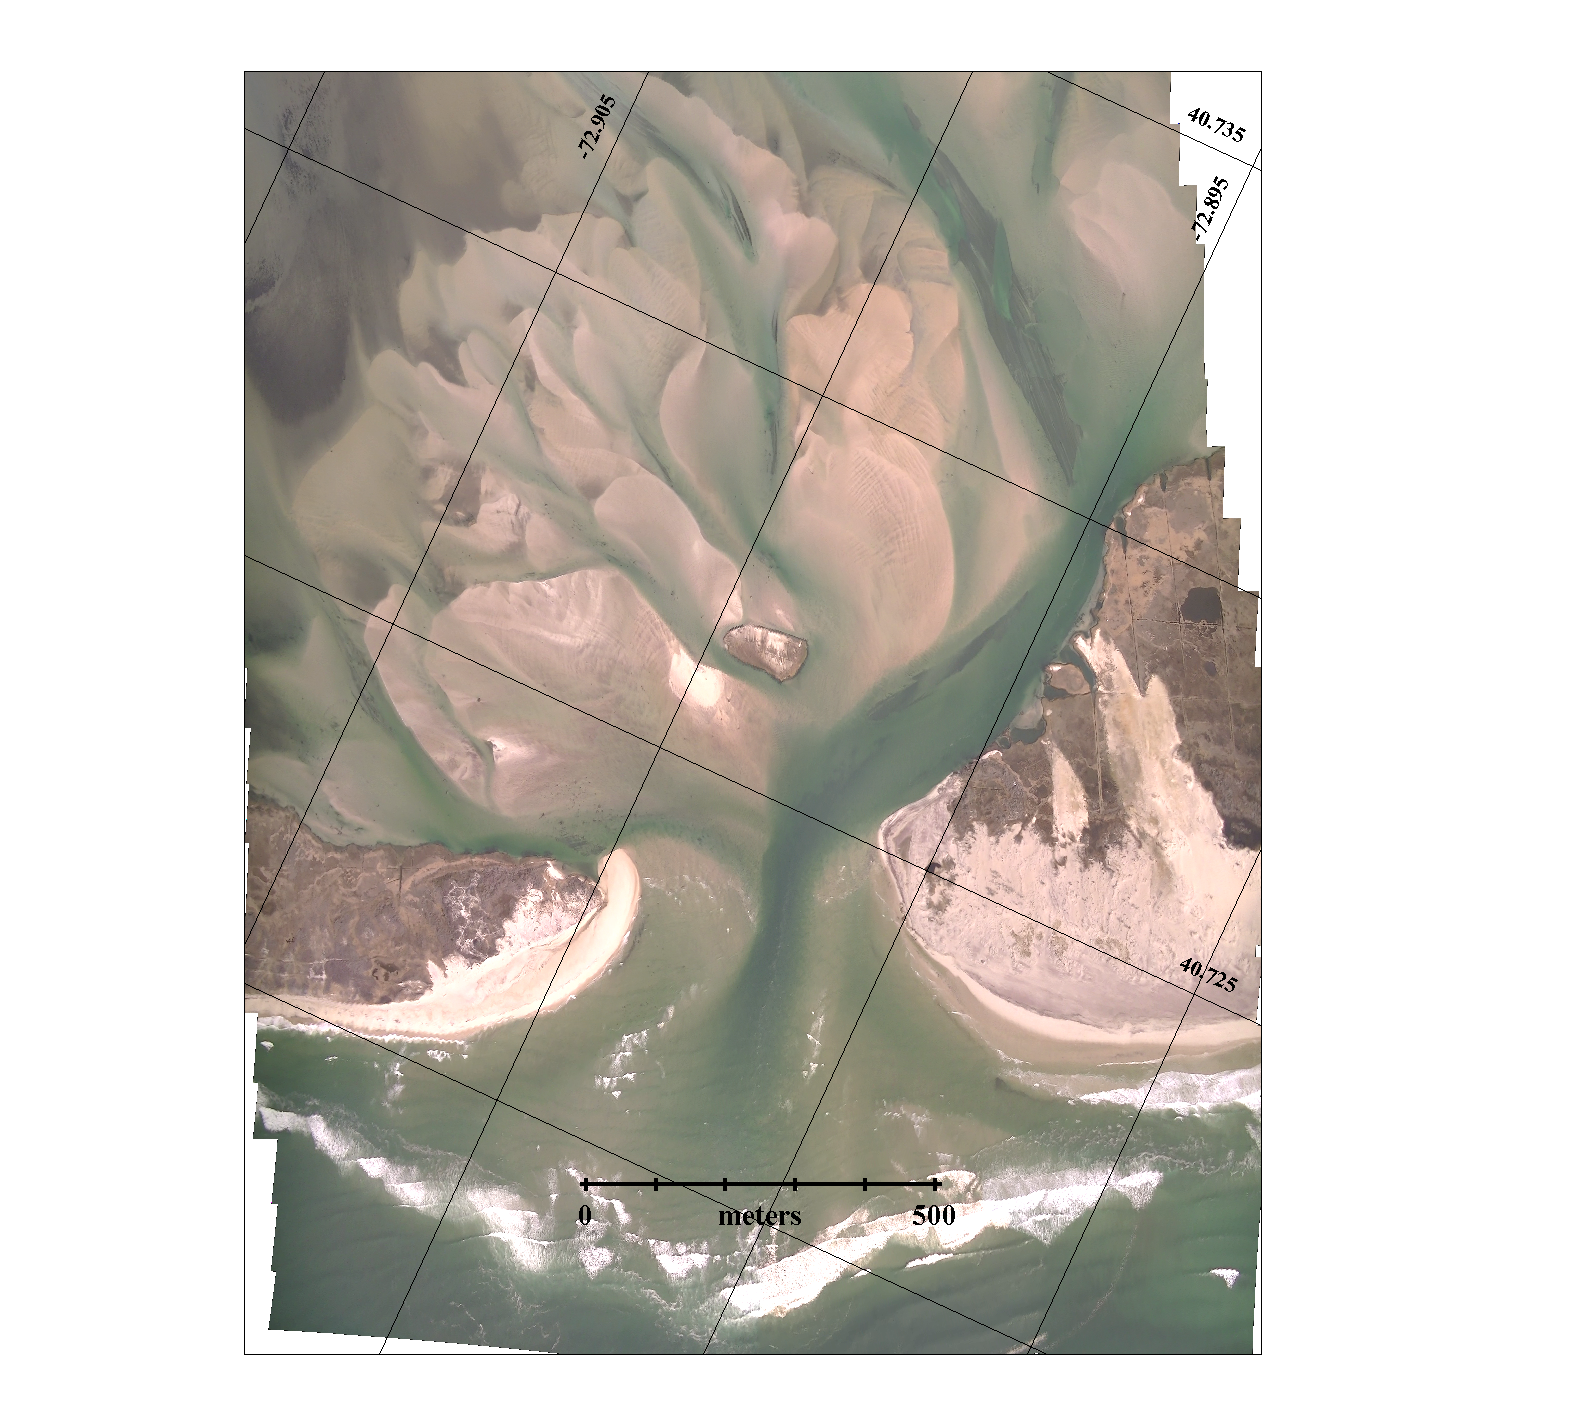
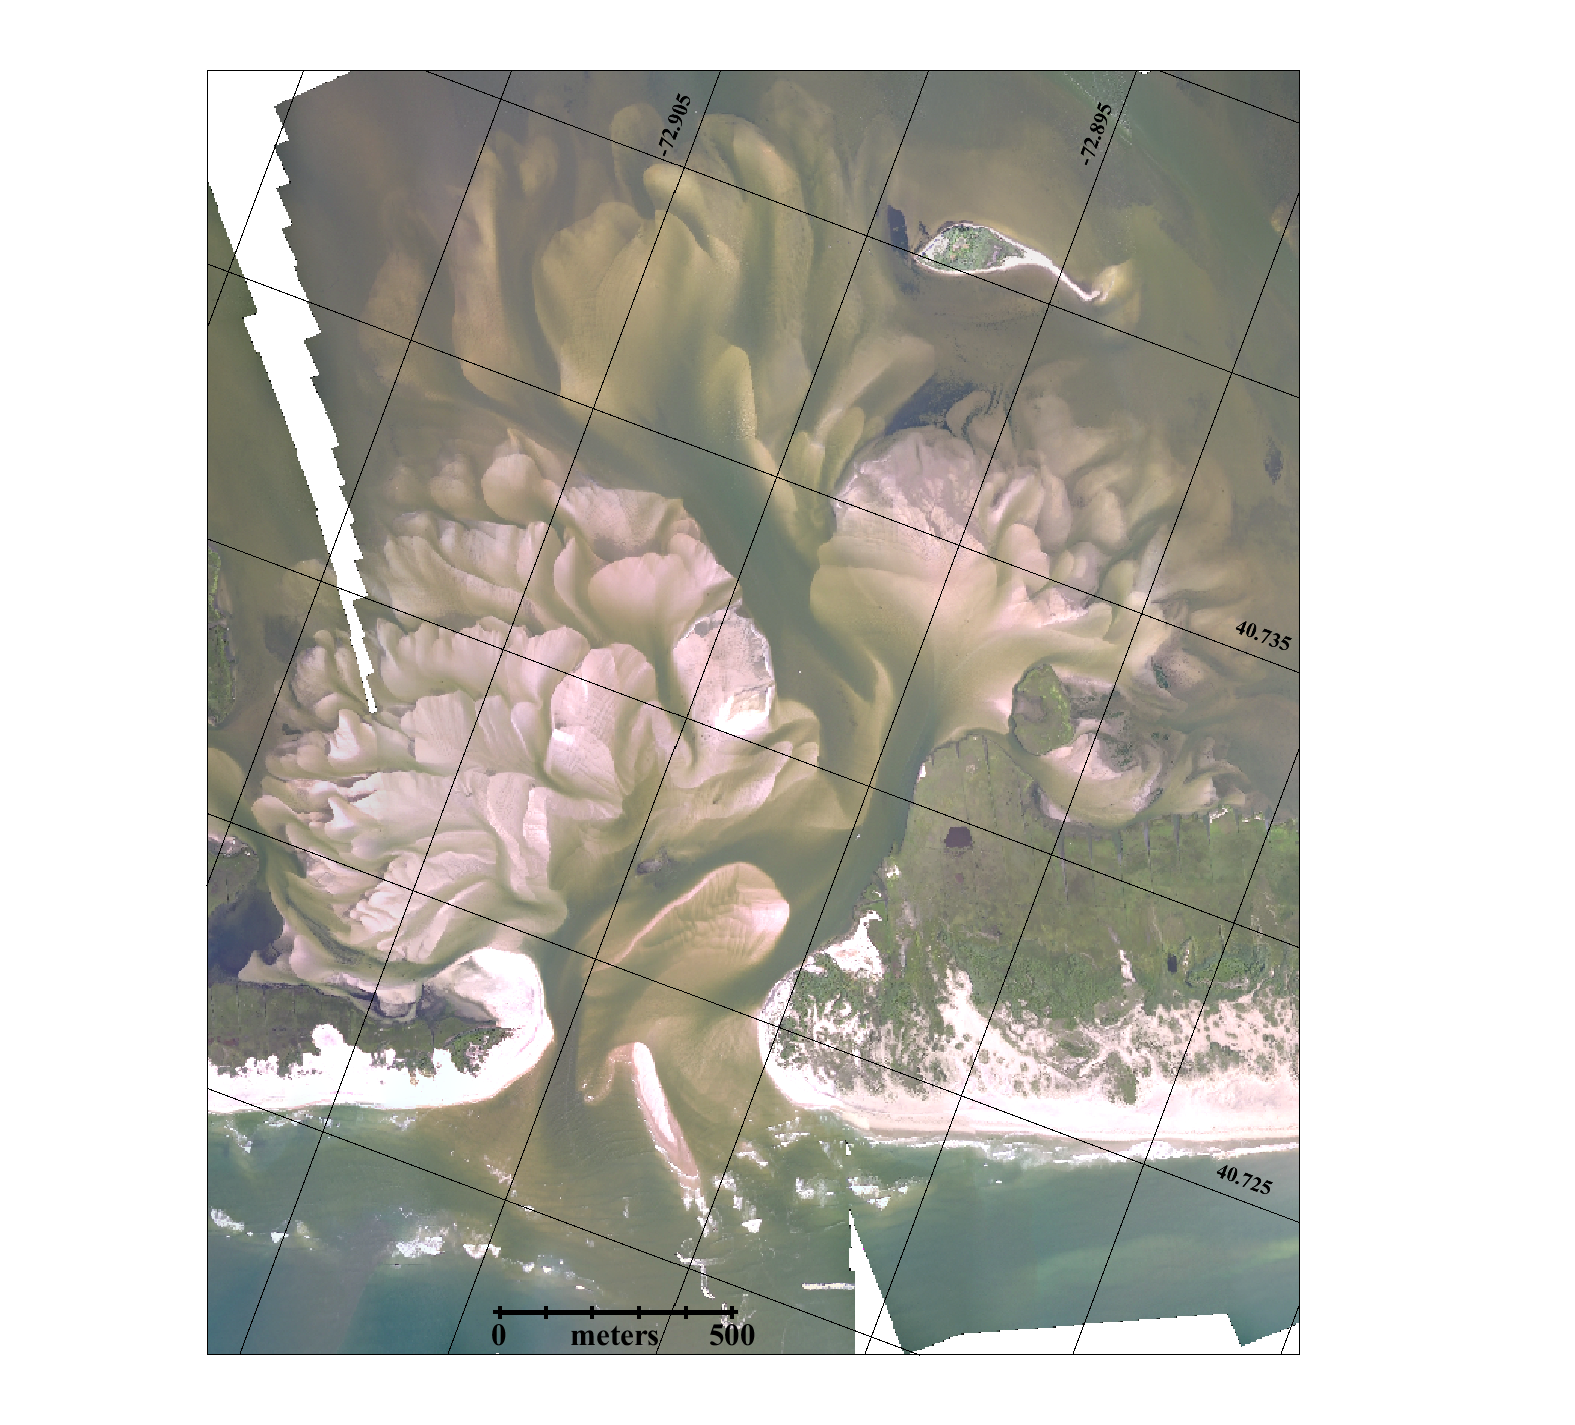
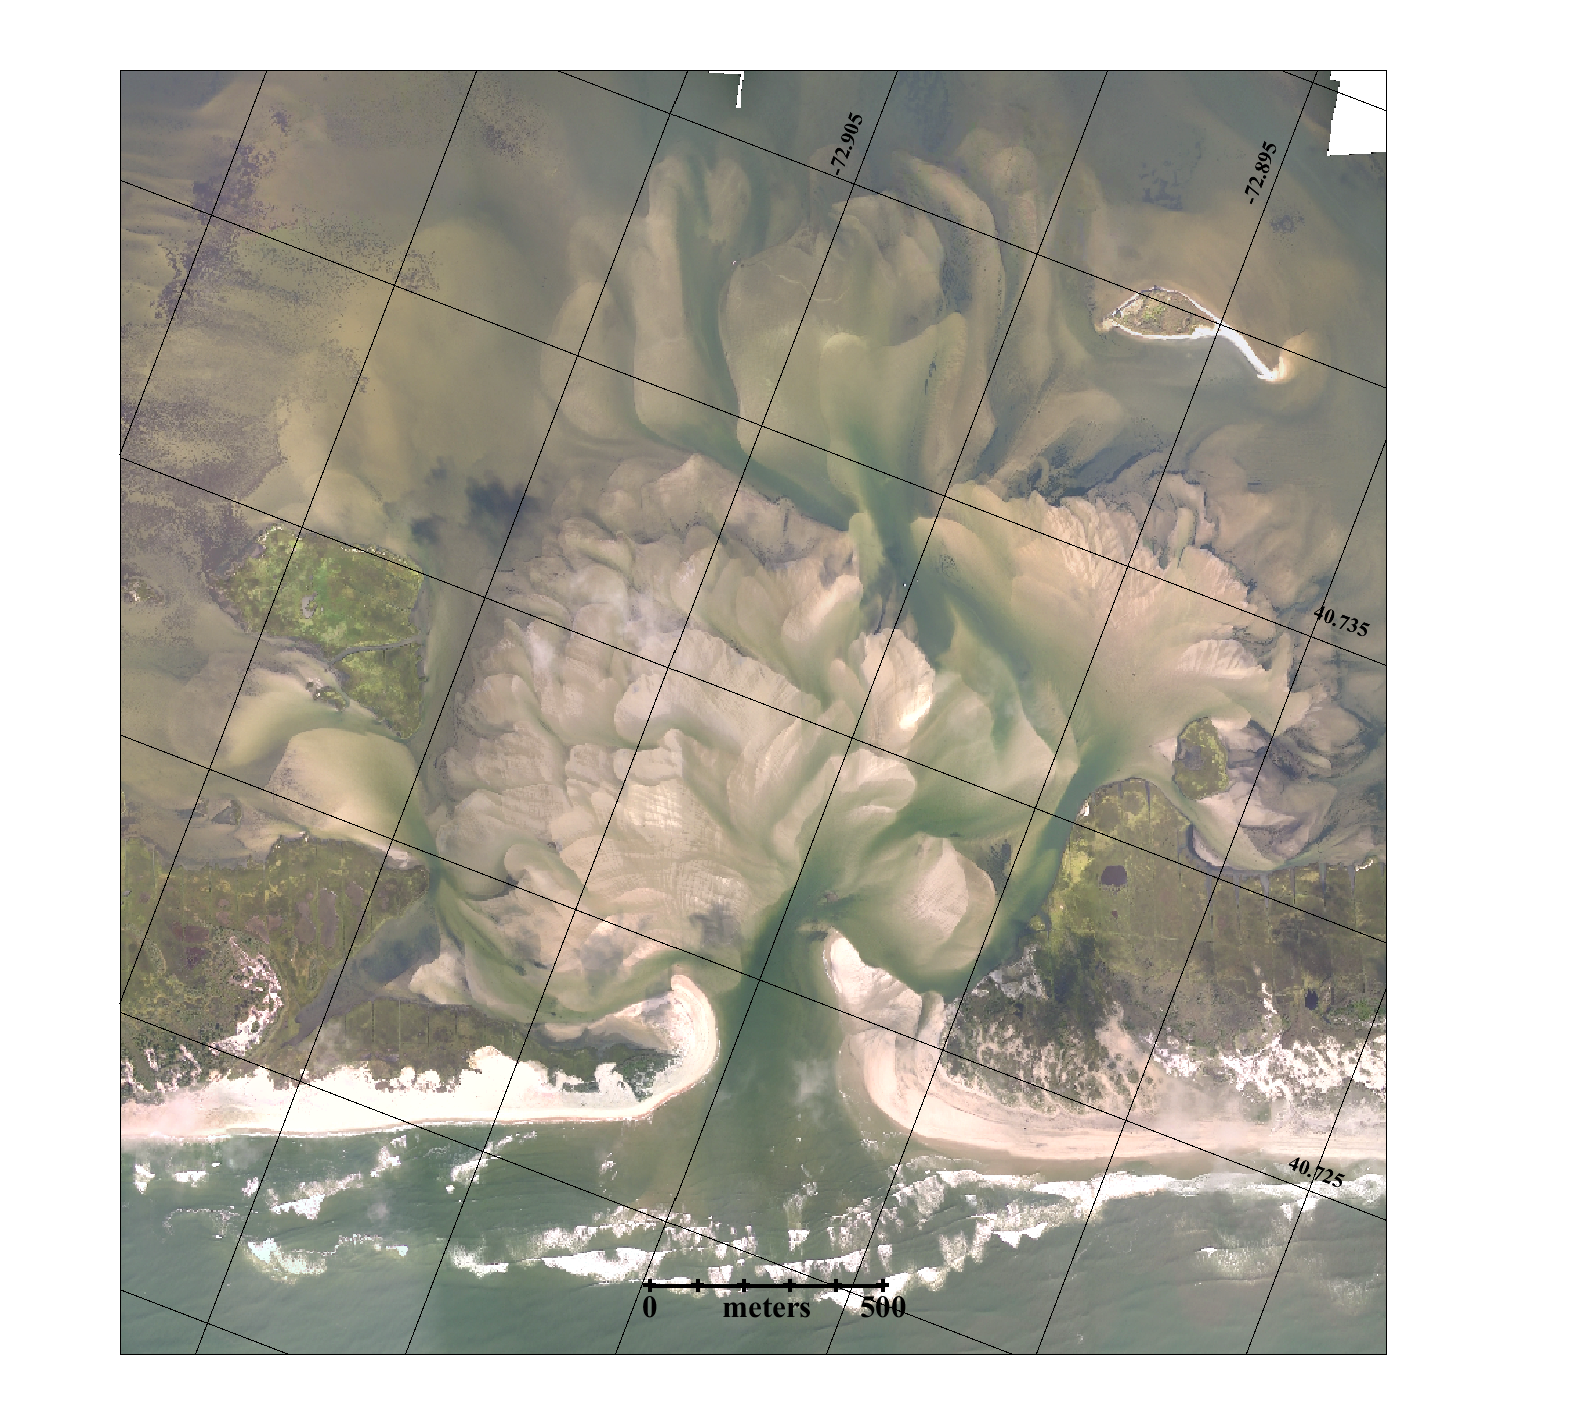
Nov 11, 2012 (CF&RG)
 |
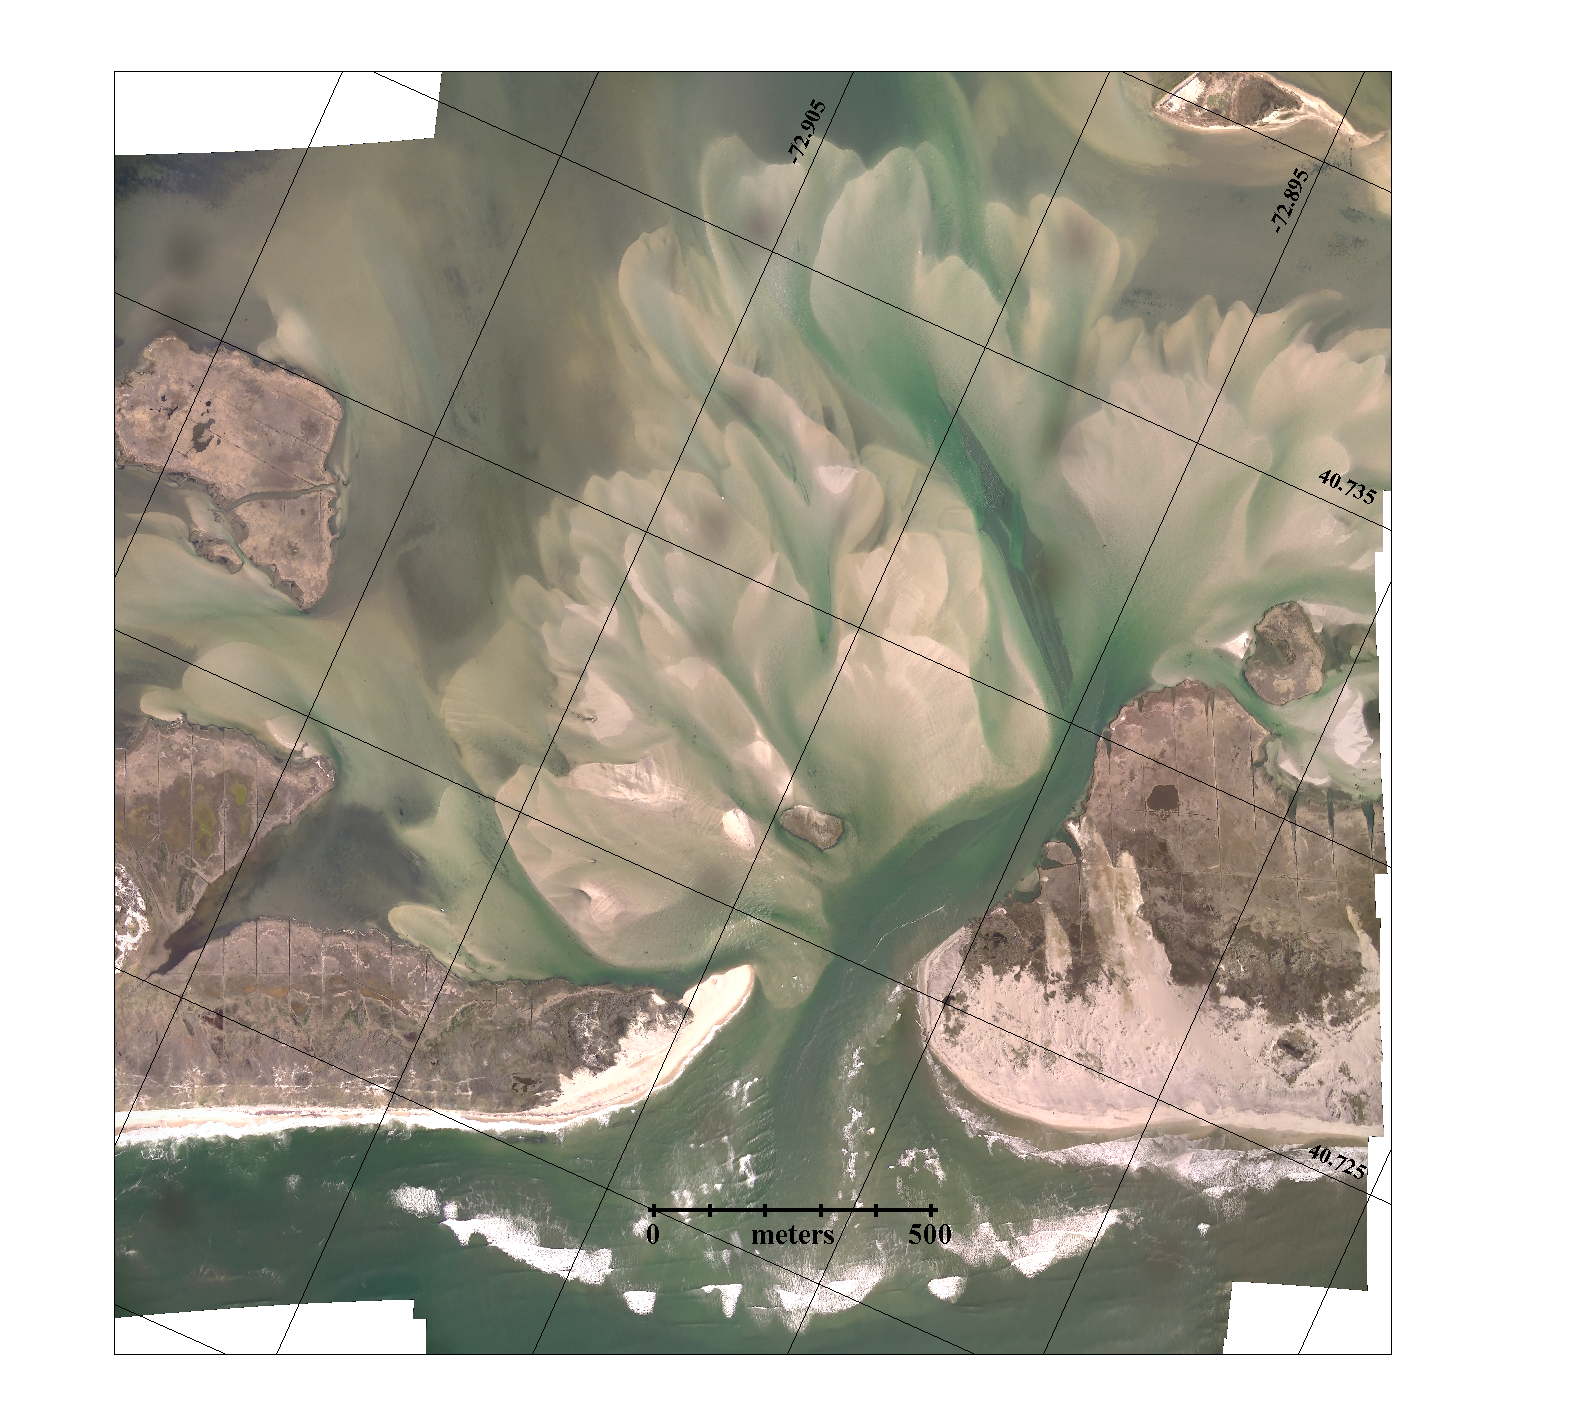
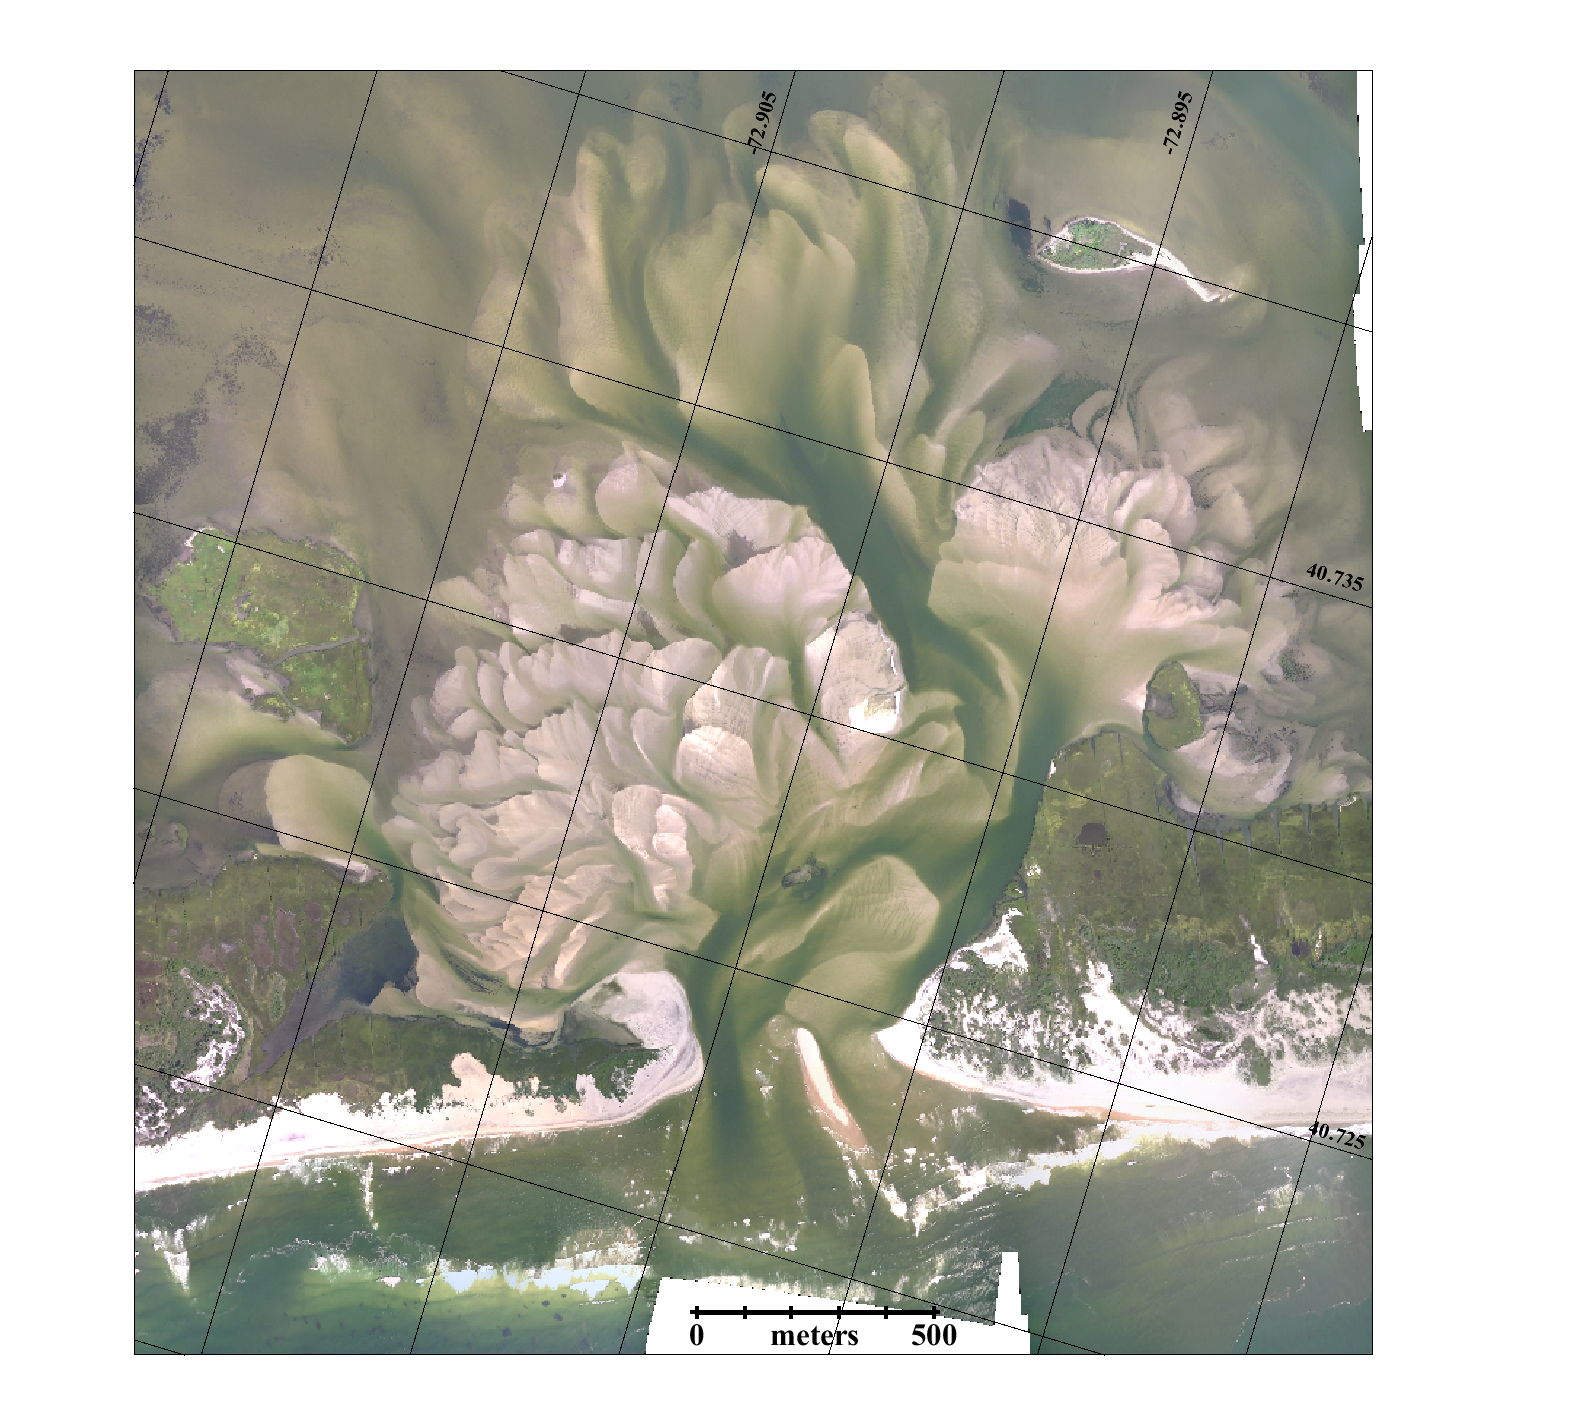
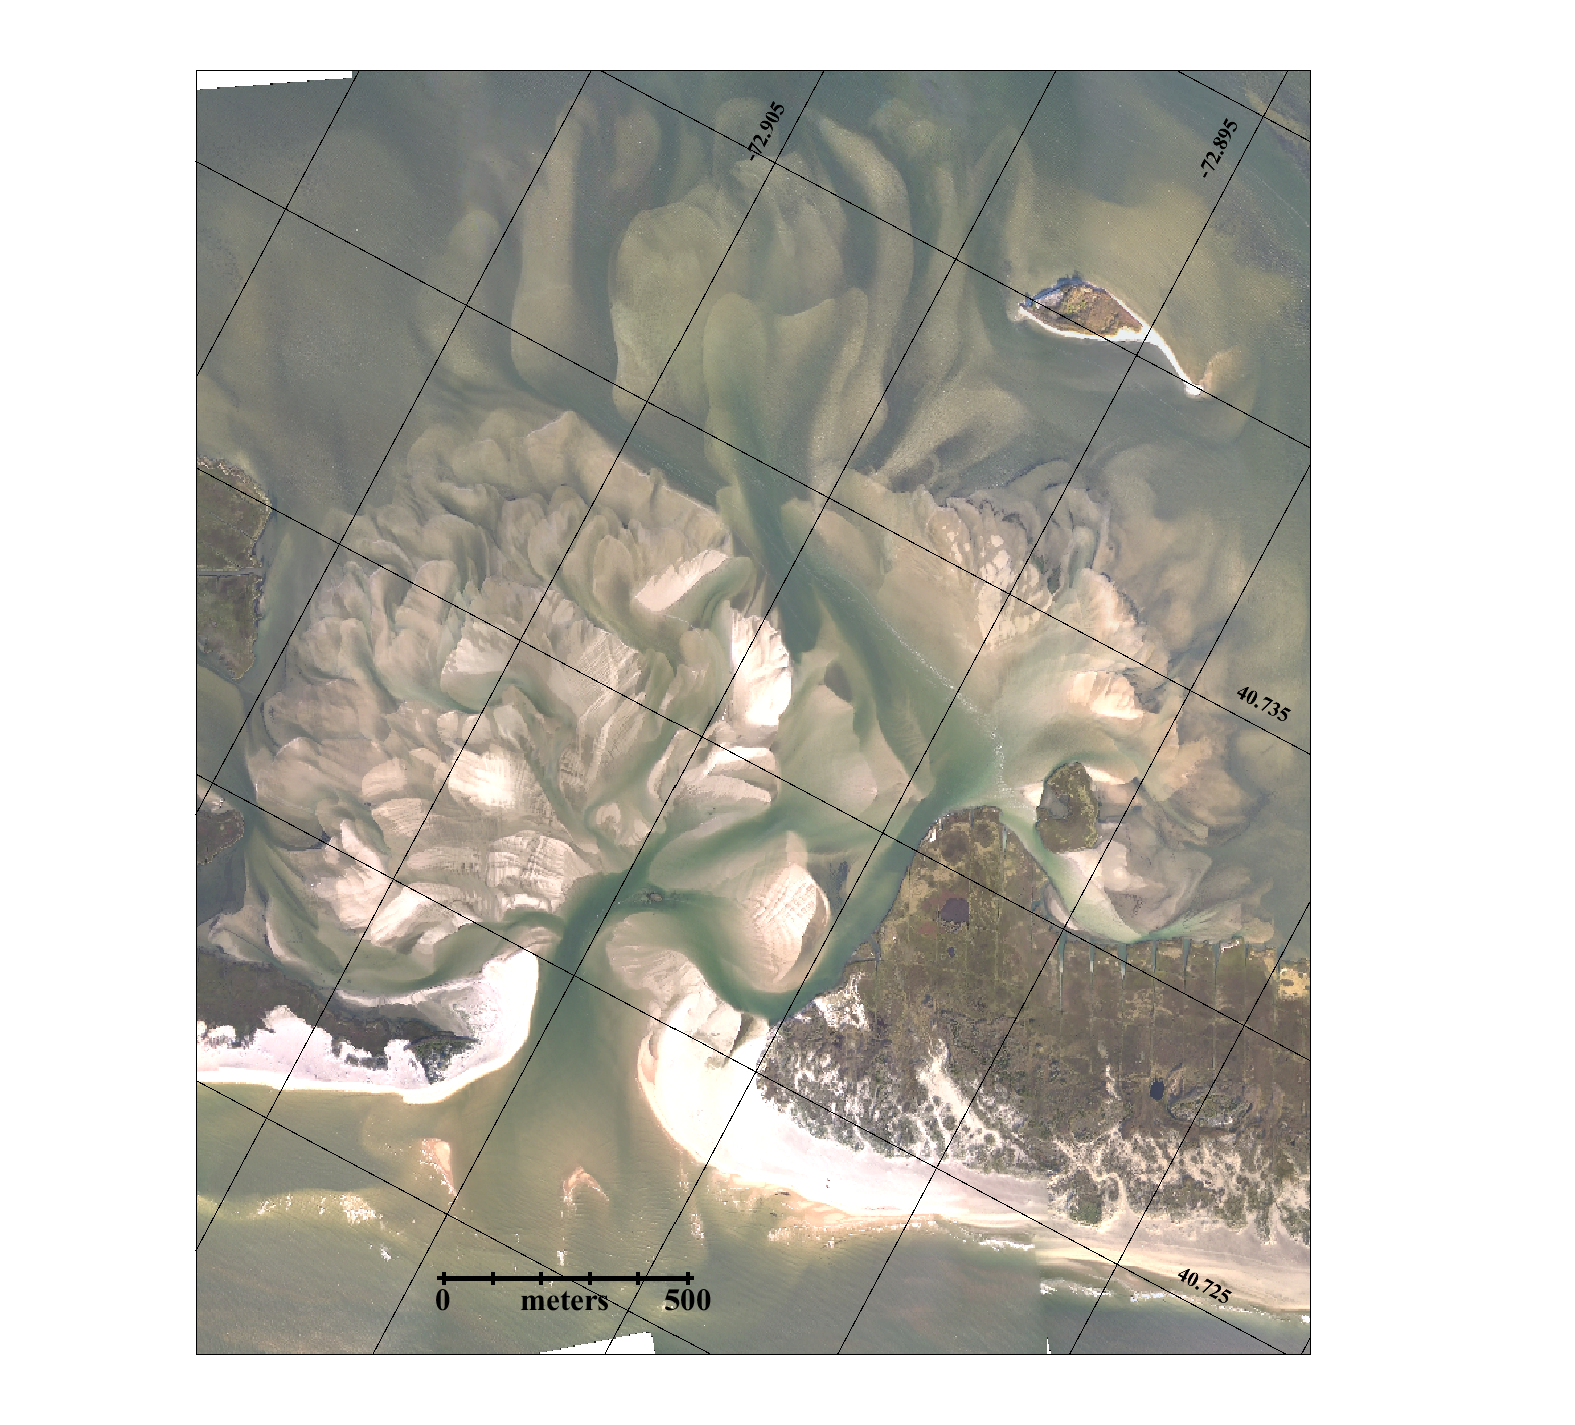
Nov 20,
2012 (RW&RG)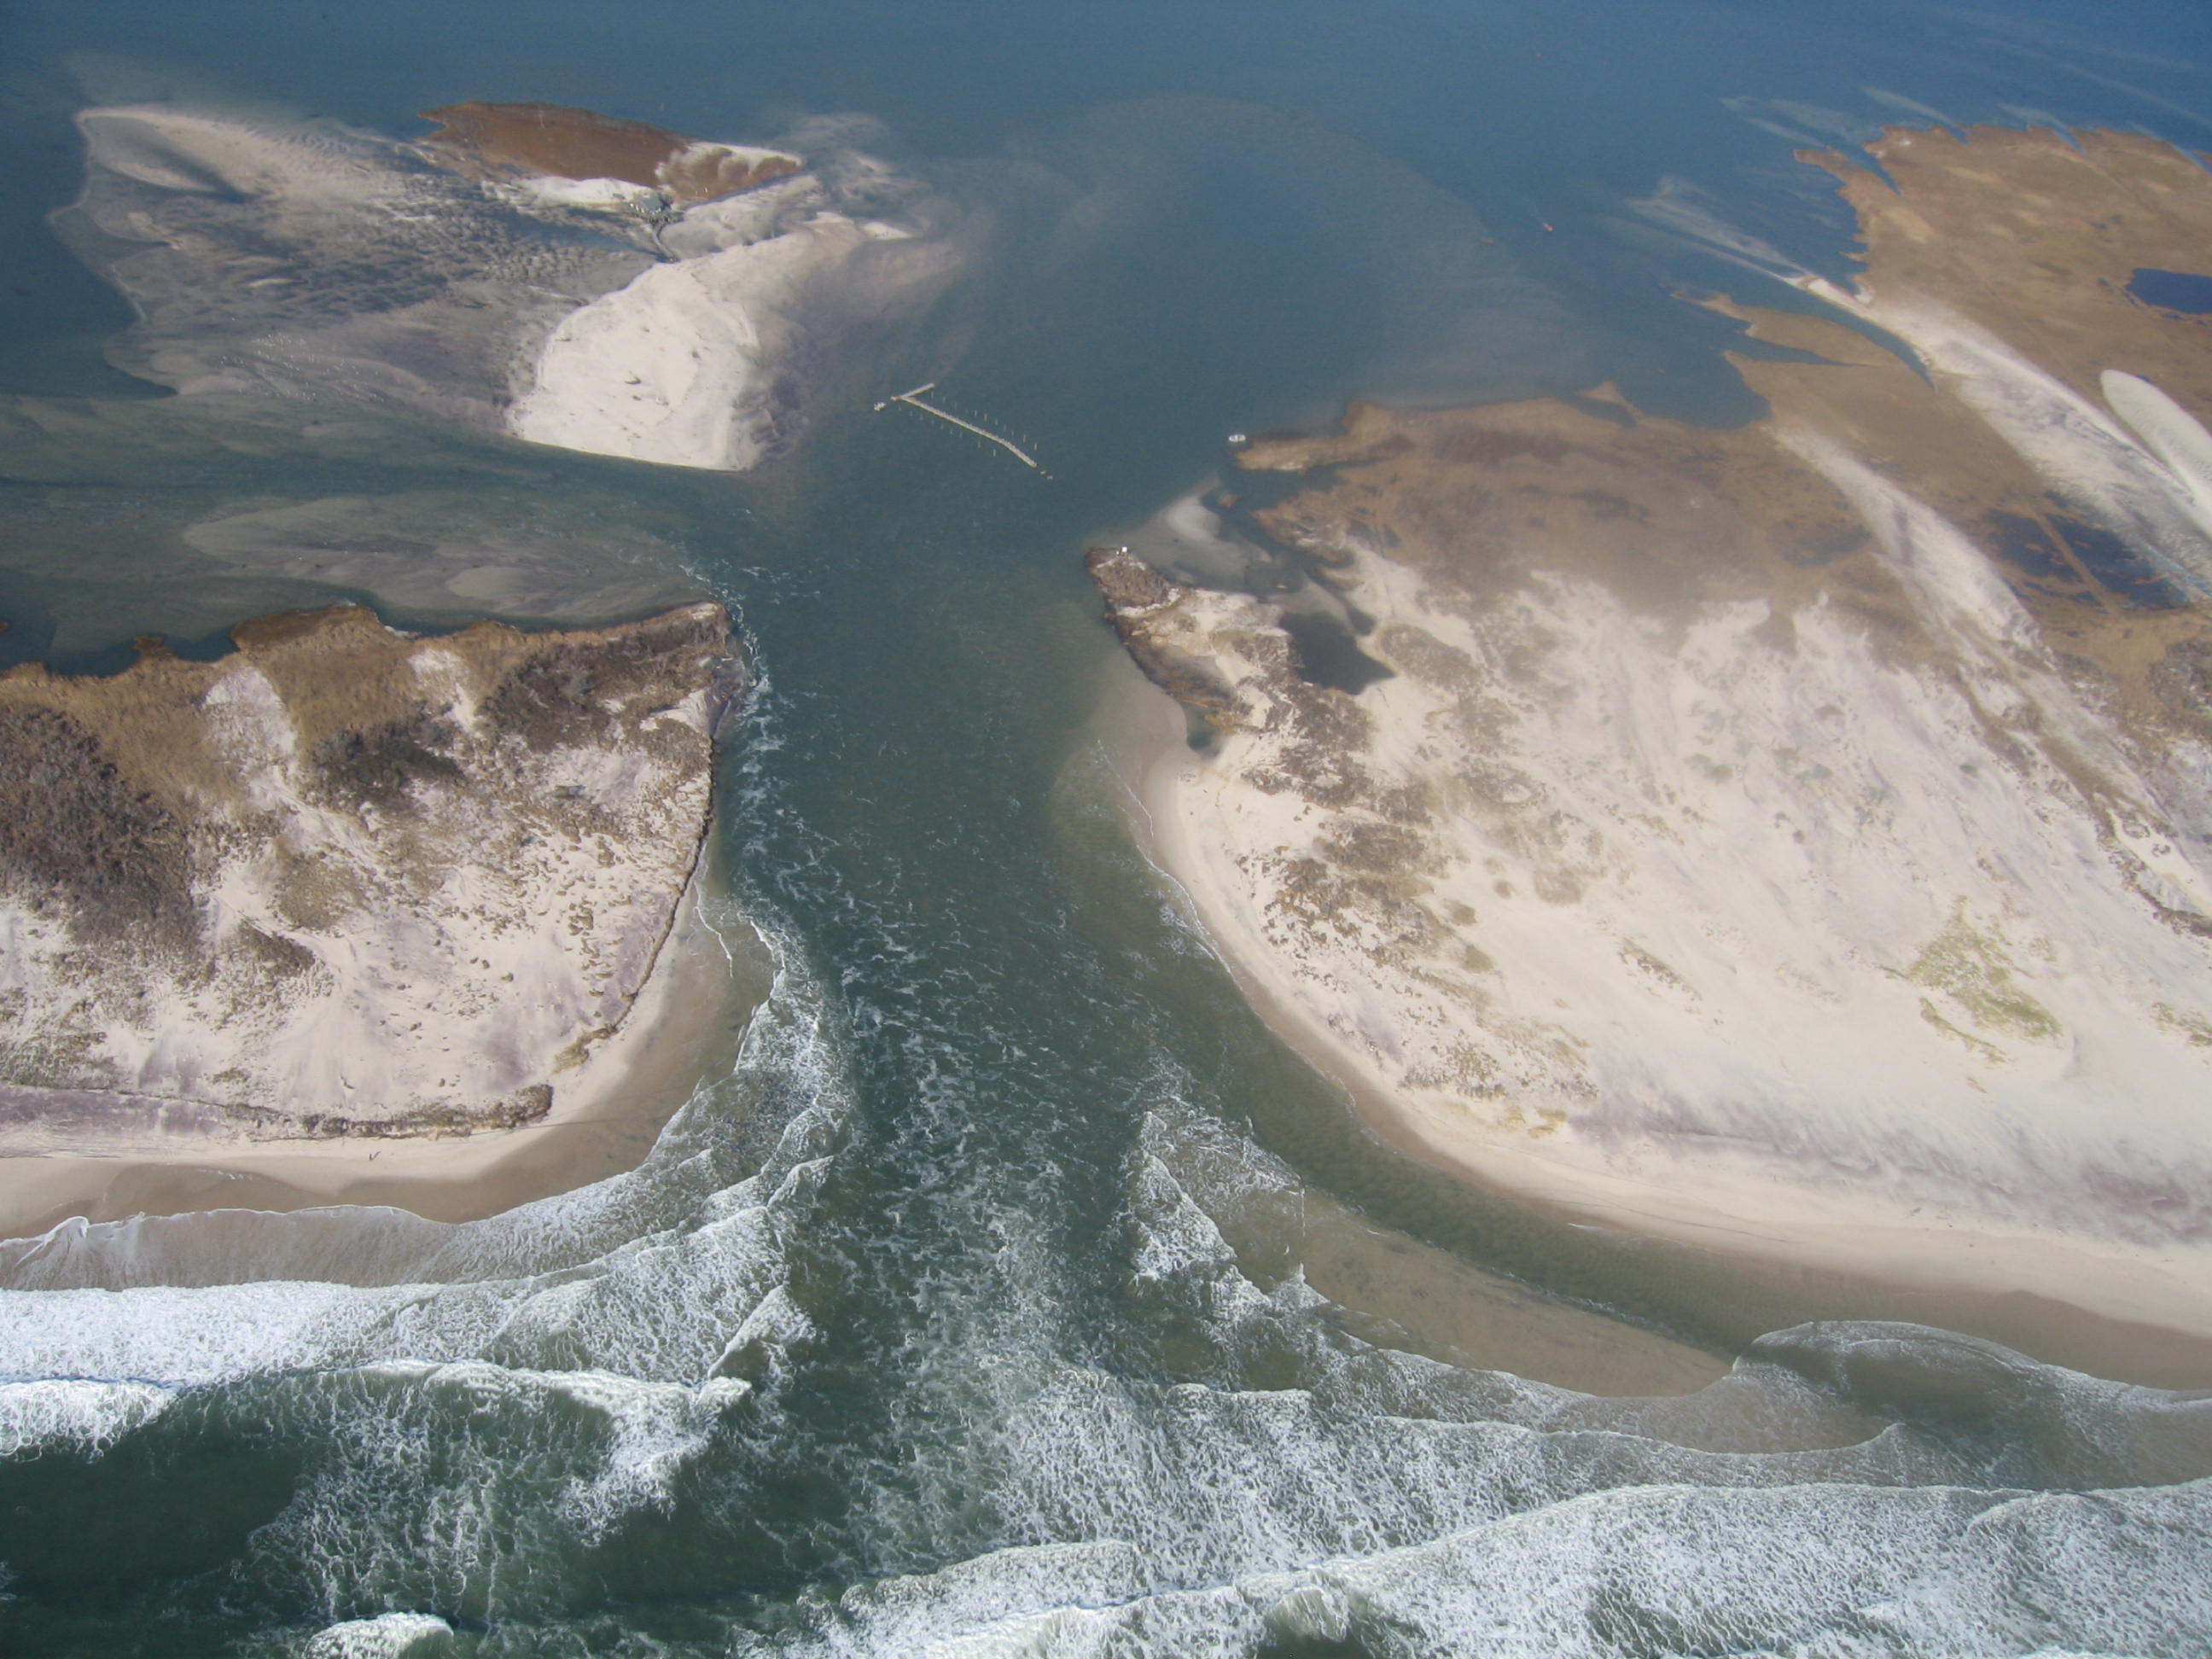 |
||||
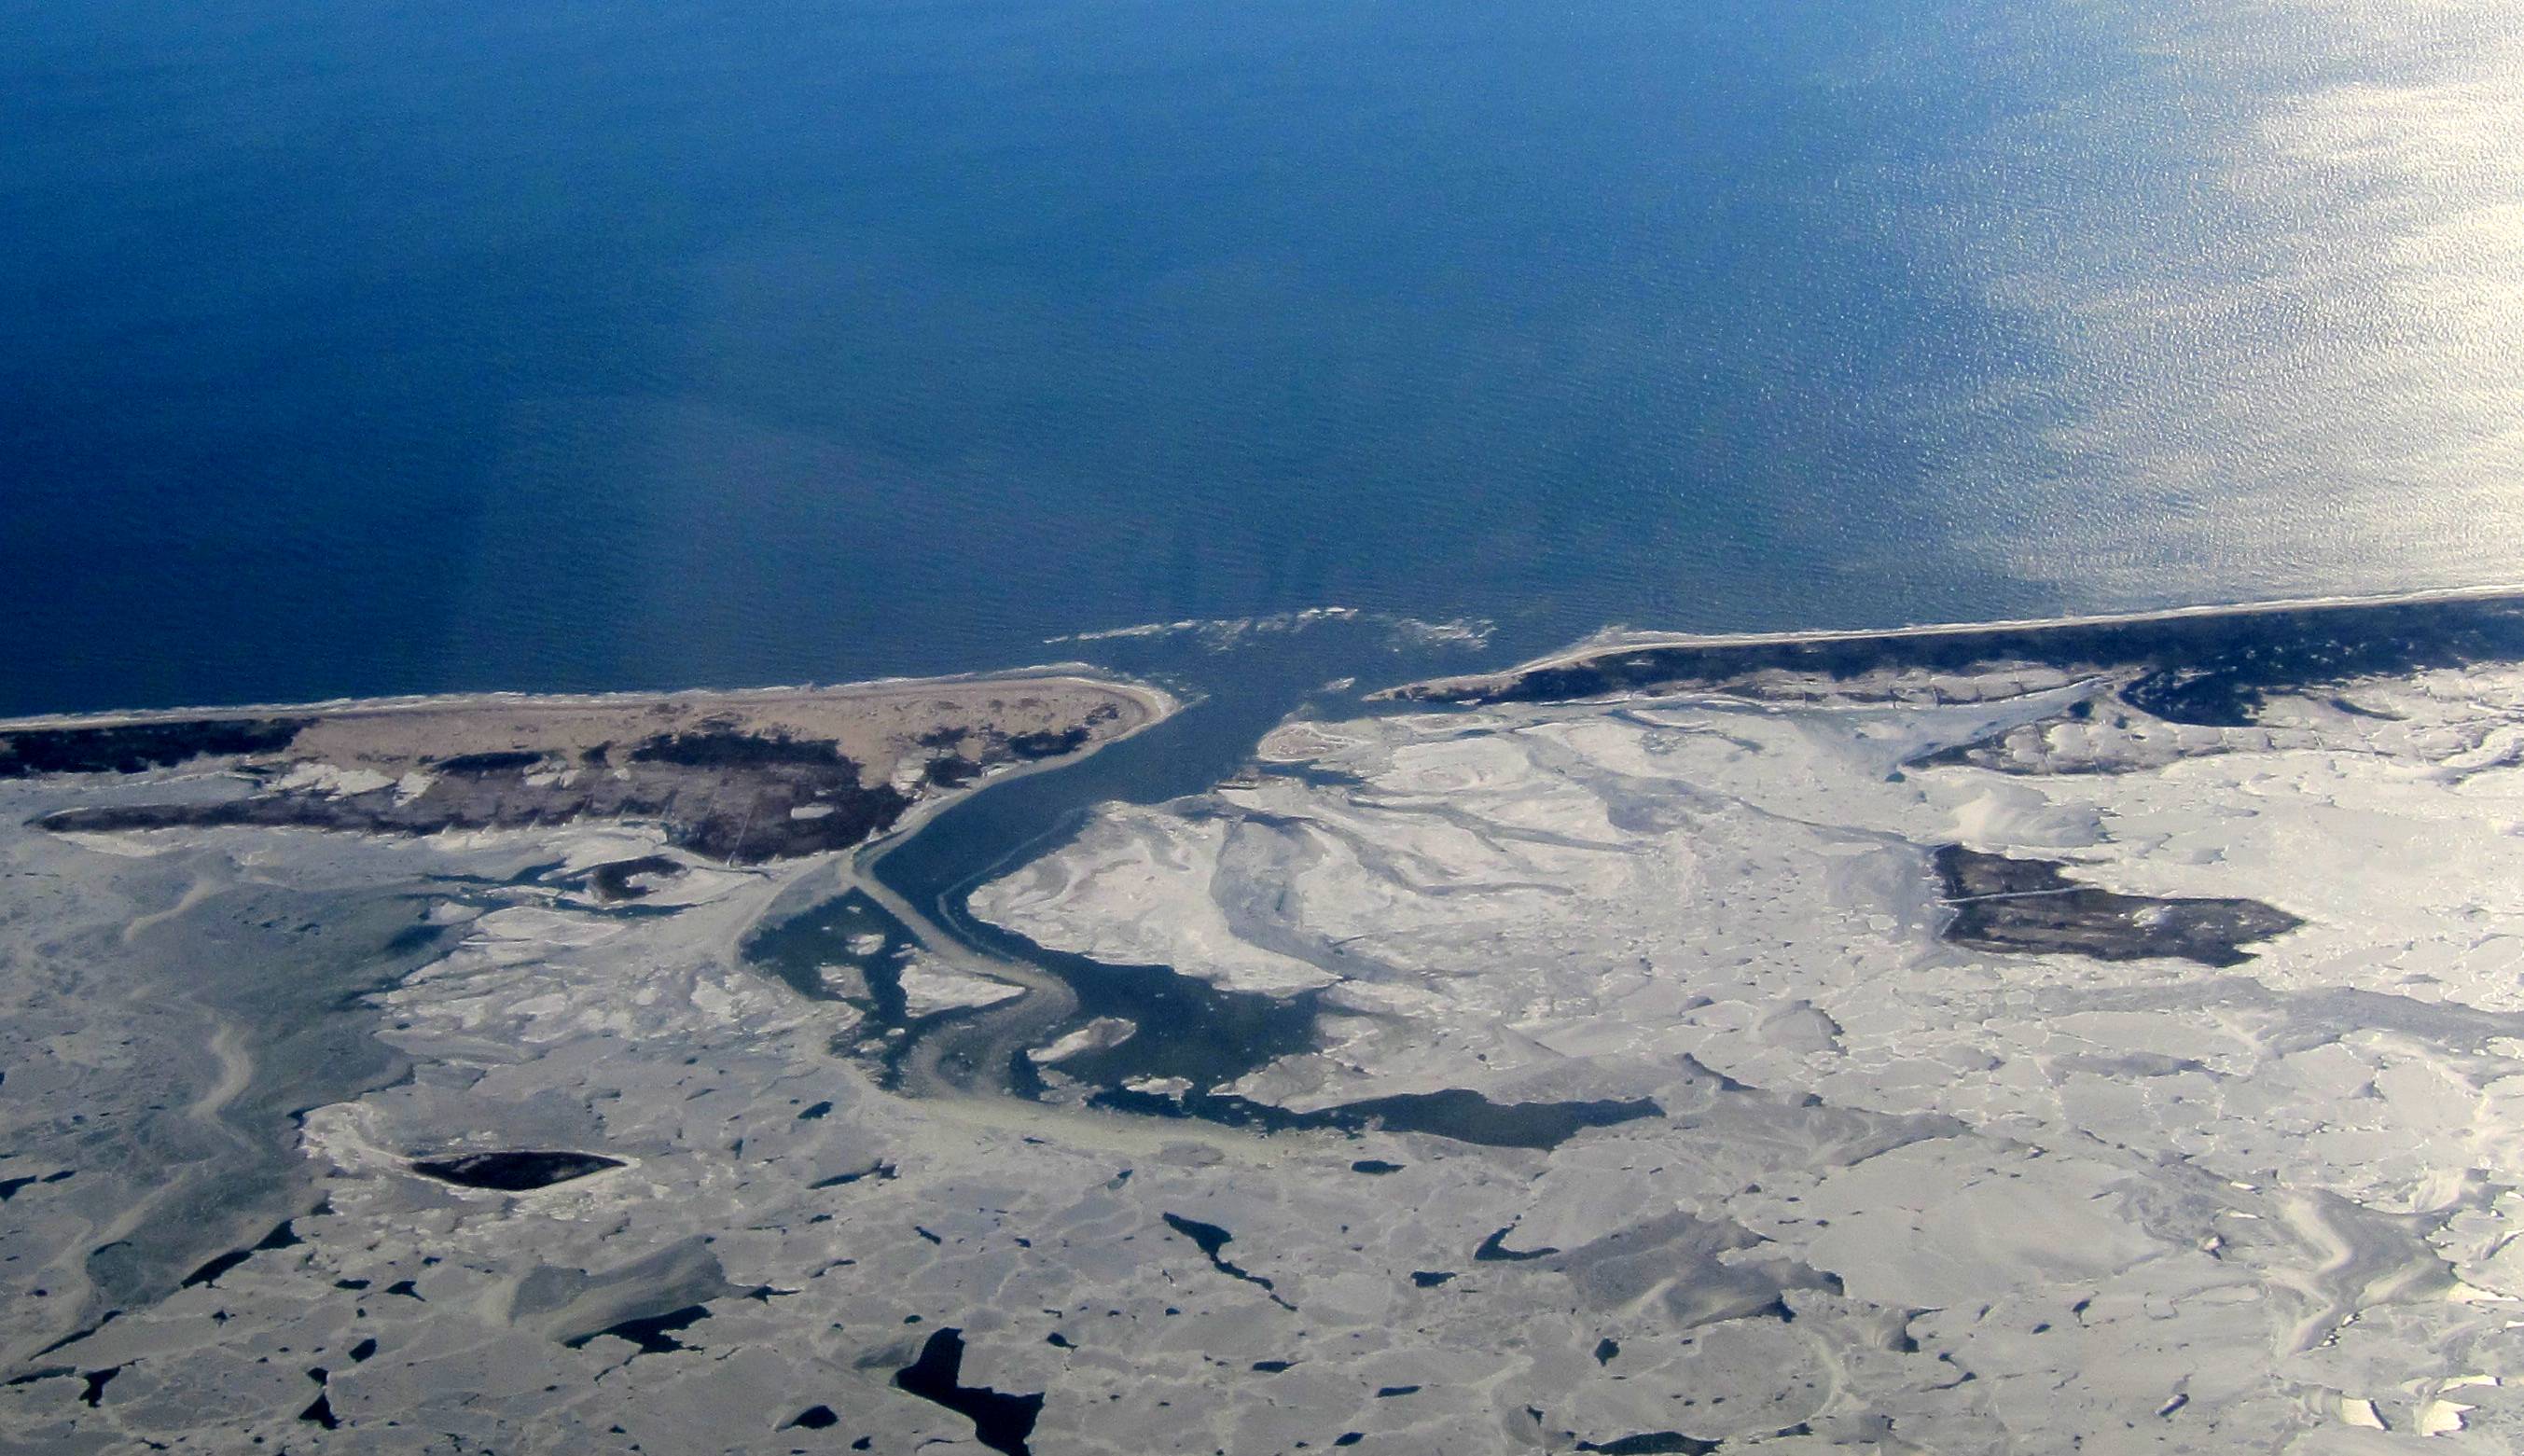
Dec 20,
2012 (MF&RG)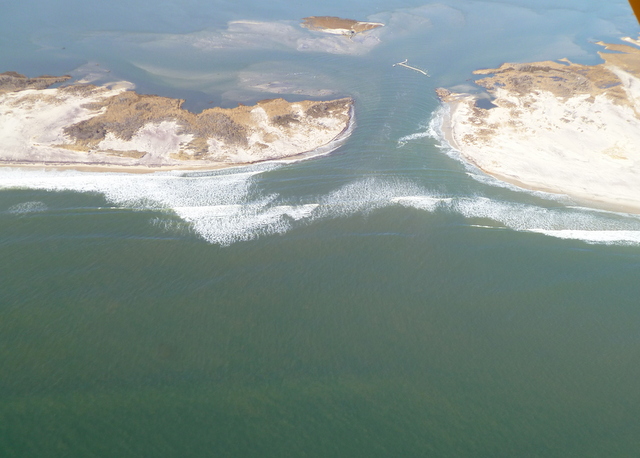 |
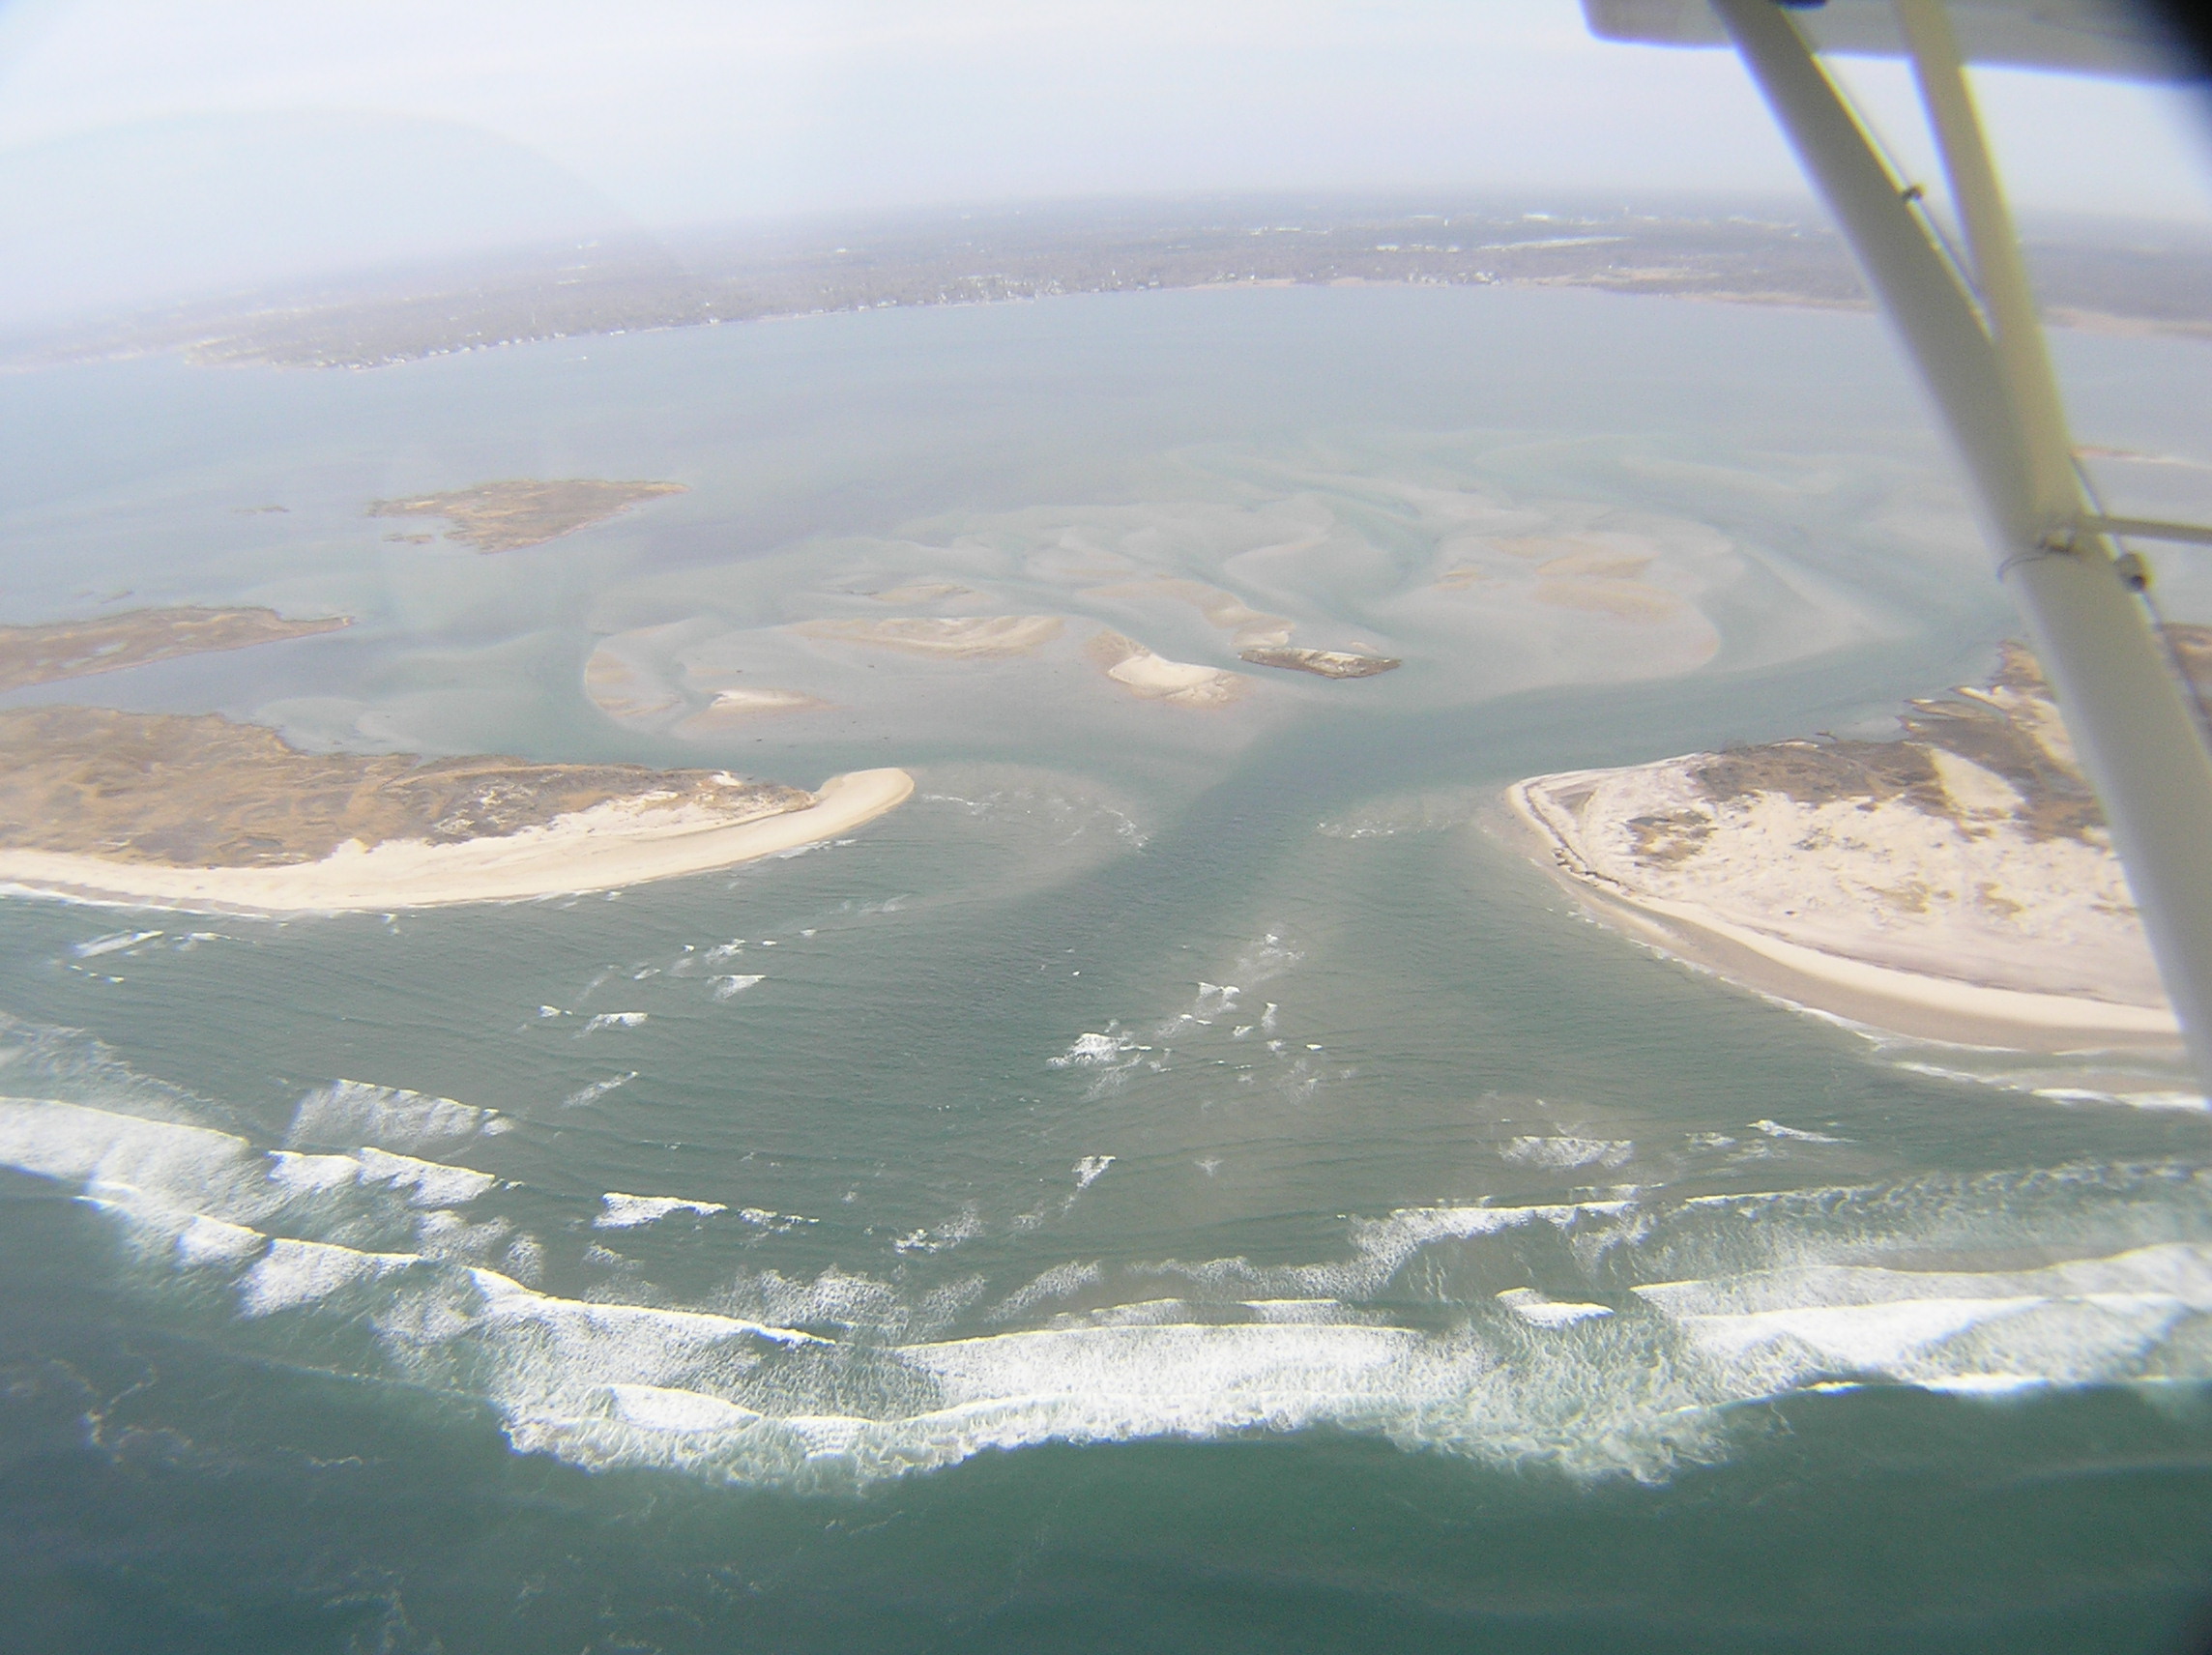
Jan 6,
2013 (JF&CF)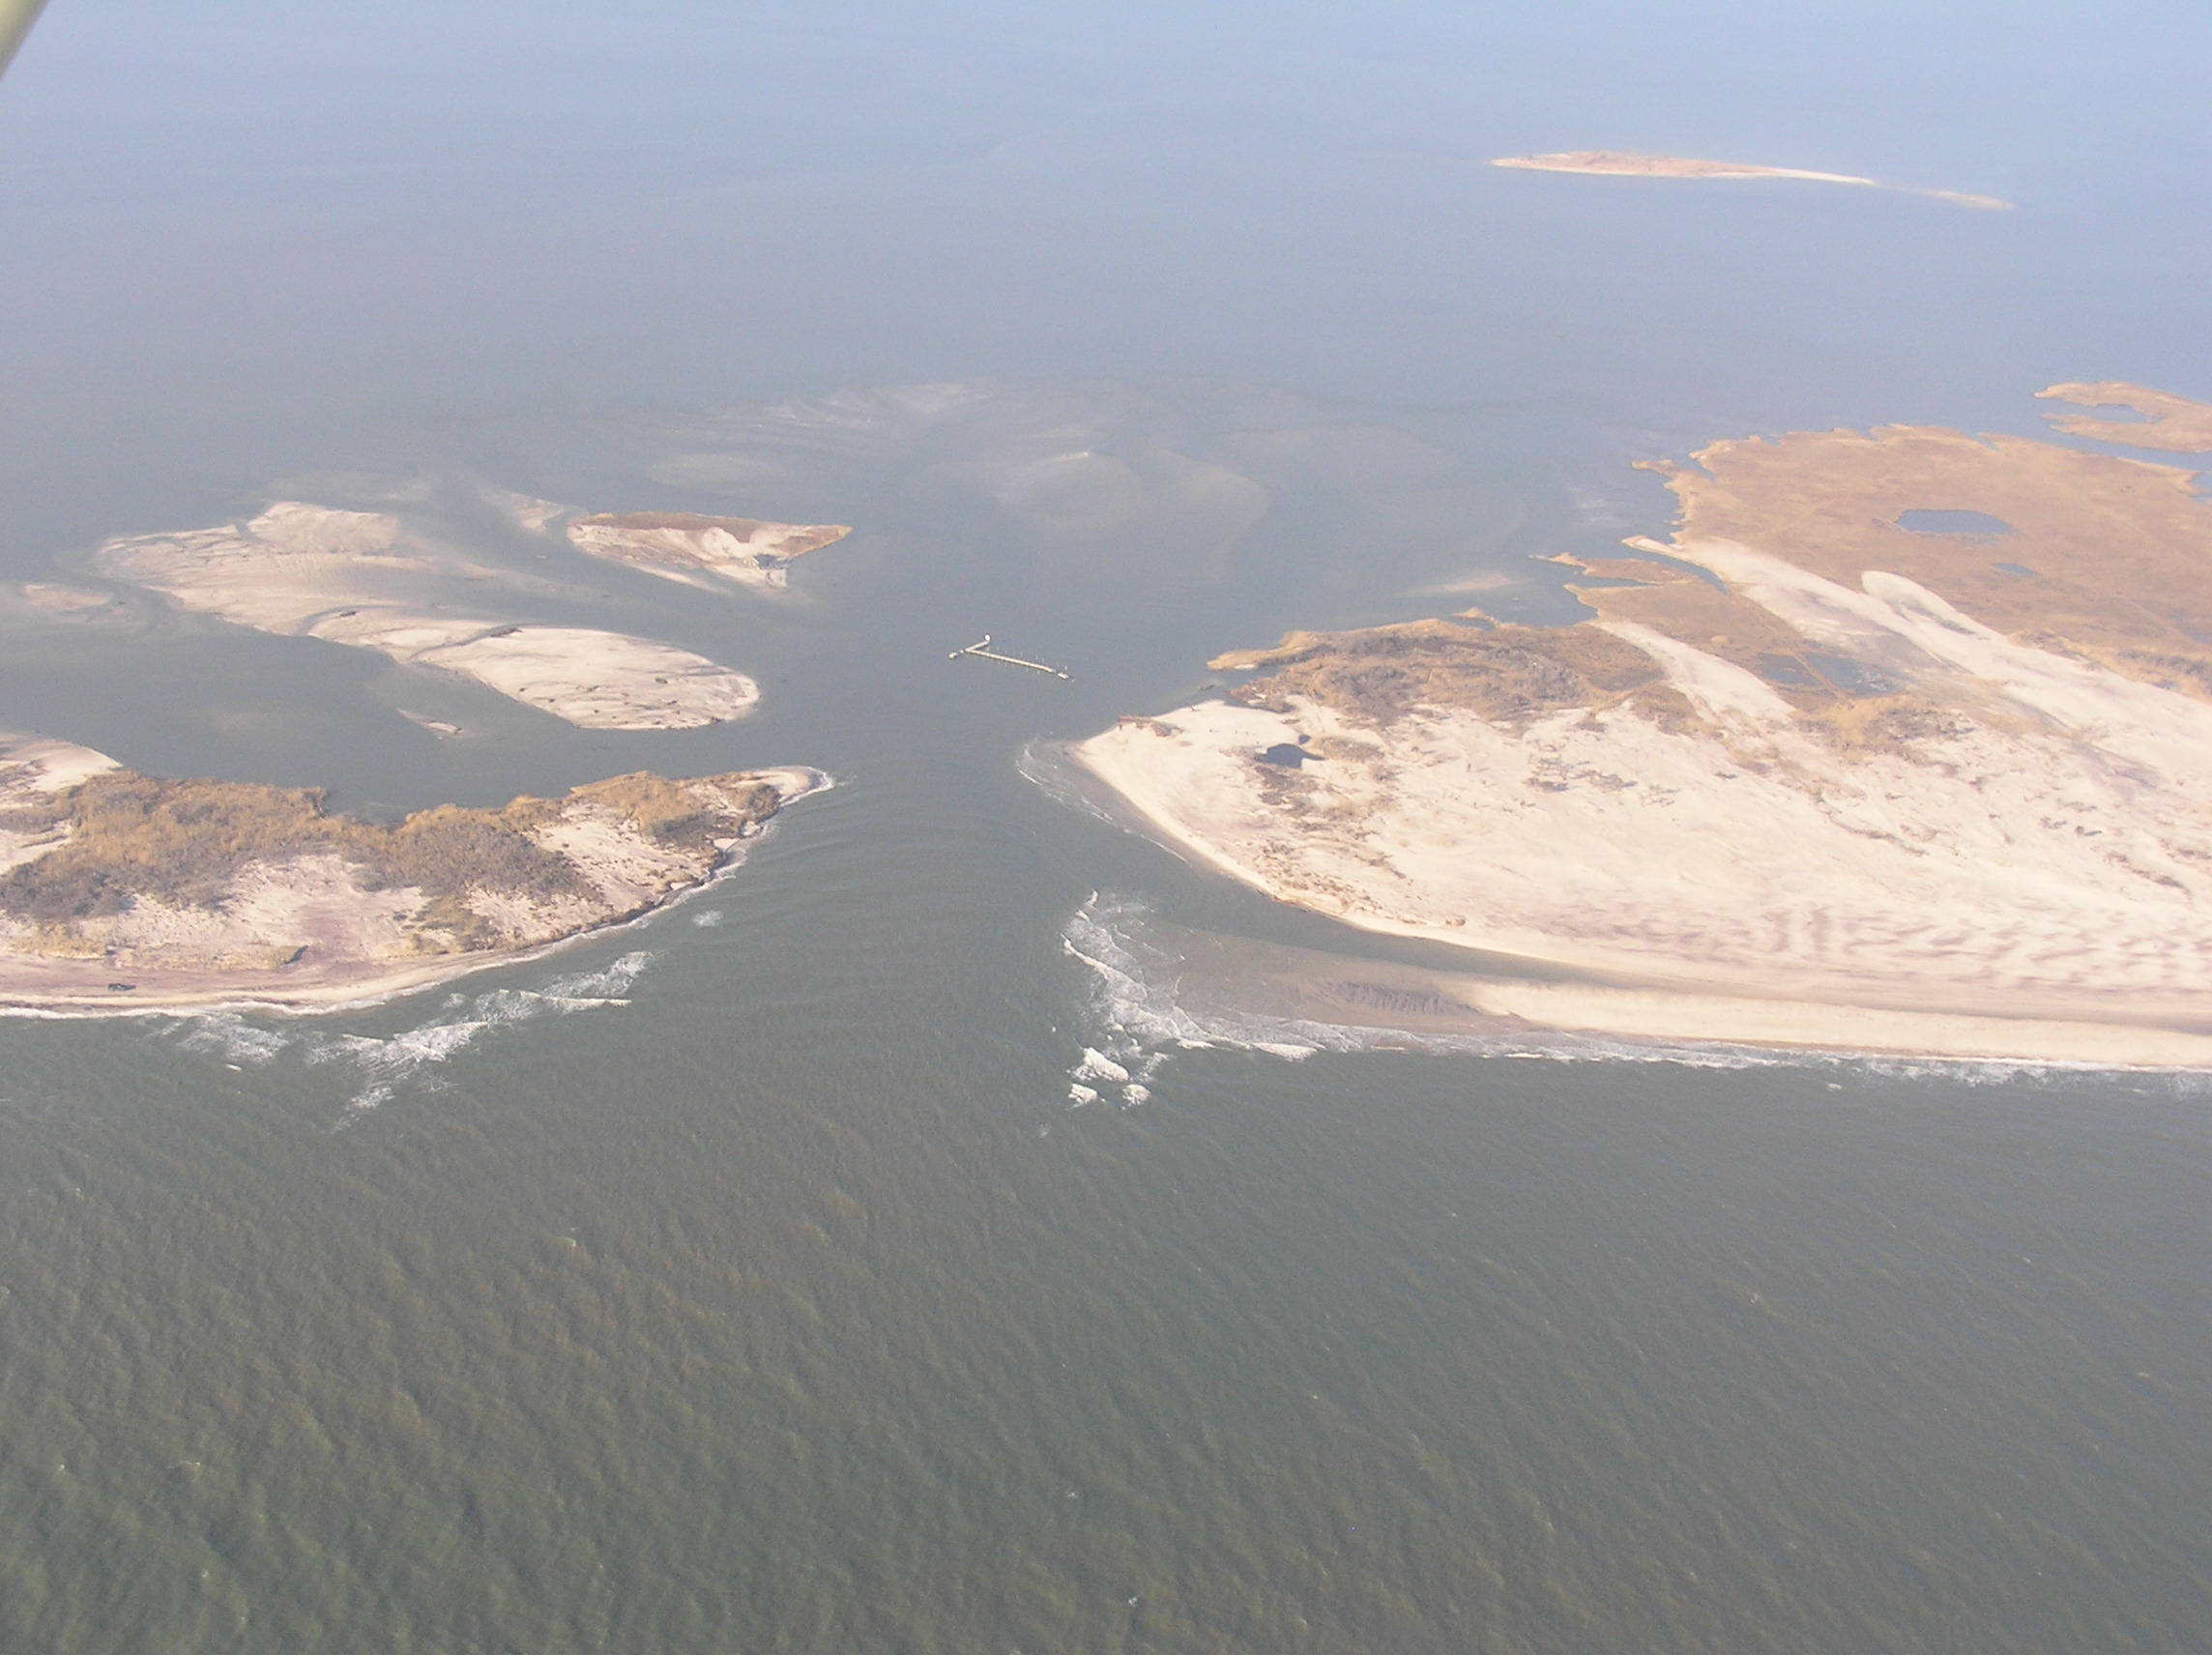 |
Jan 27,
2013 (CF&DR)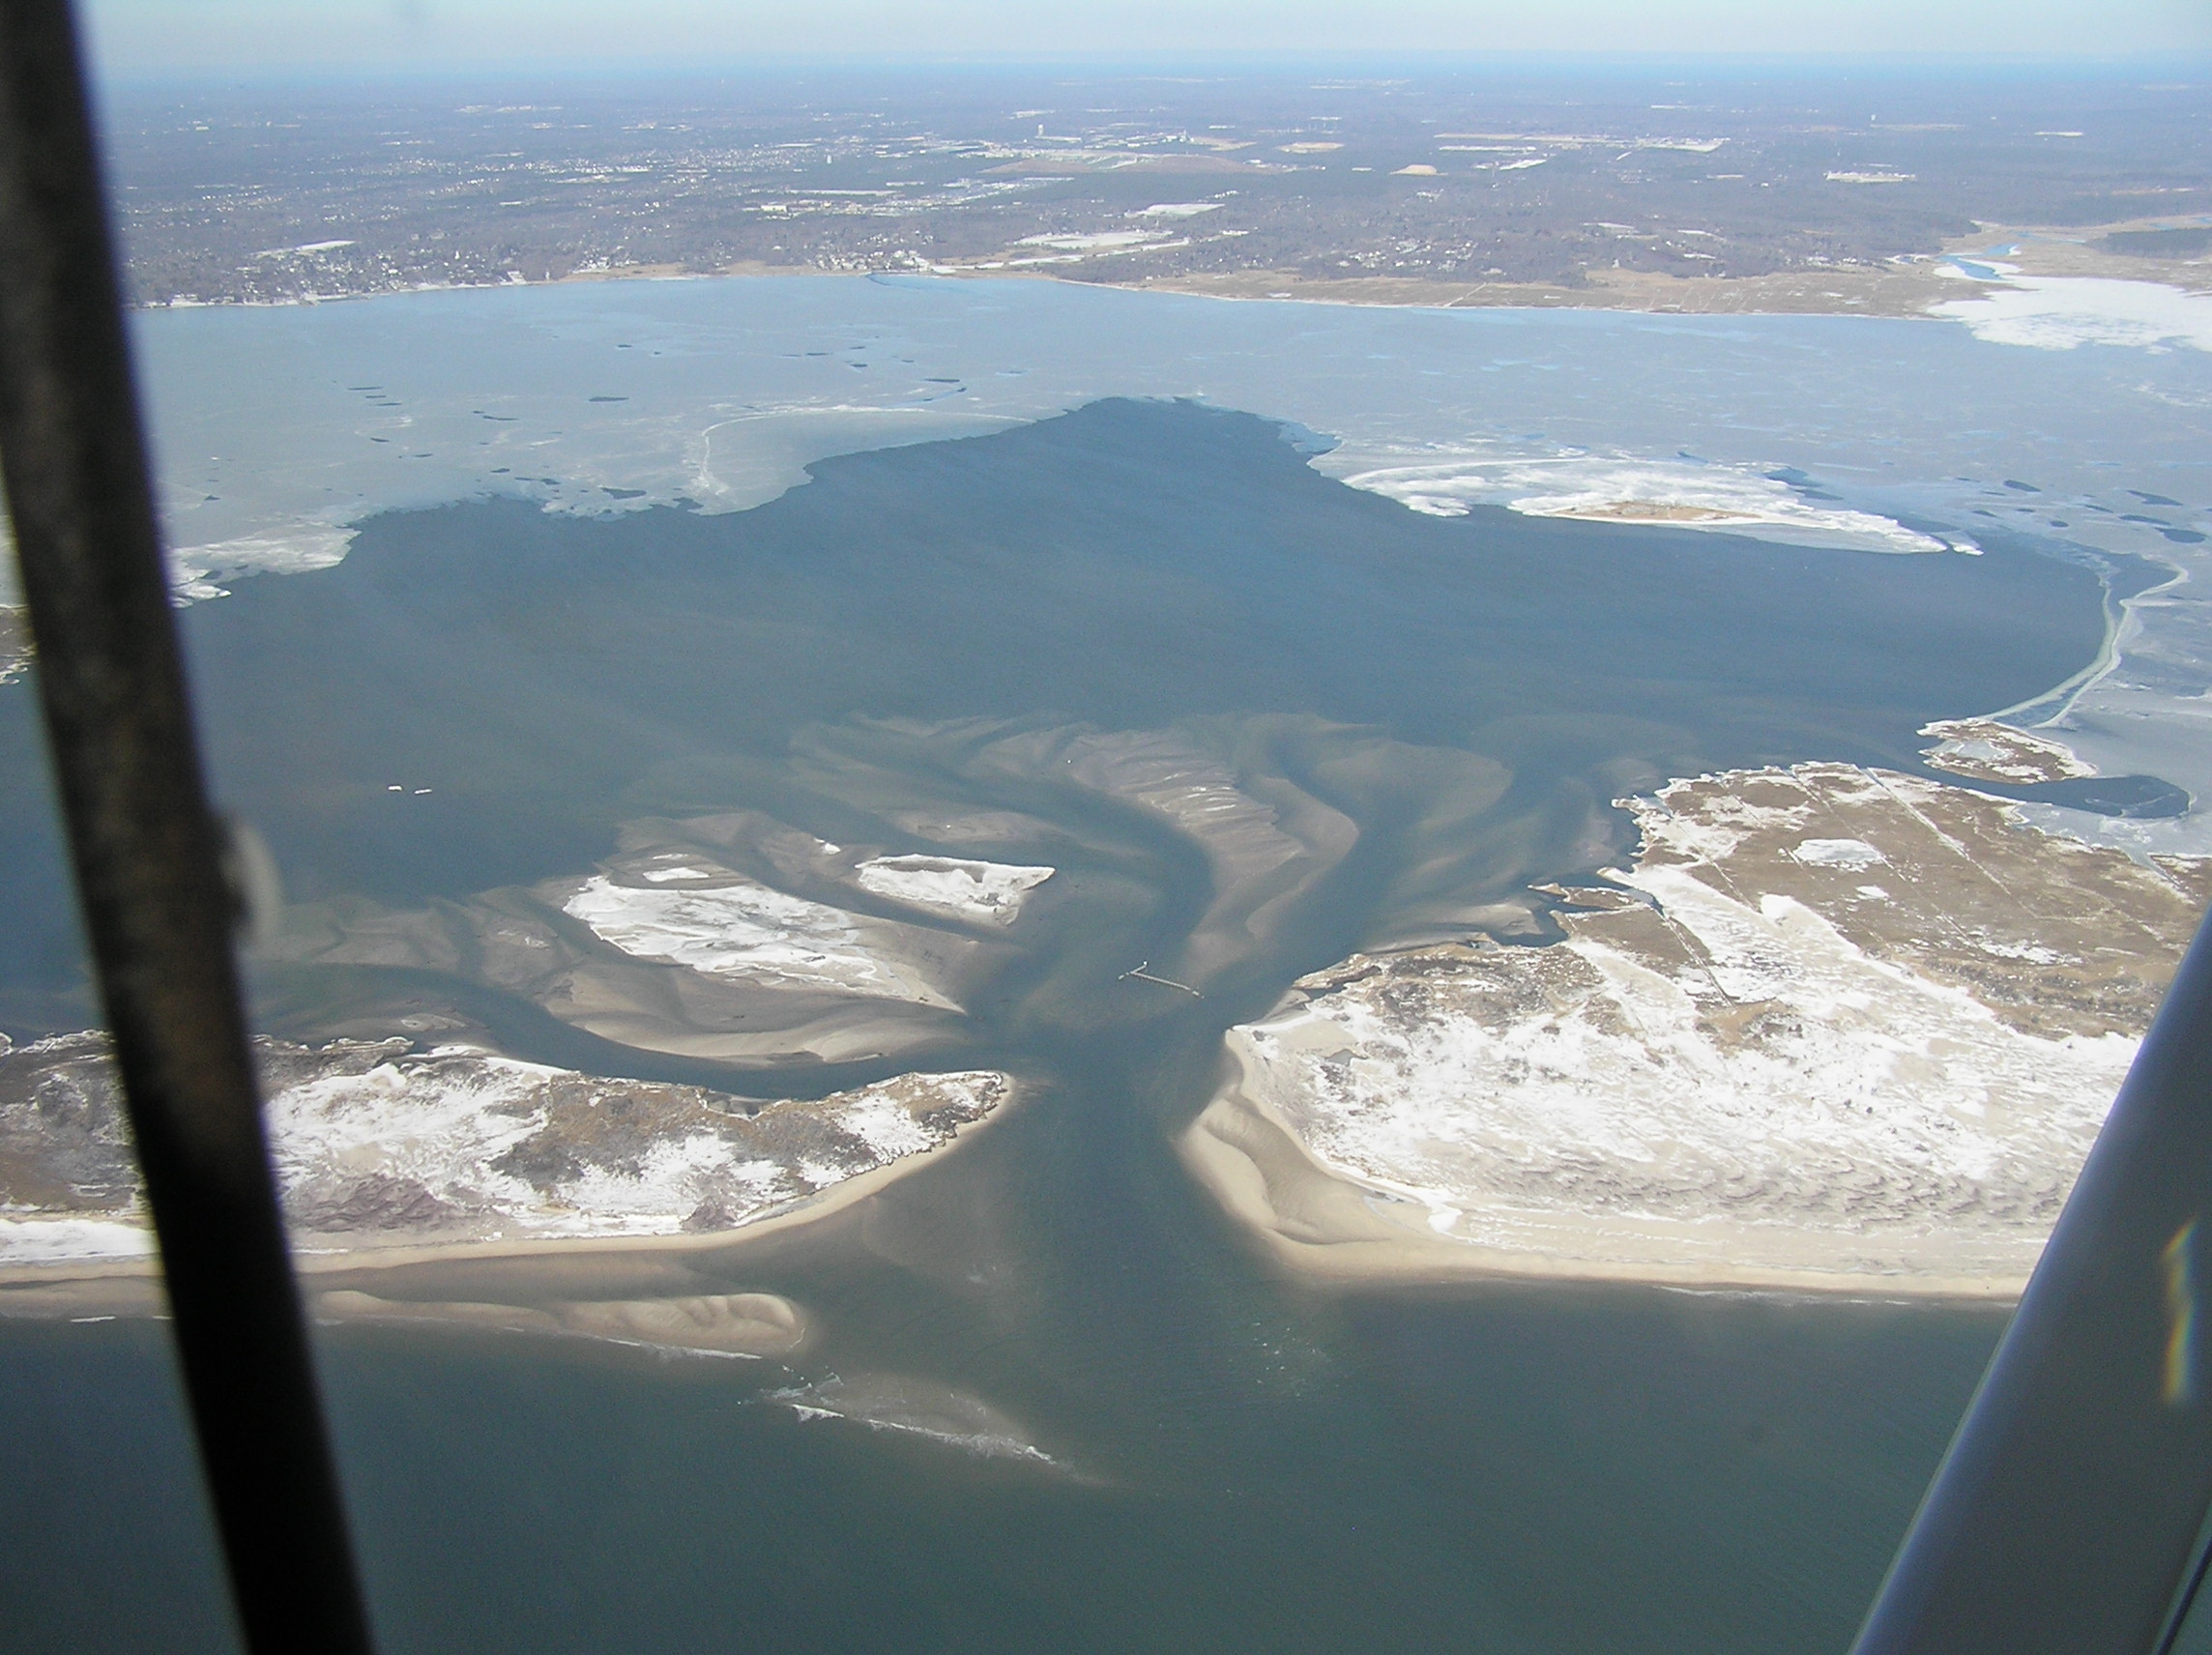 |
Feb 2,
2013 (BW&CF)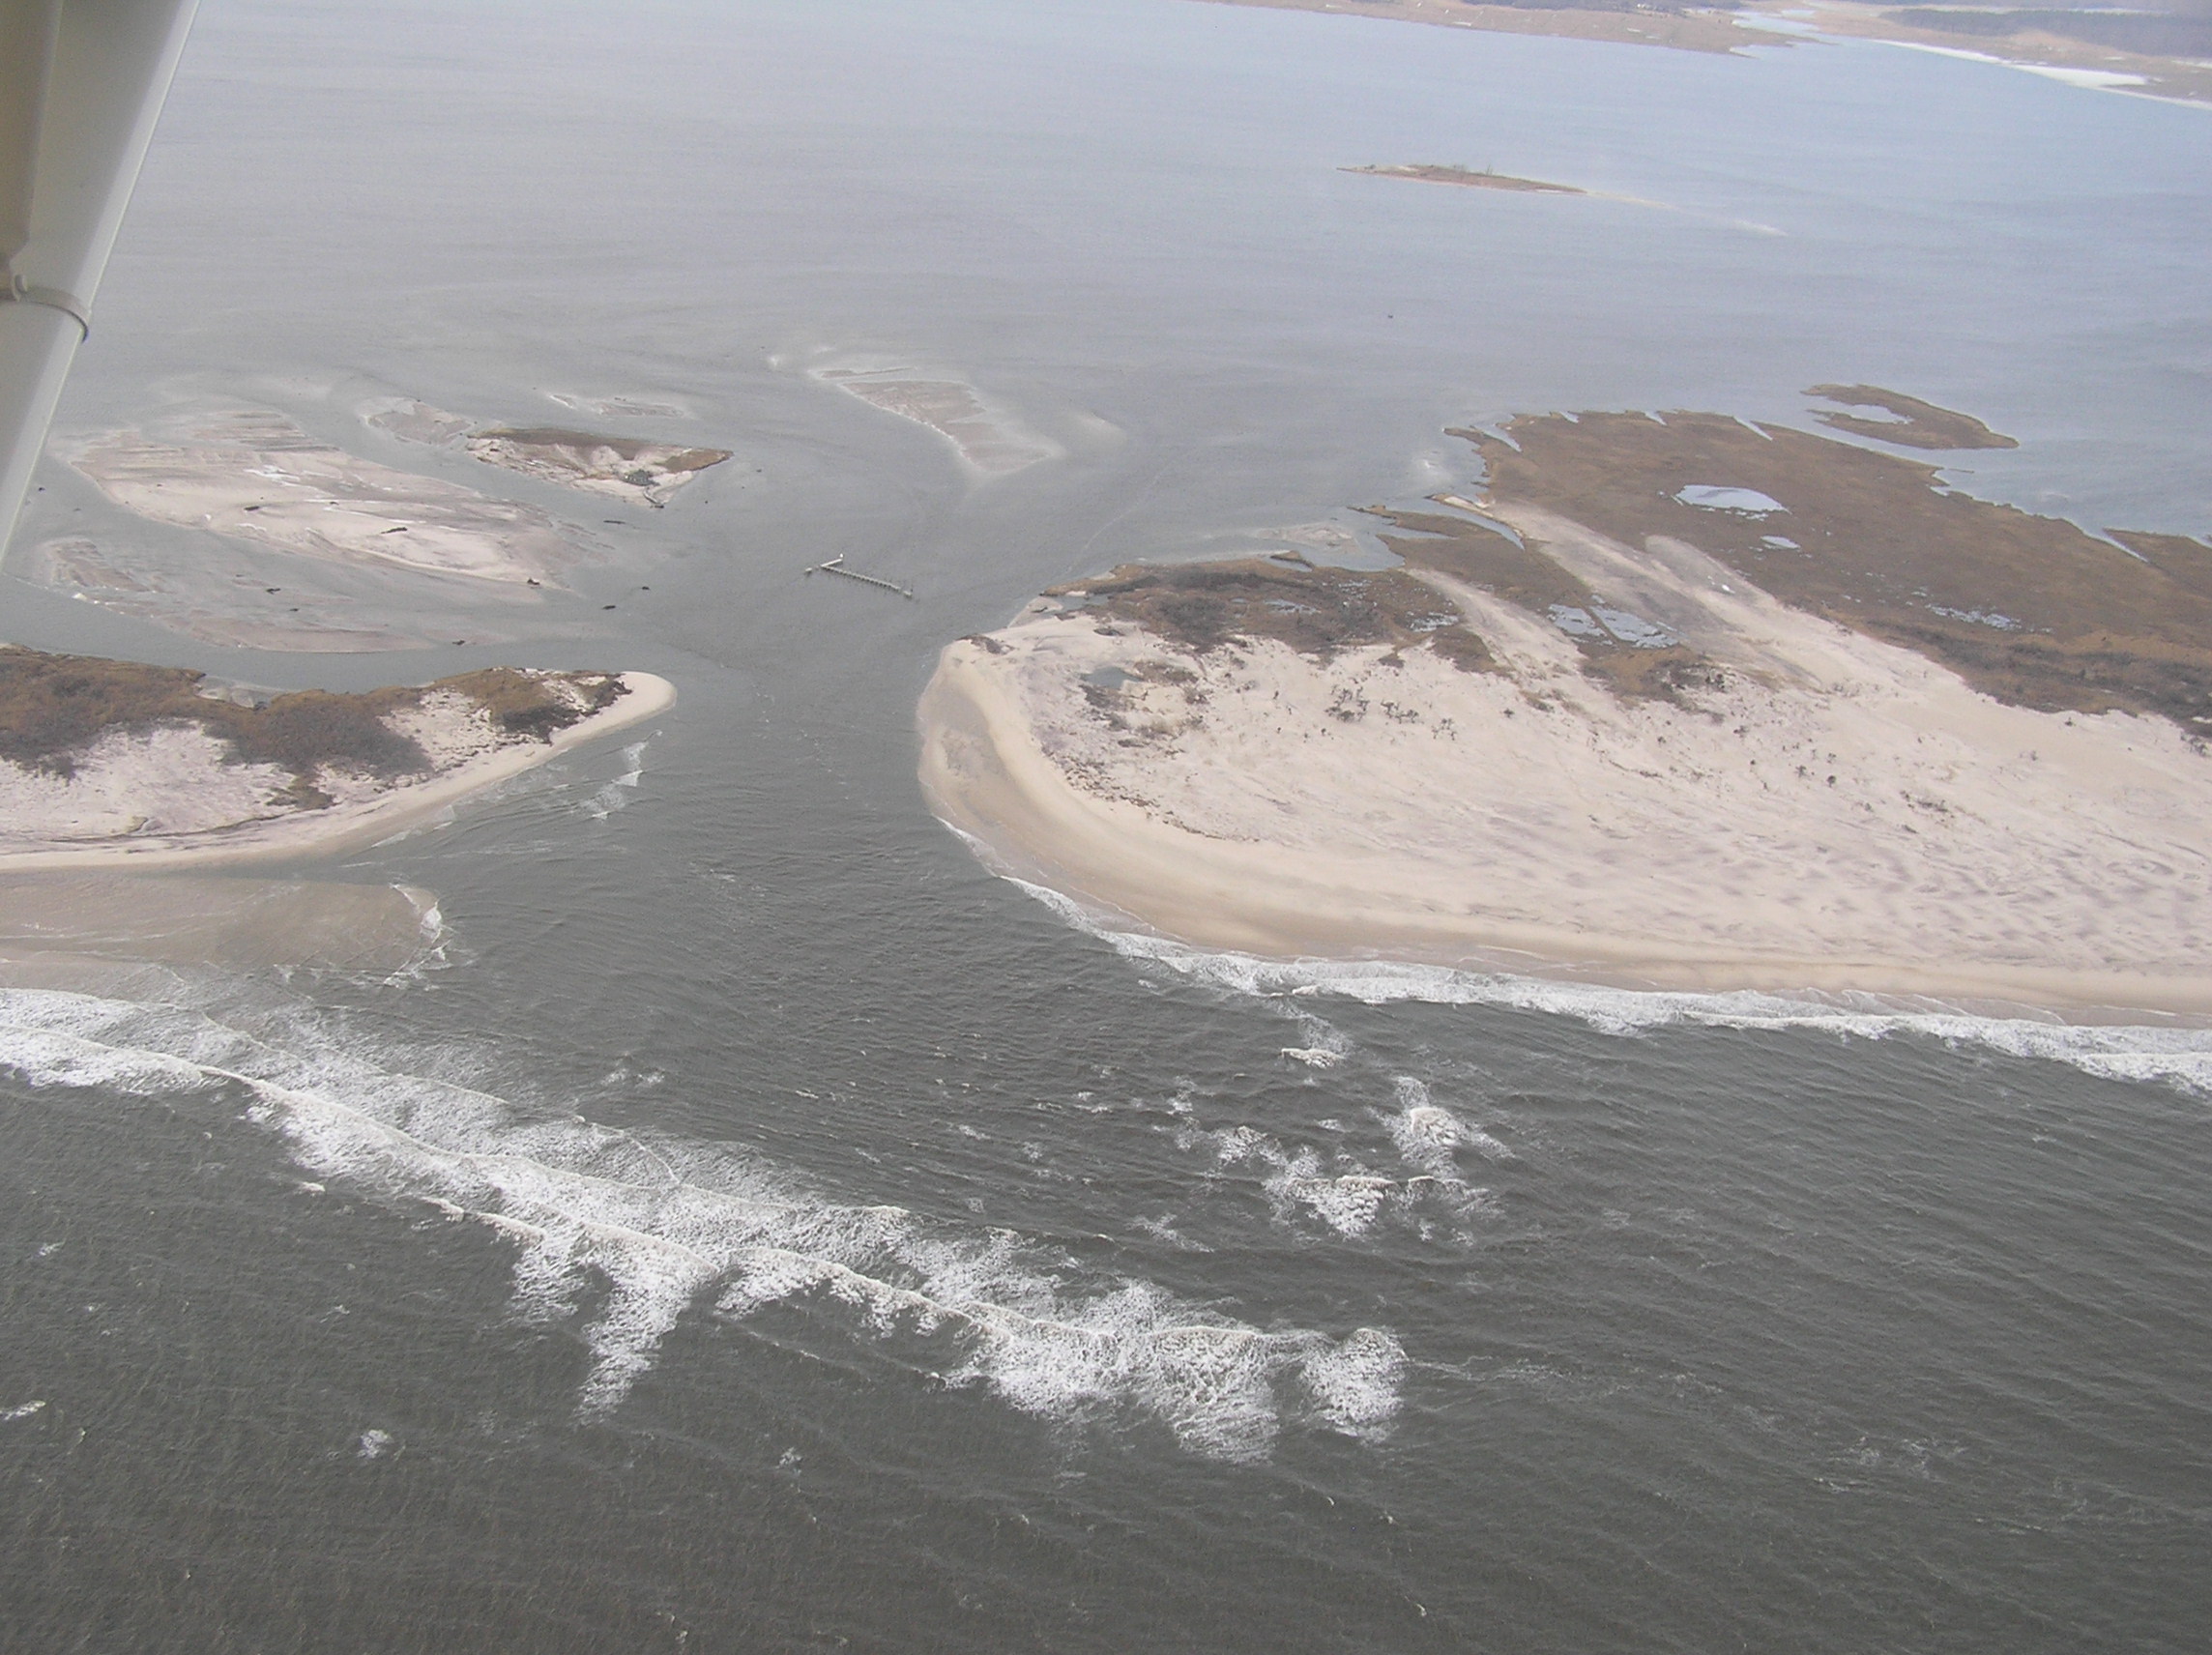 |
||||
Feb 14,
2013 (CF&RG)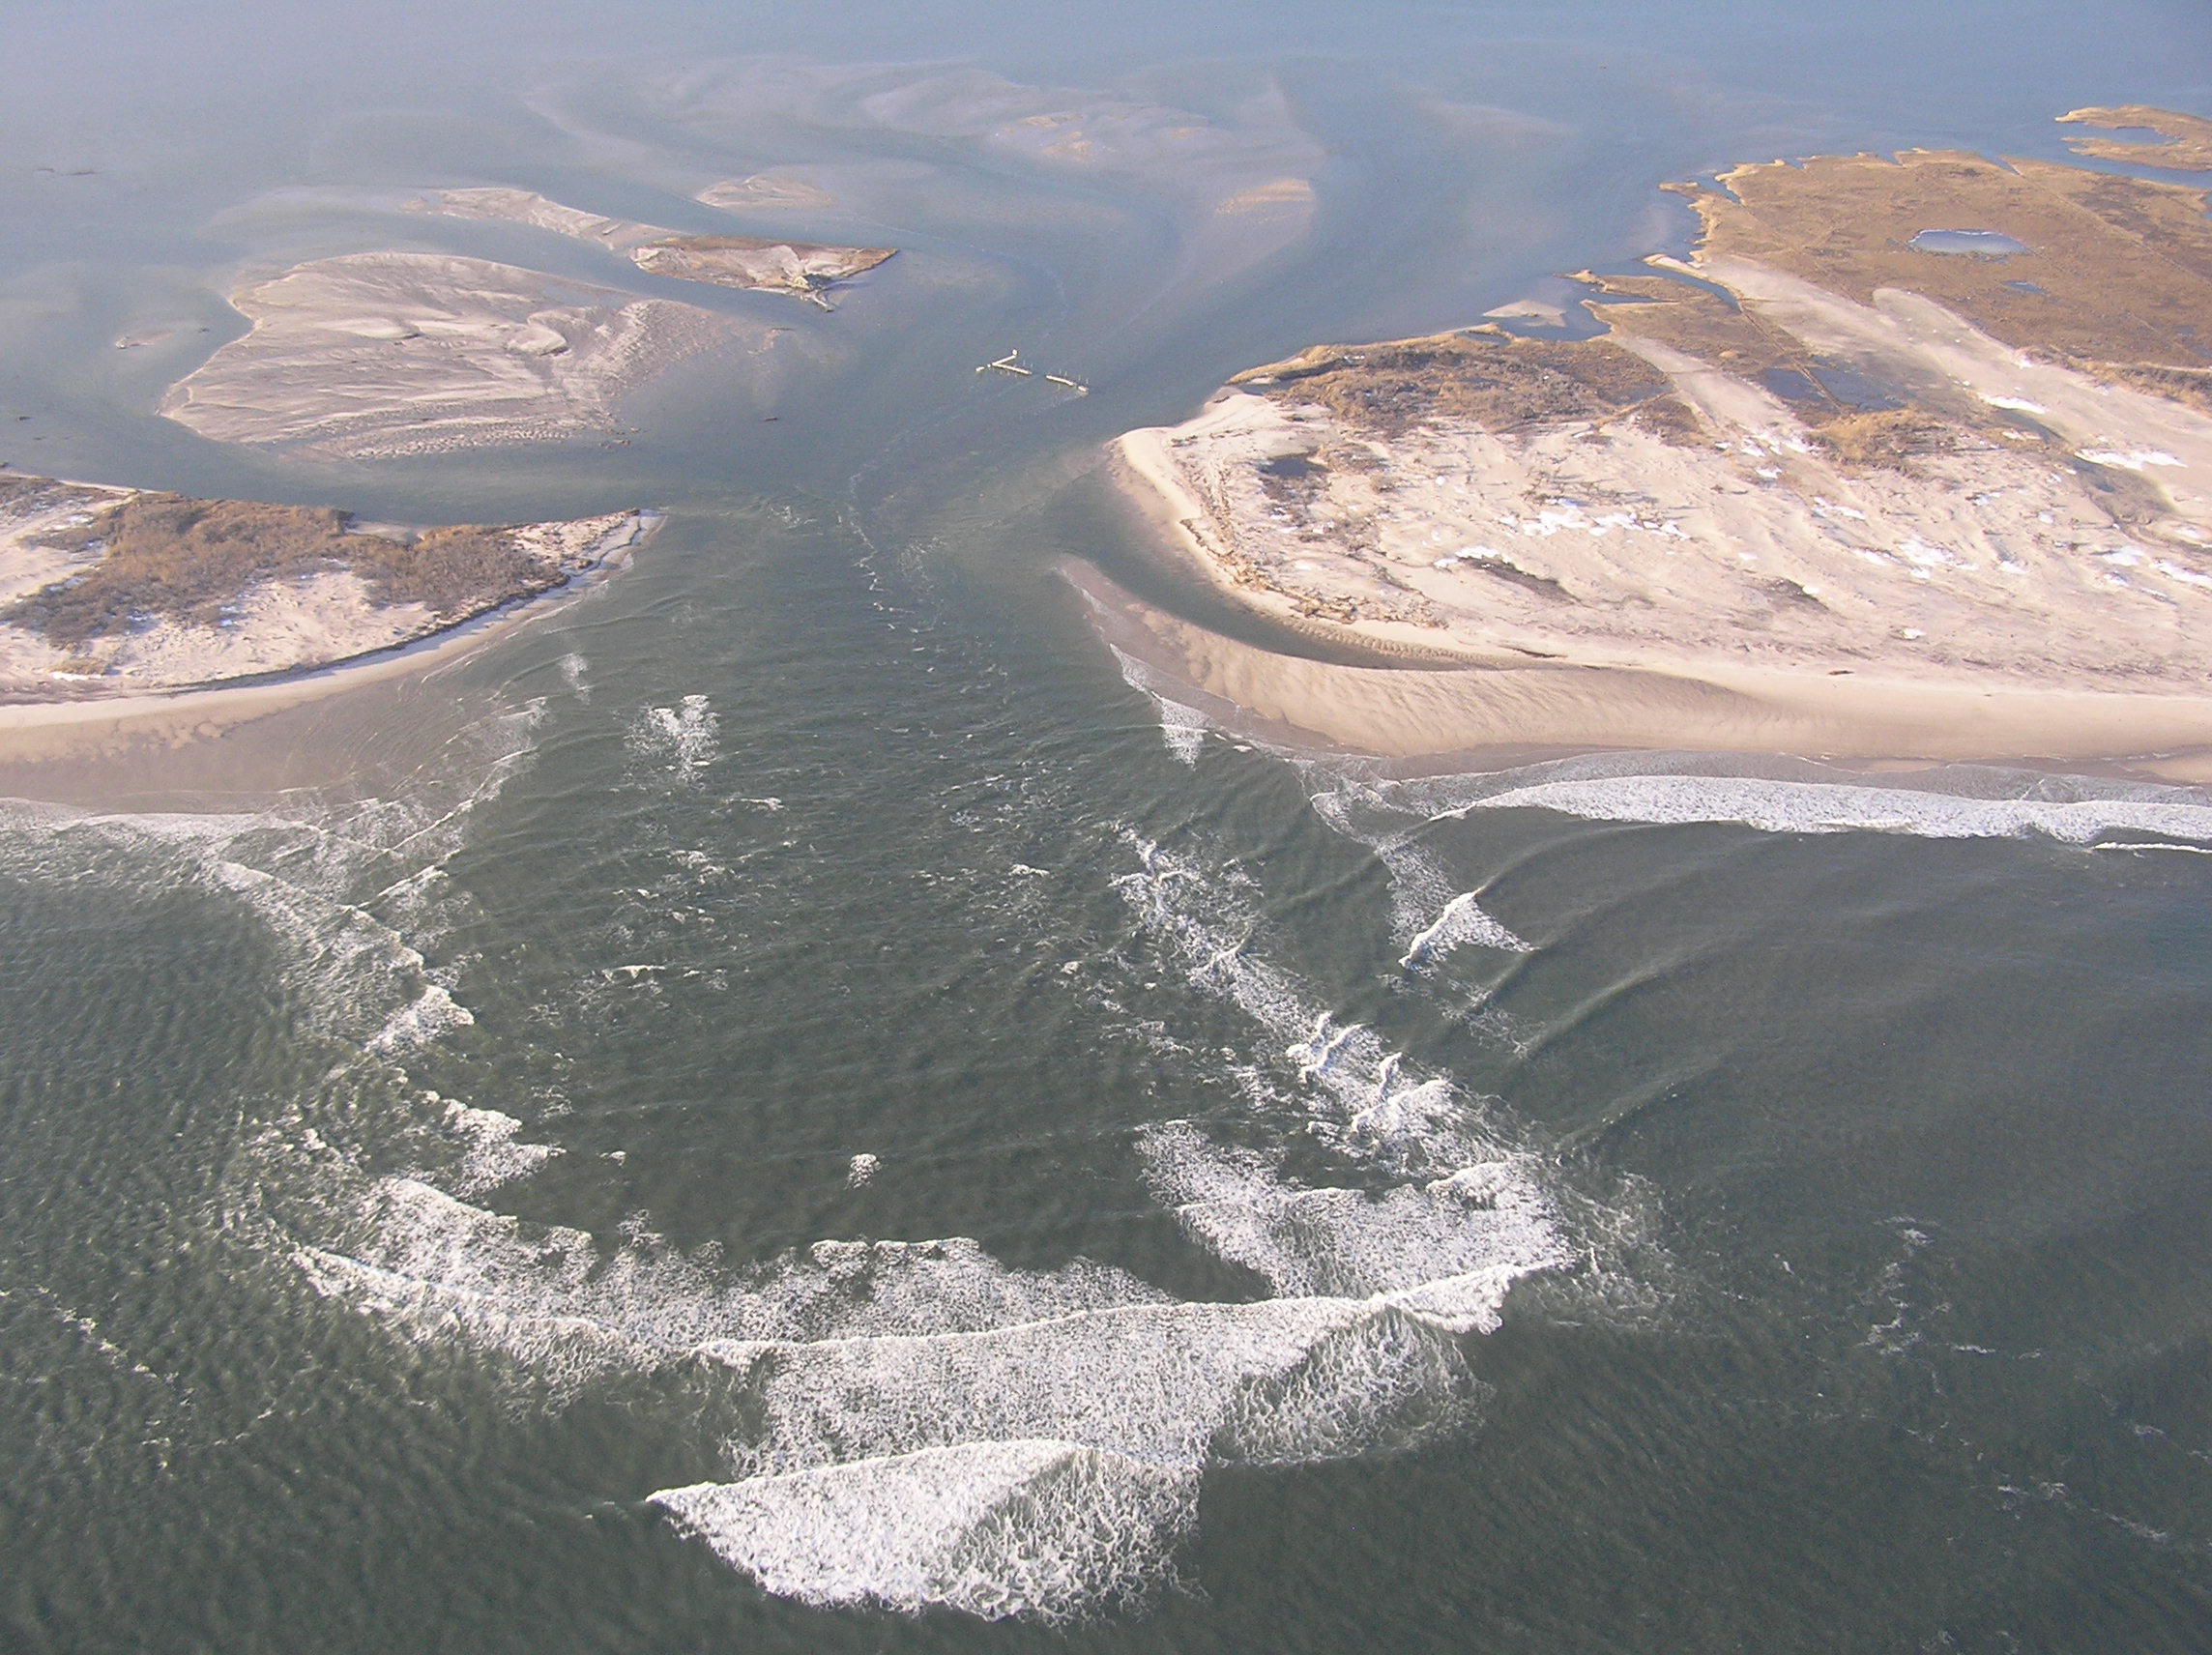 |
Mar 10,
2013 (CF&RG)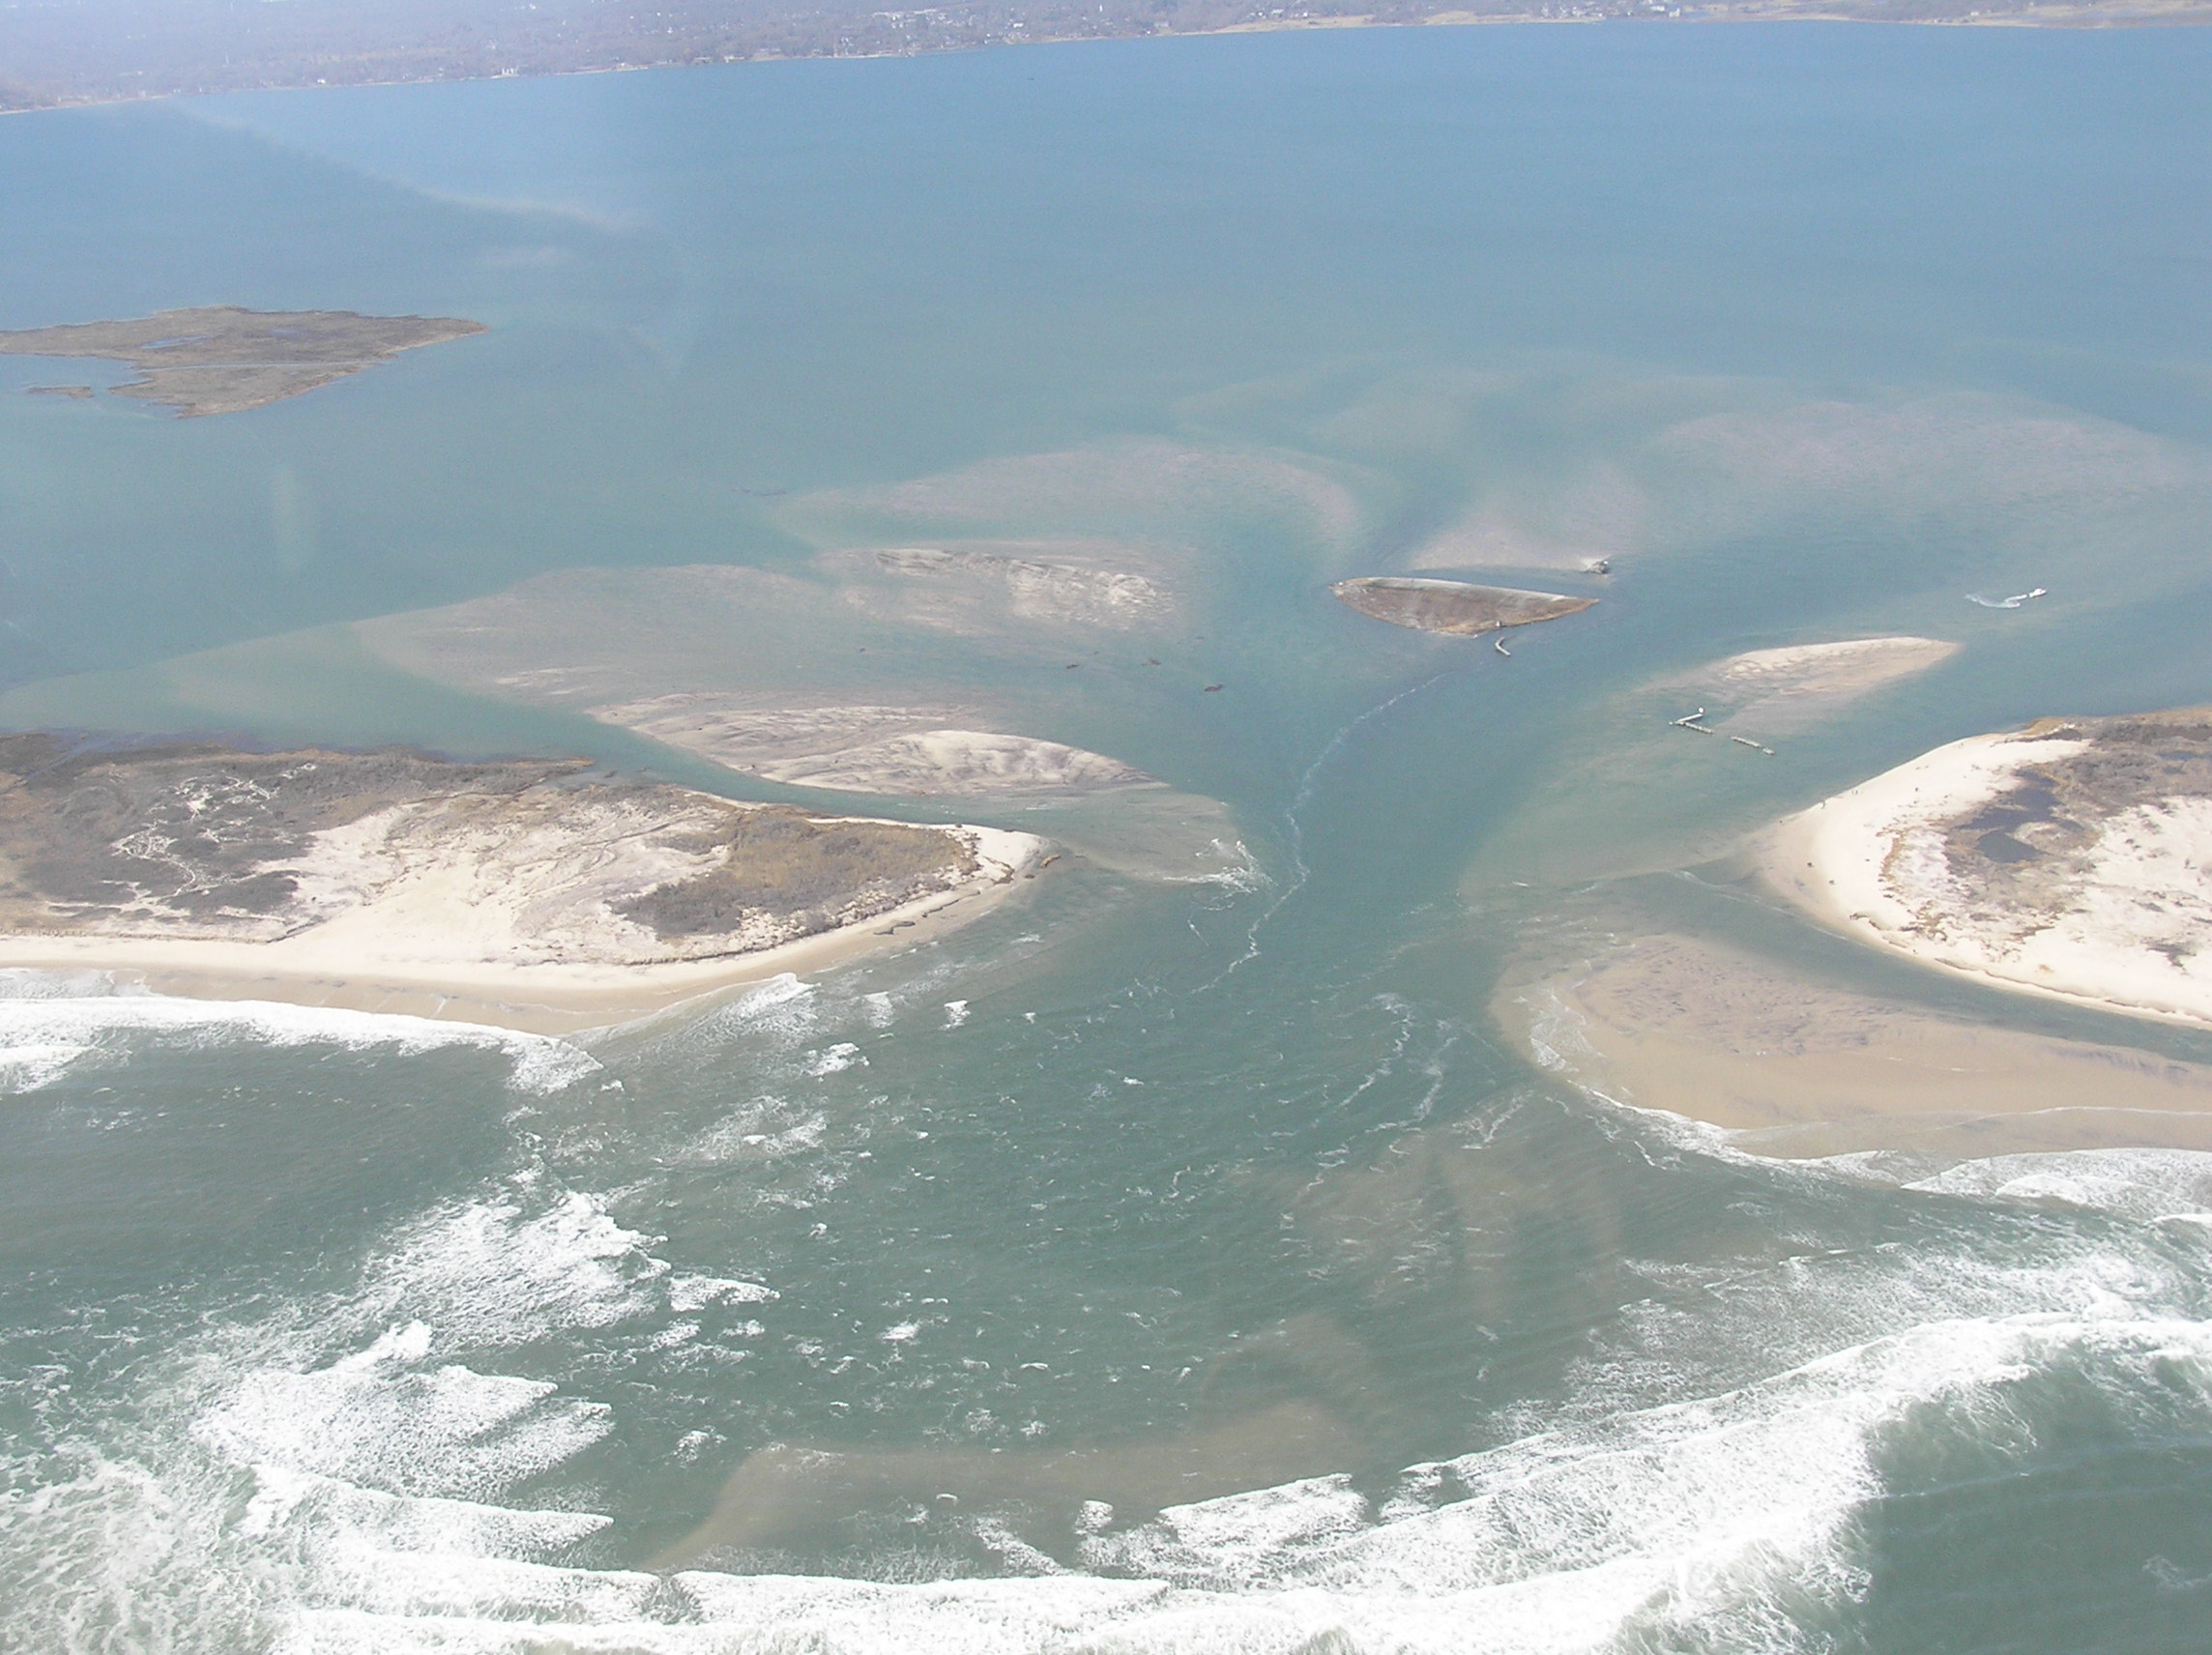 |
Mar 29,
2013 (JS&CF) |
Apr 4,
2013 (MF&RG)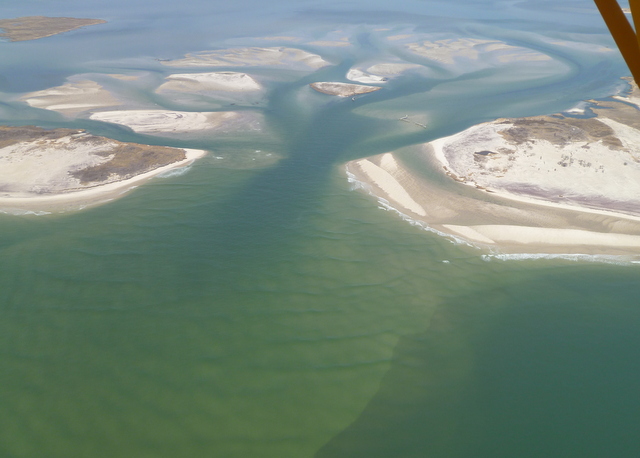 |
||||
Apr 17,
2013 (CF&VP) |
Apr 18,
2013 (JV)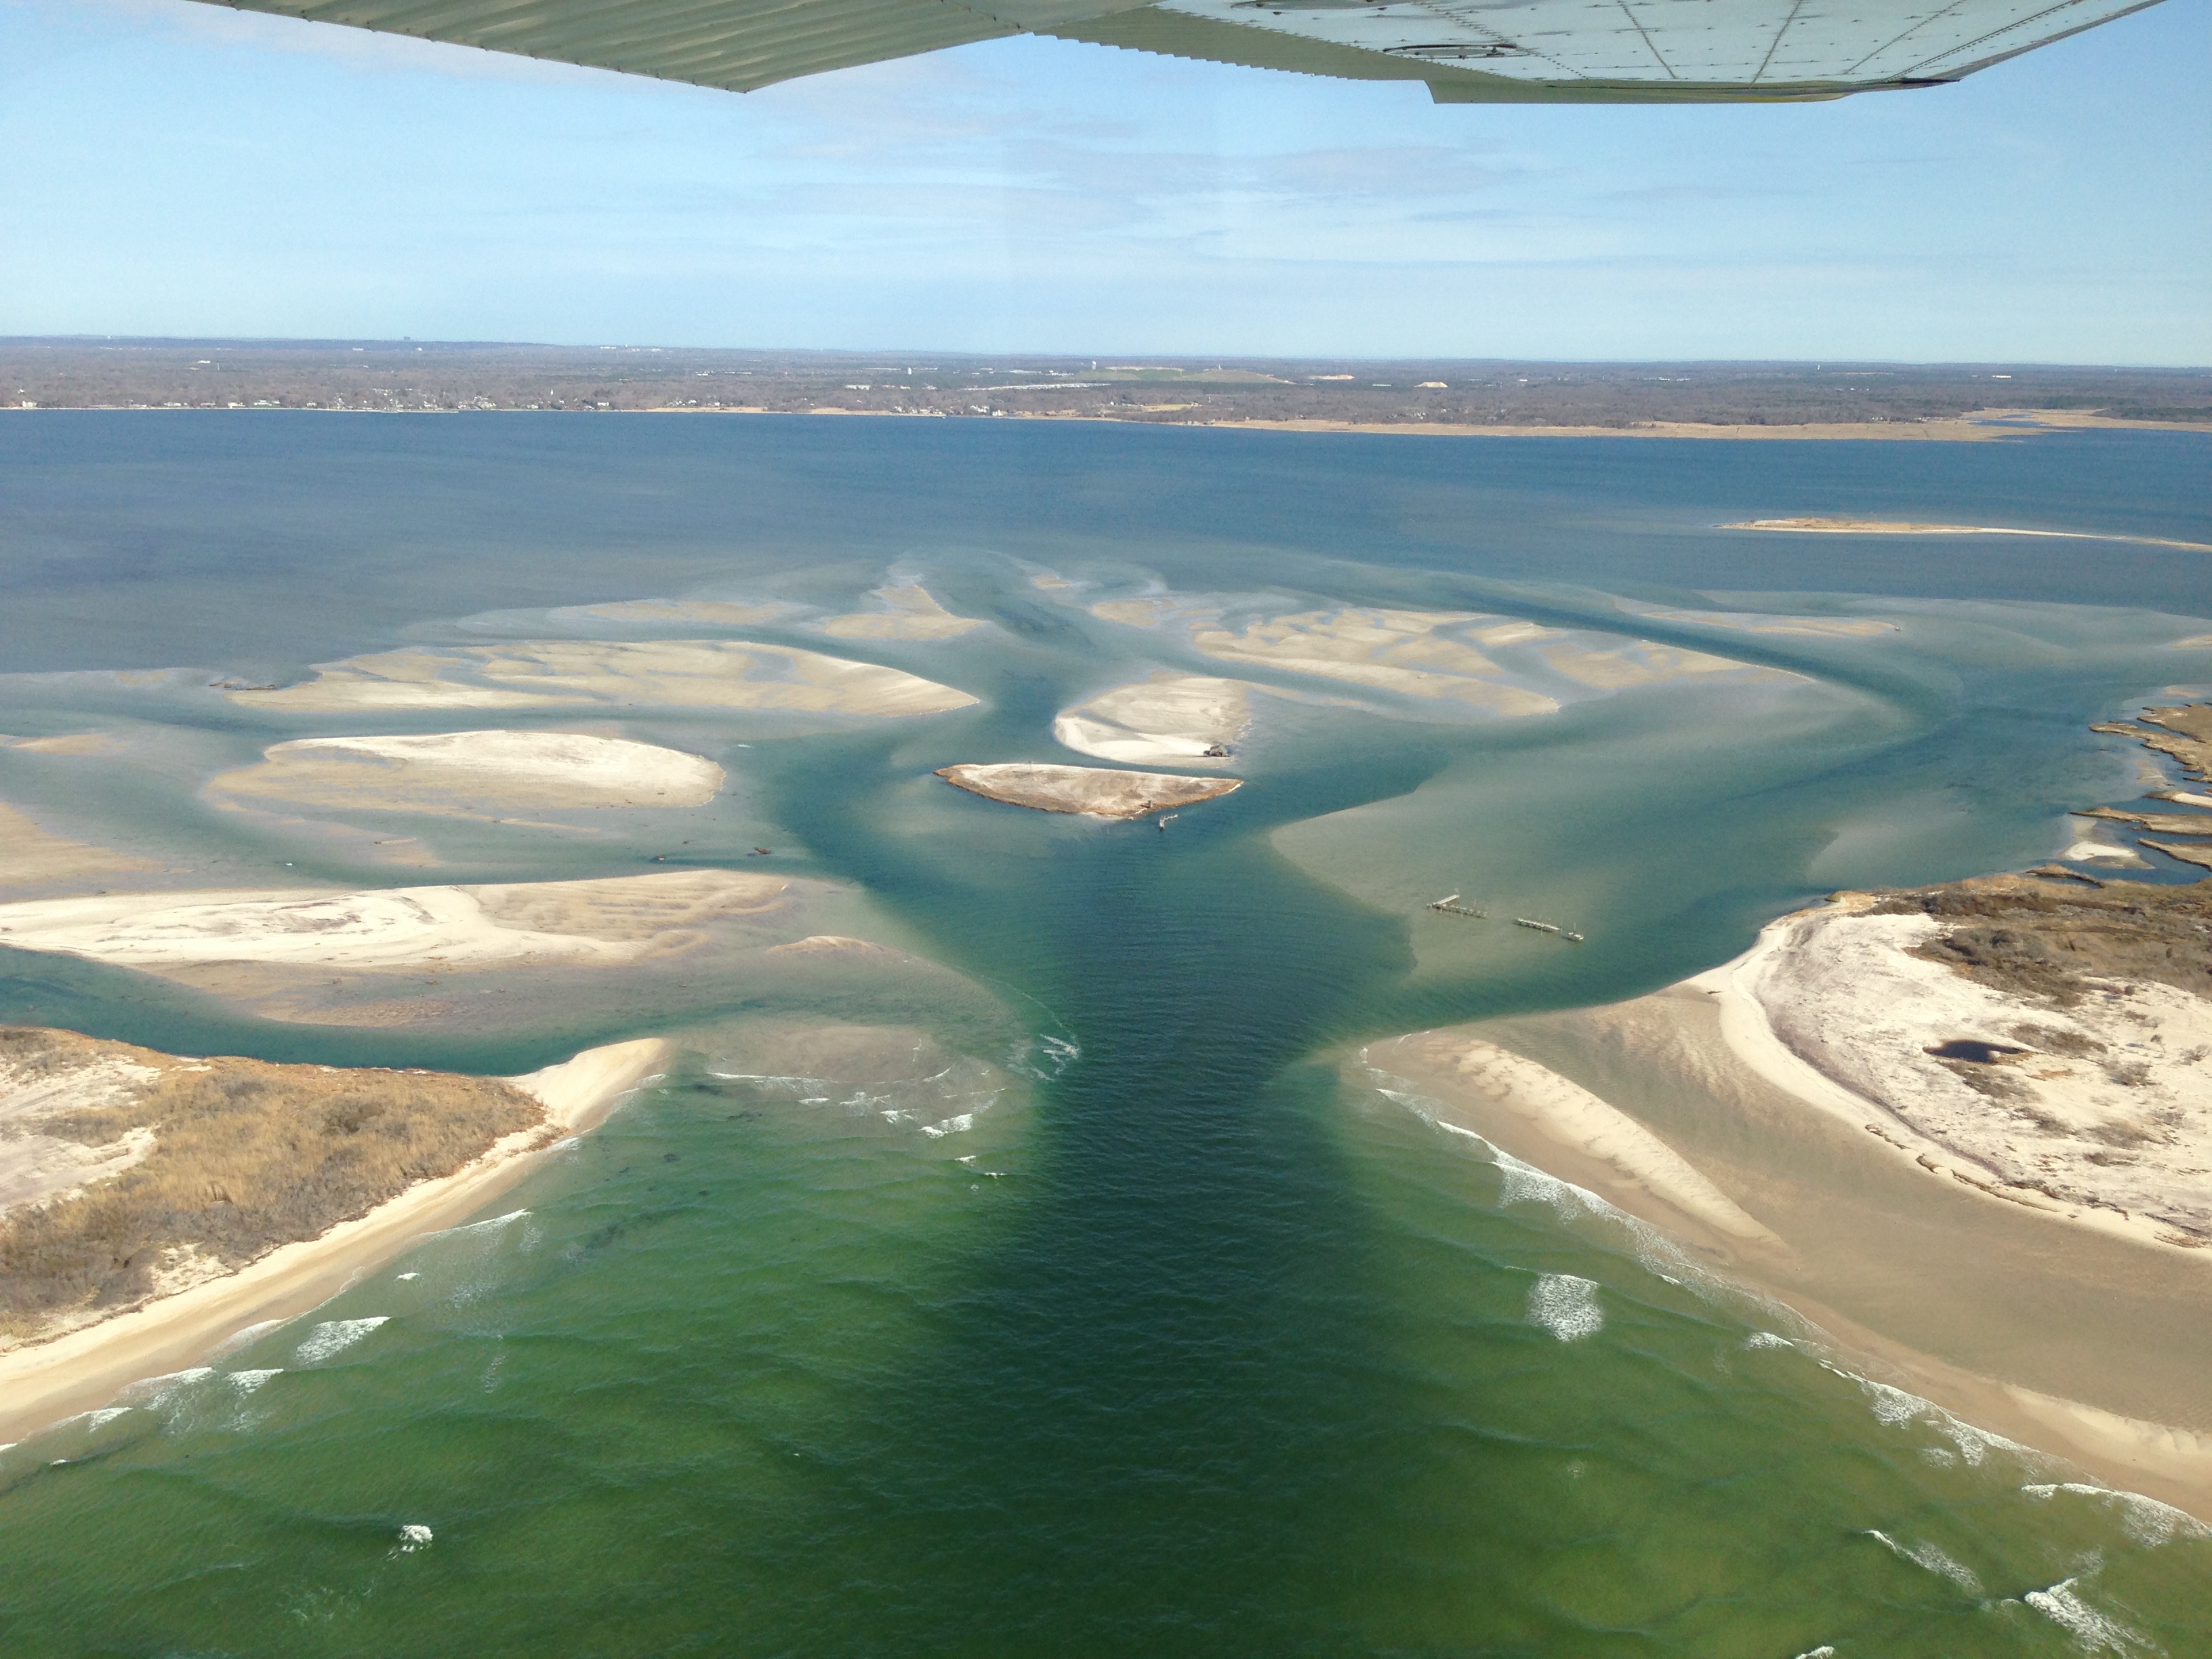 |
May 12,
2013 (CF)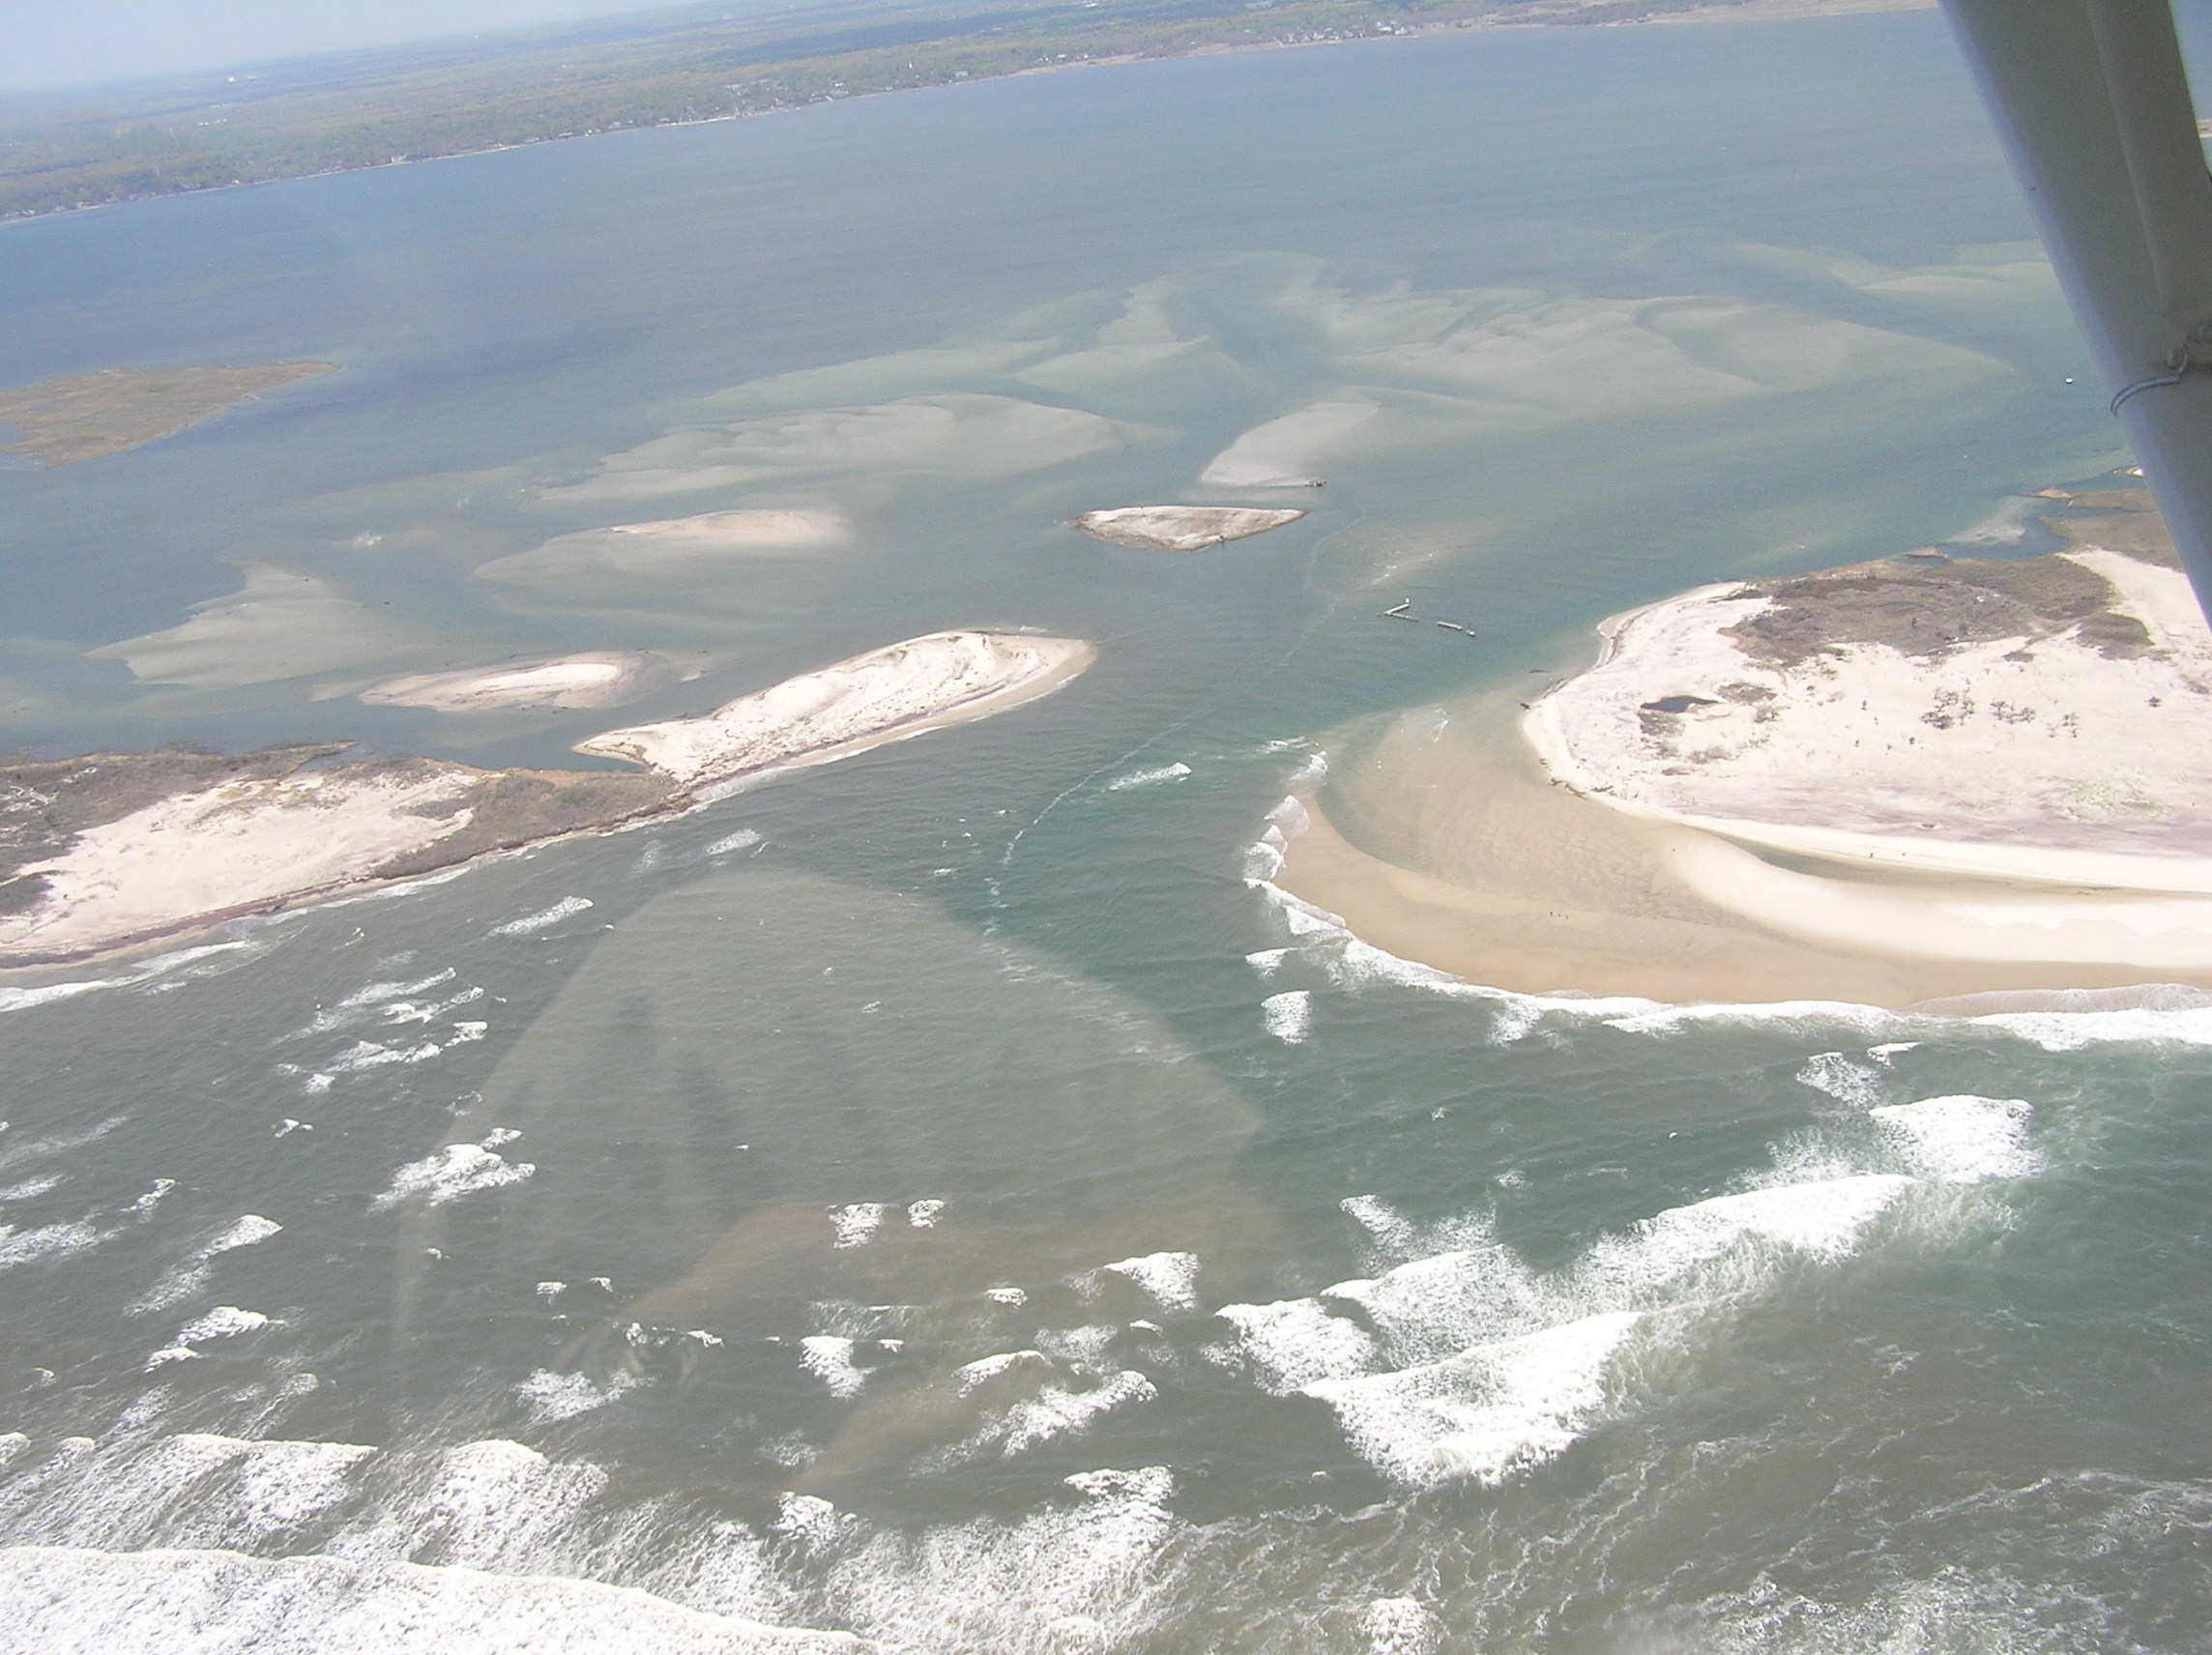 |
May 31,
2013 (CF)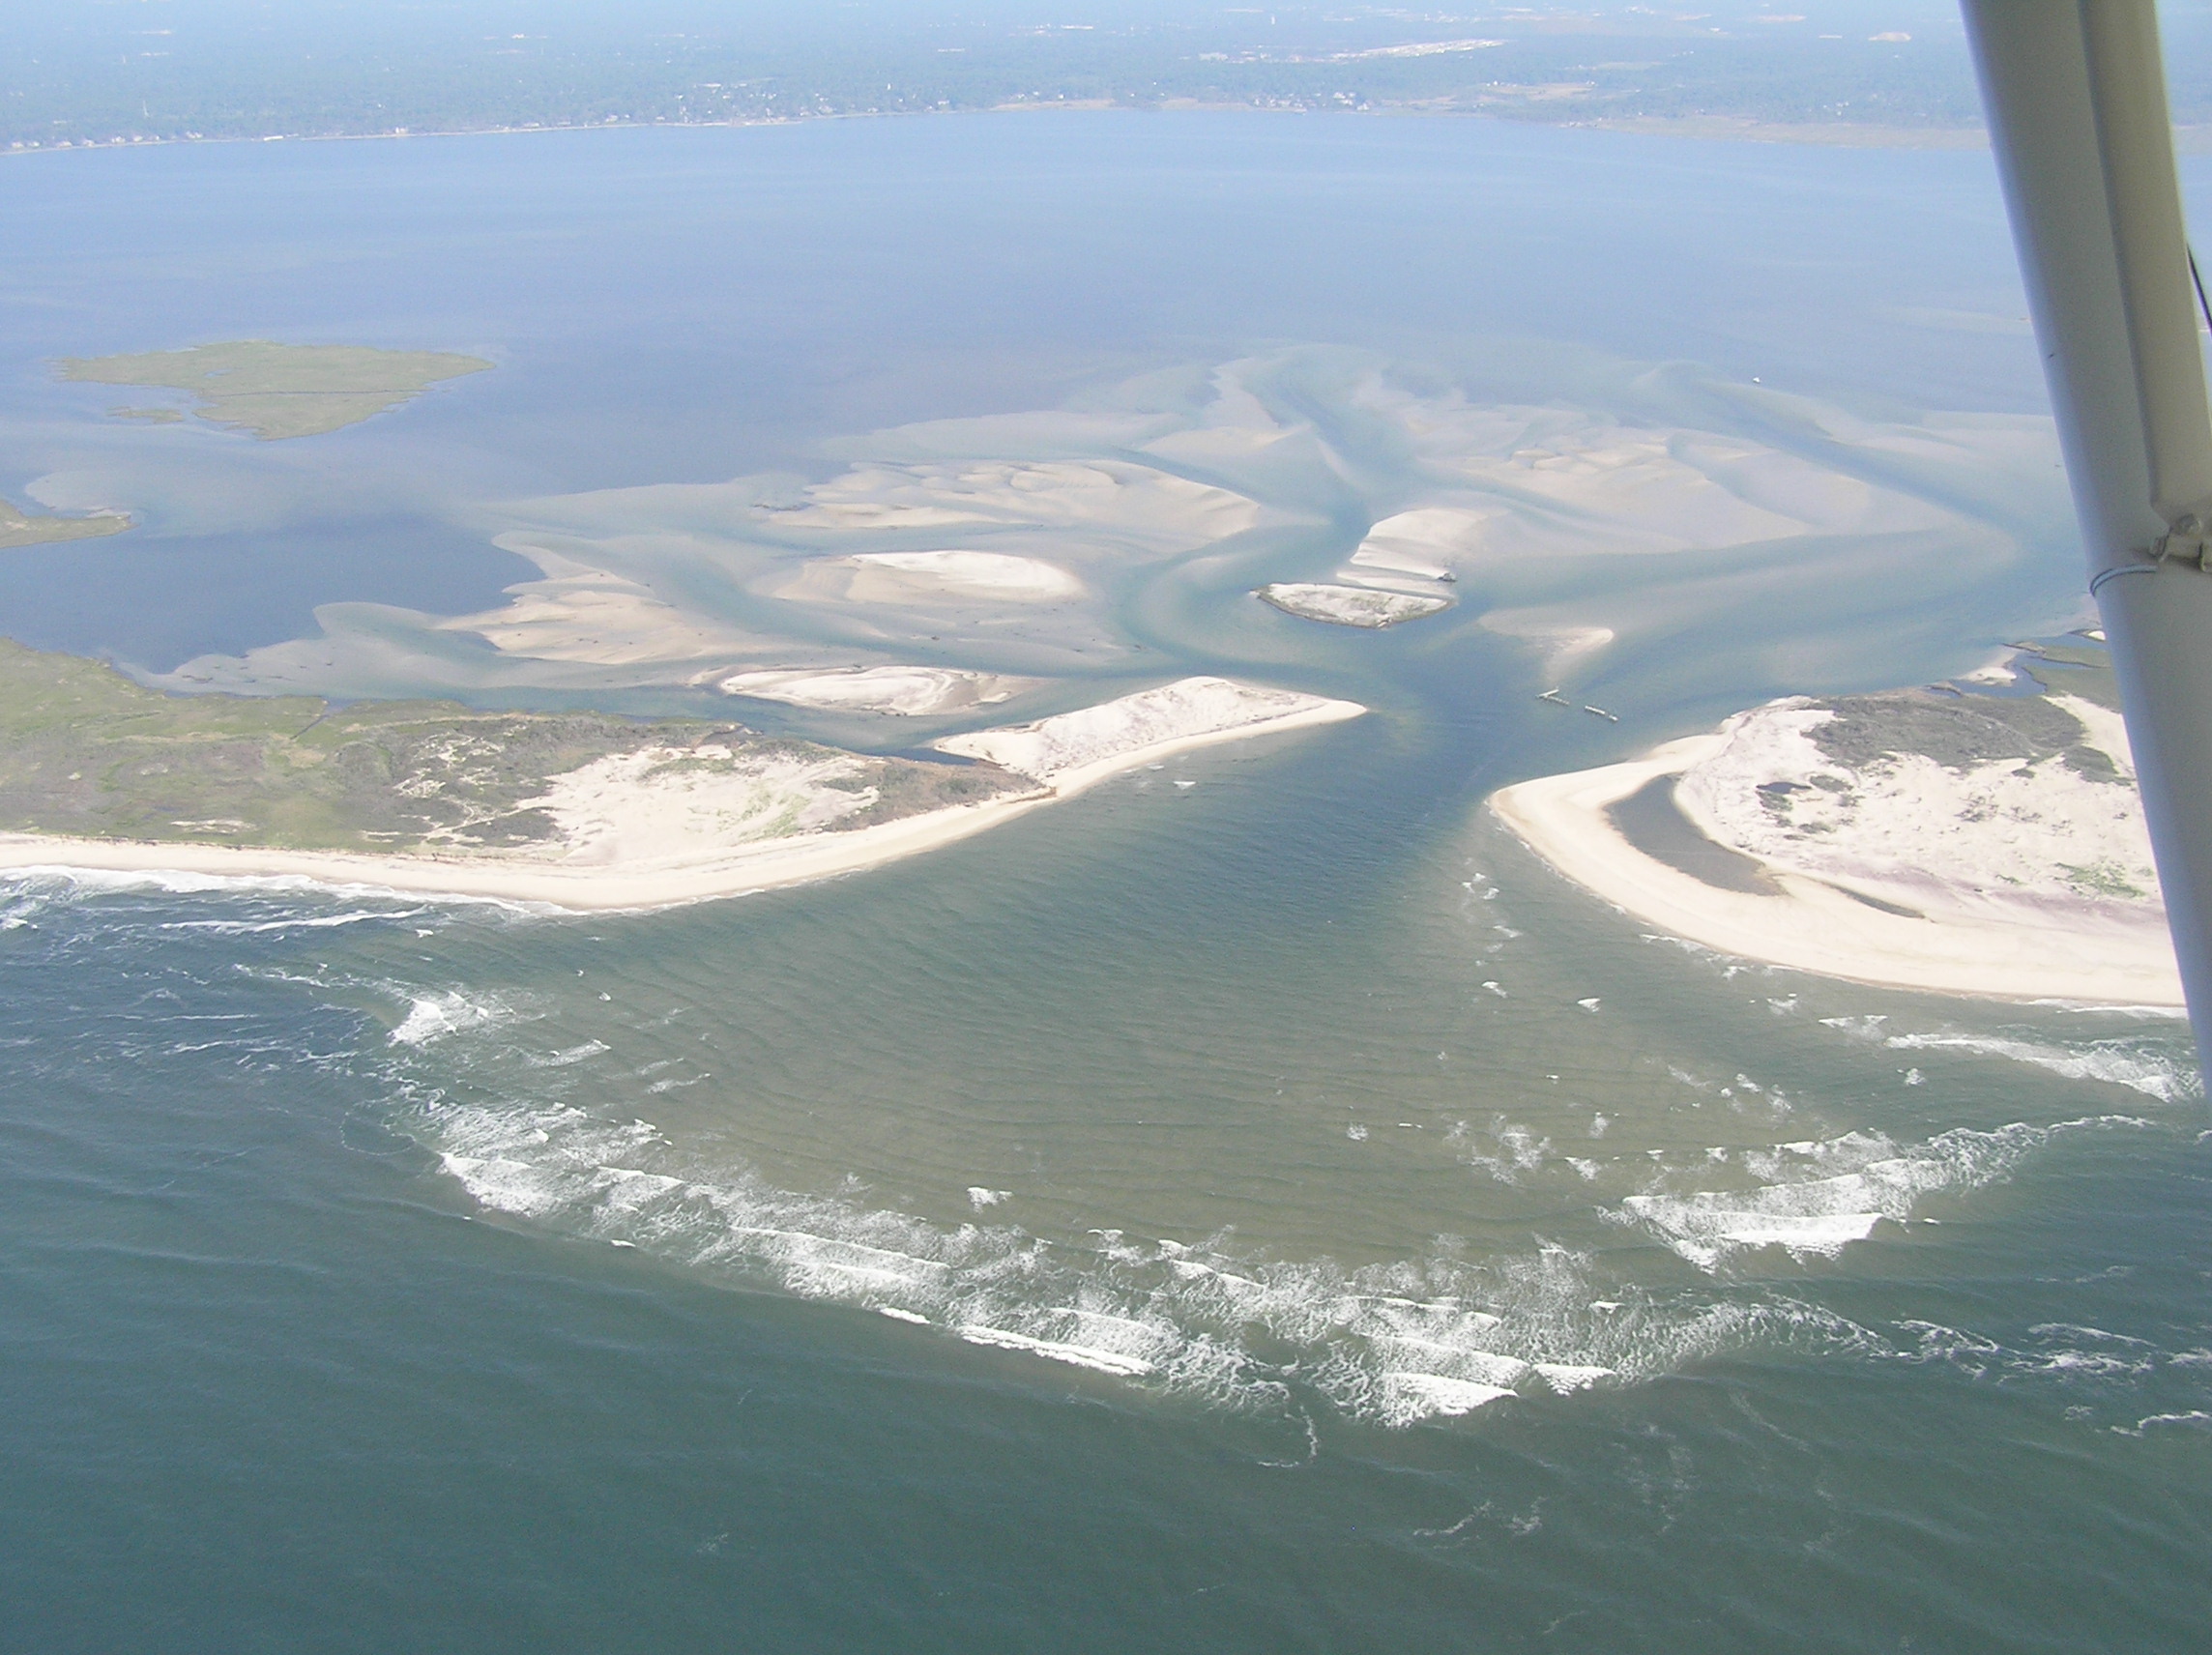 |
||||
June 16,
2013 (BF & CF)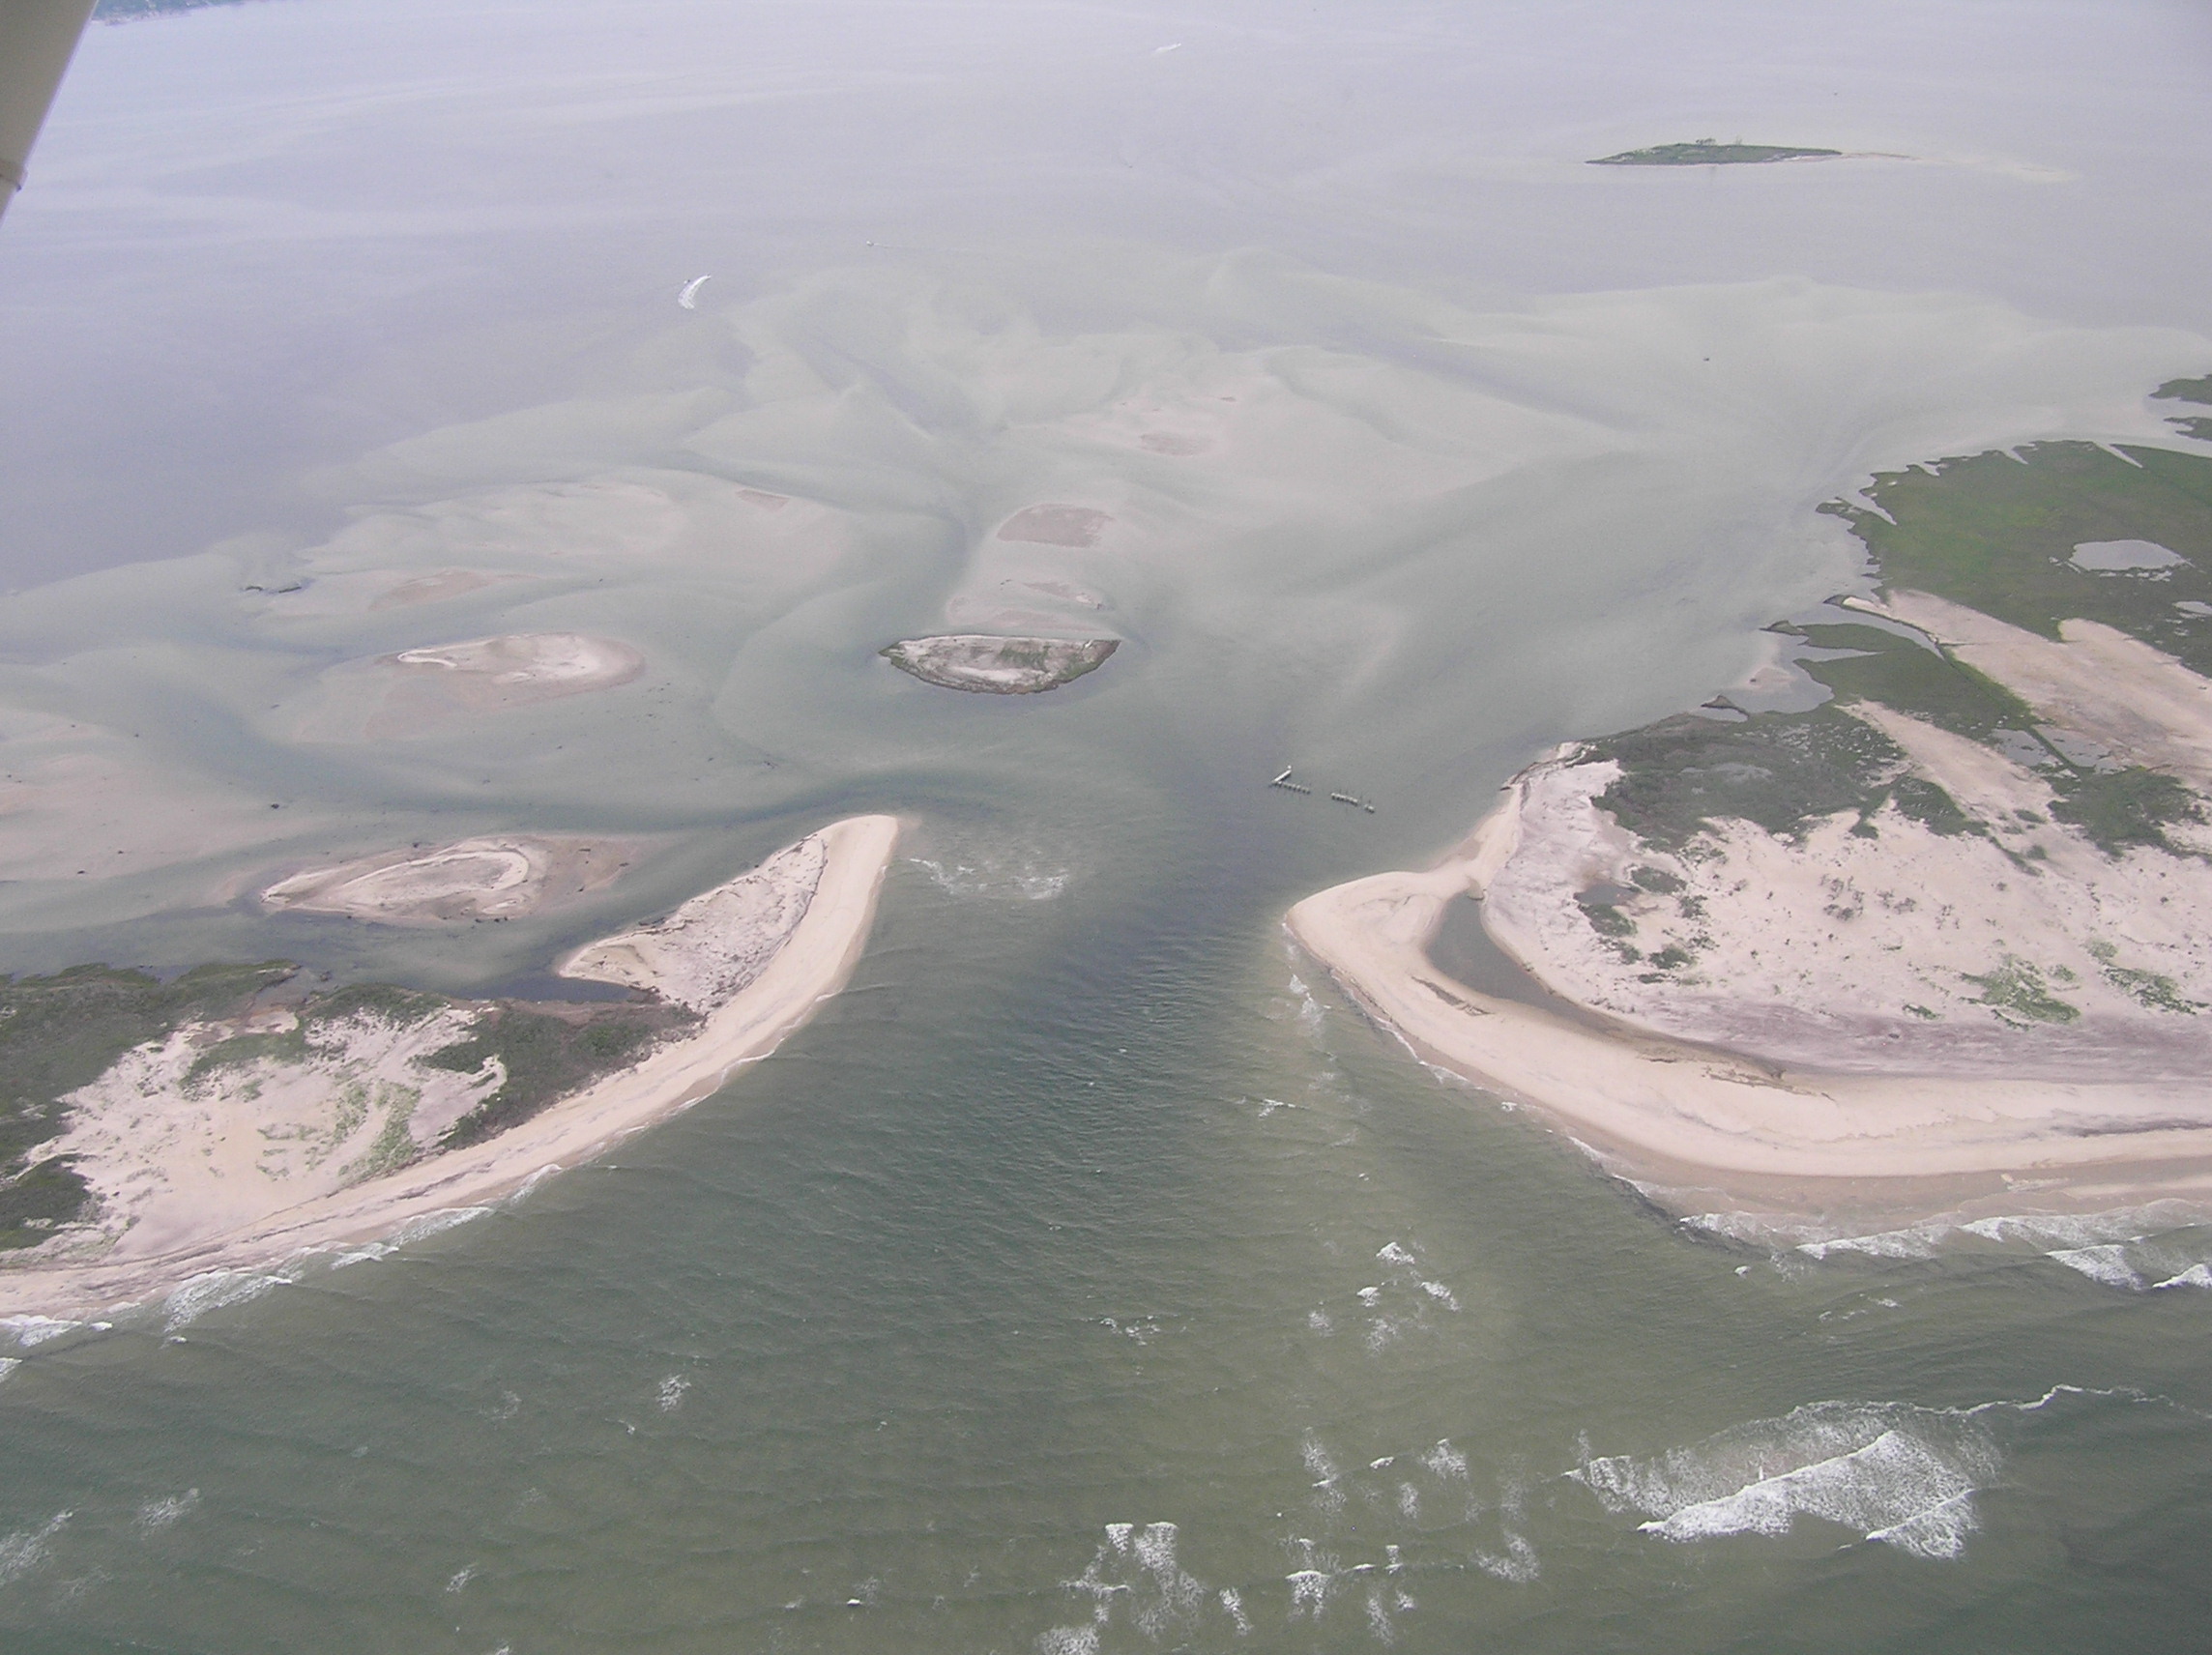 |
July 7, 2013
(CG & CF) |
Aug 5, 2013
(MB&CF)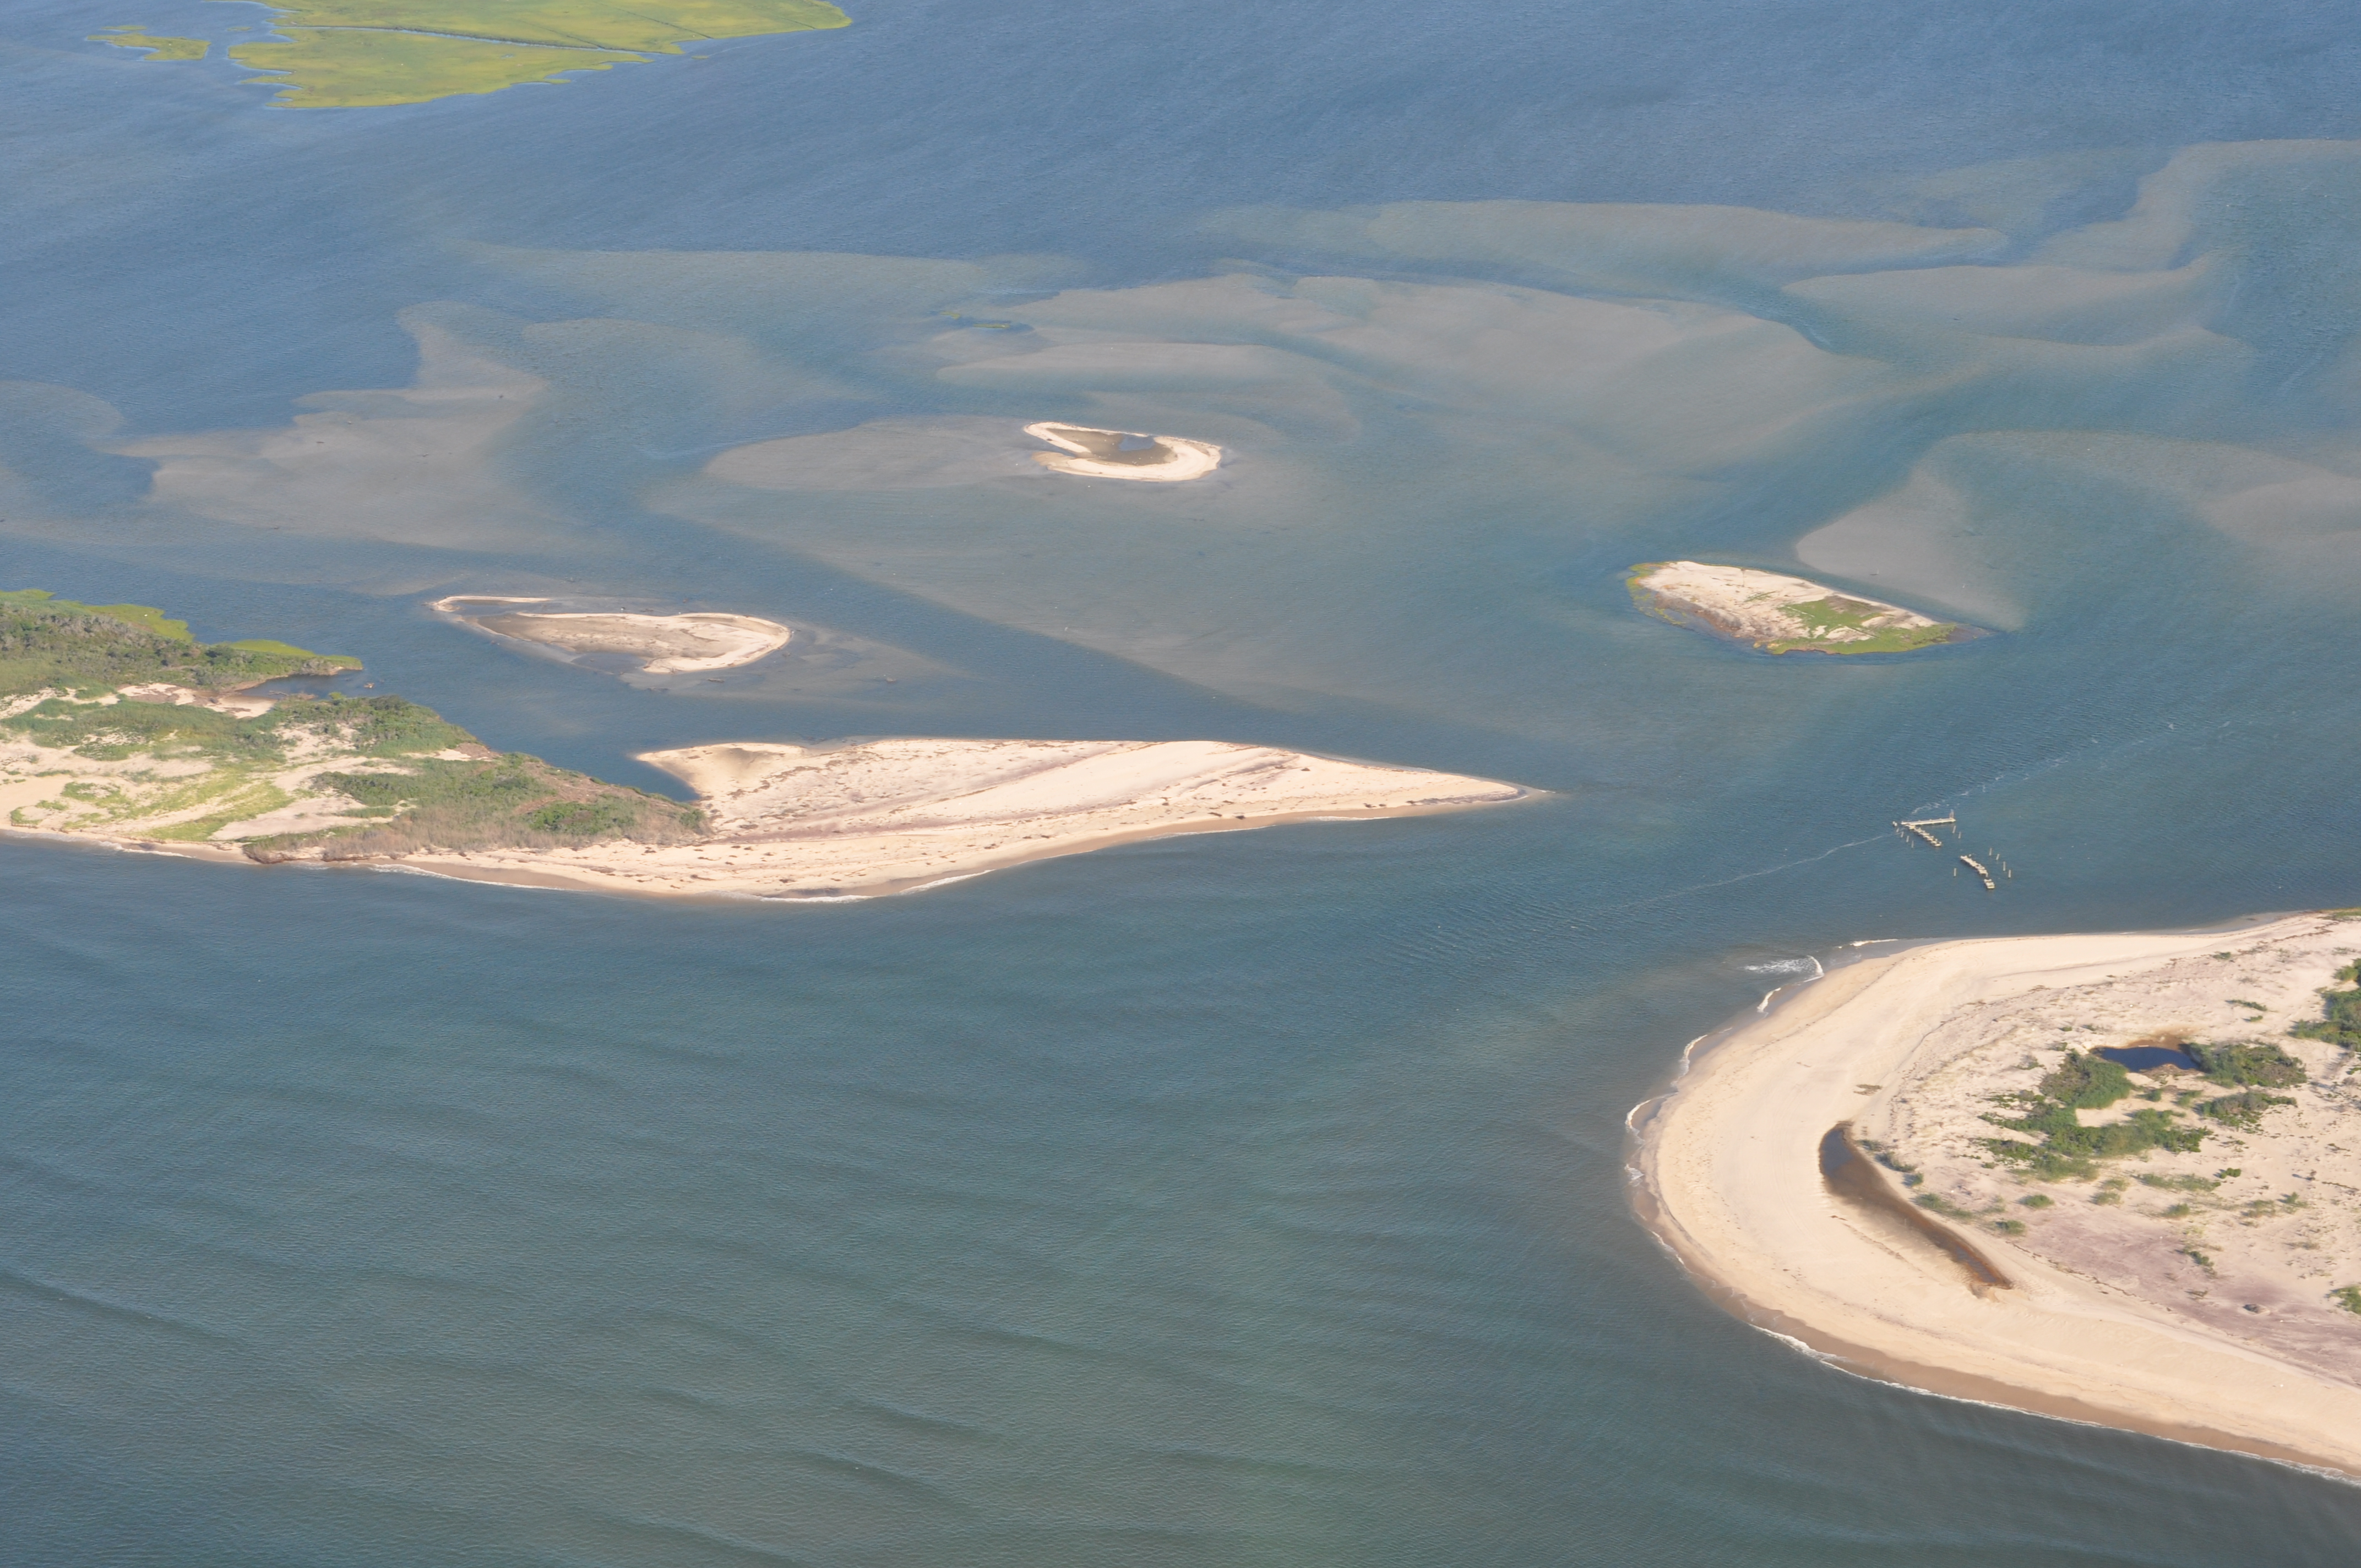 |
Sept 15, 2013
(CF)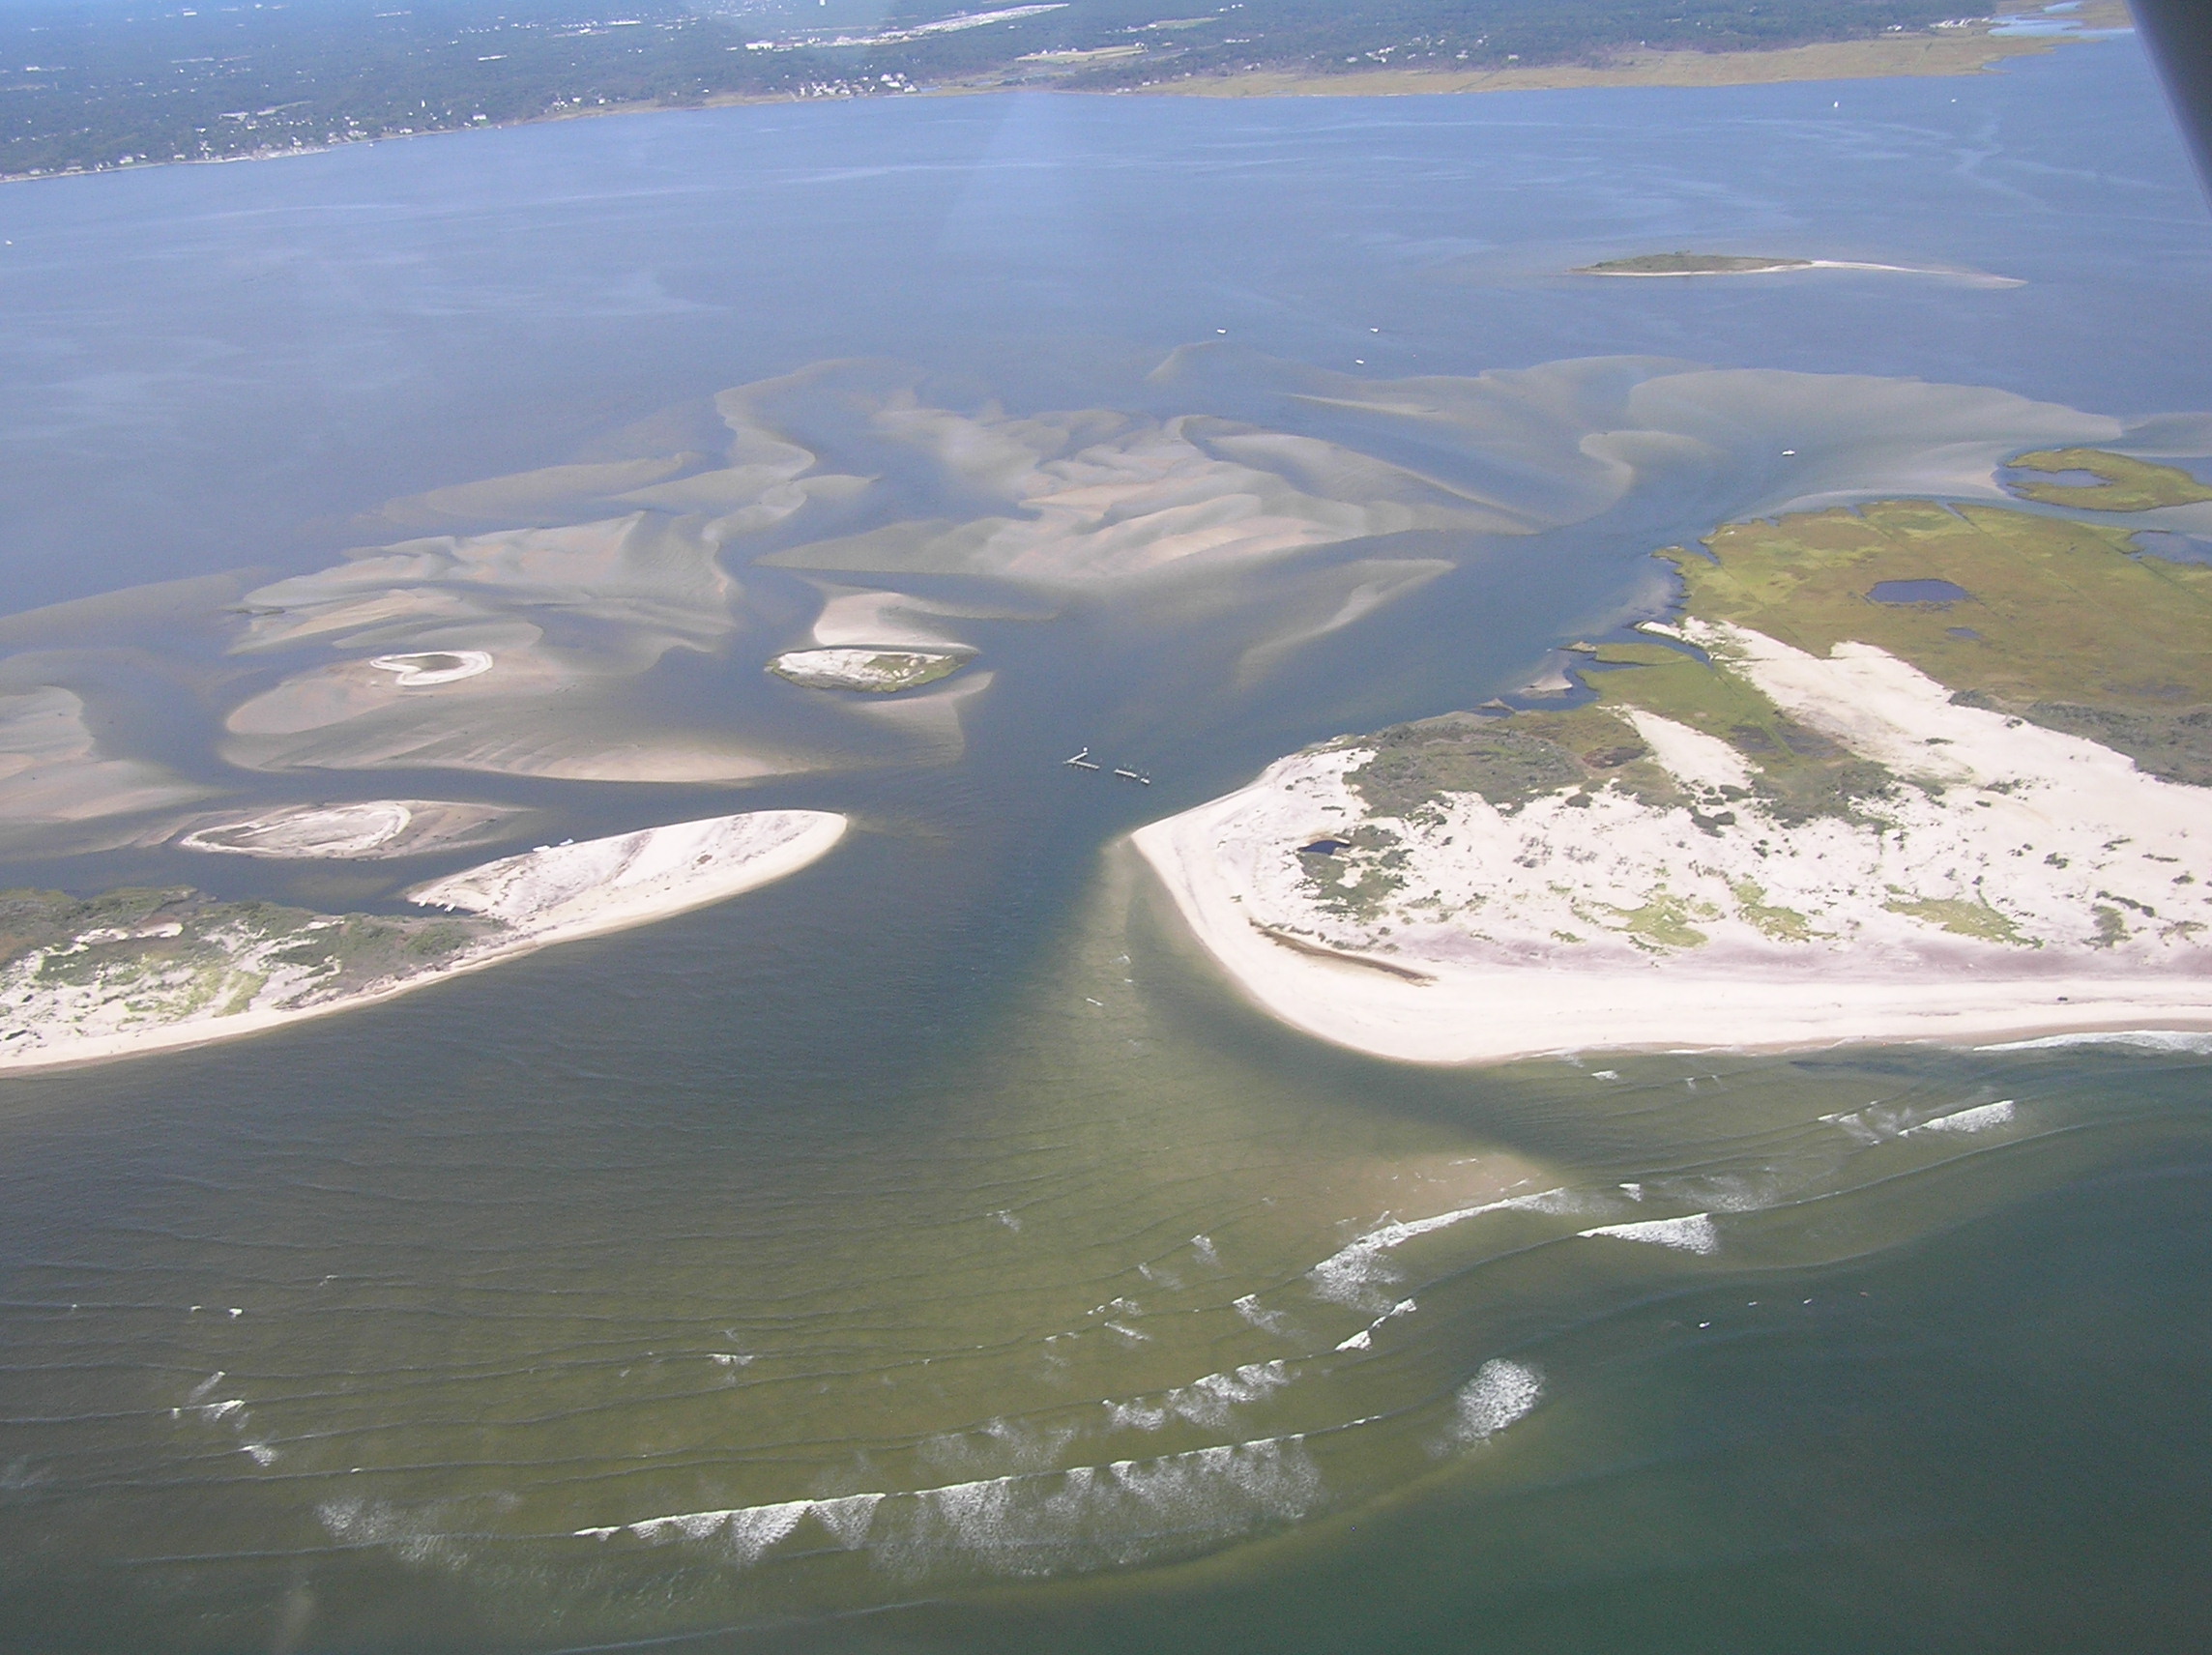 |
||||
Oct 19, 2013 (CF) |
Nov 6, 2013 (CF)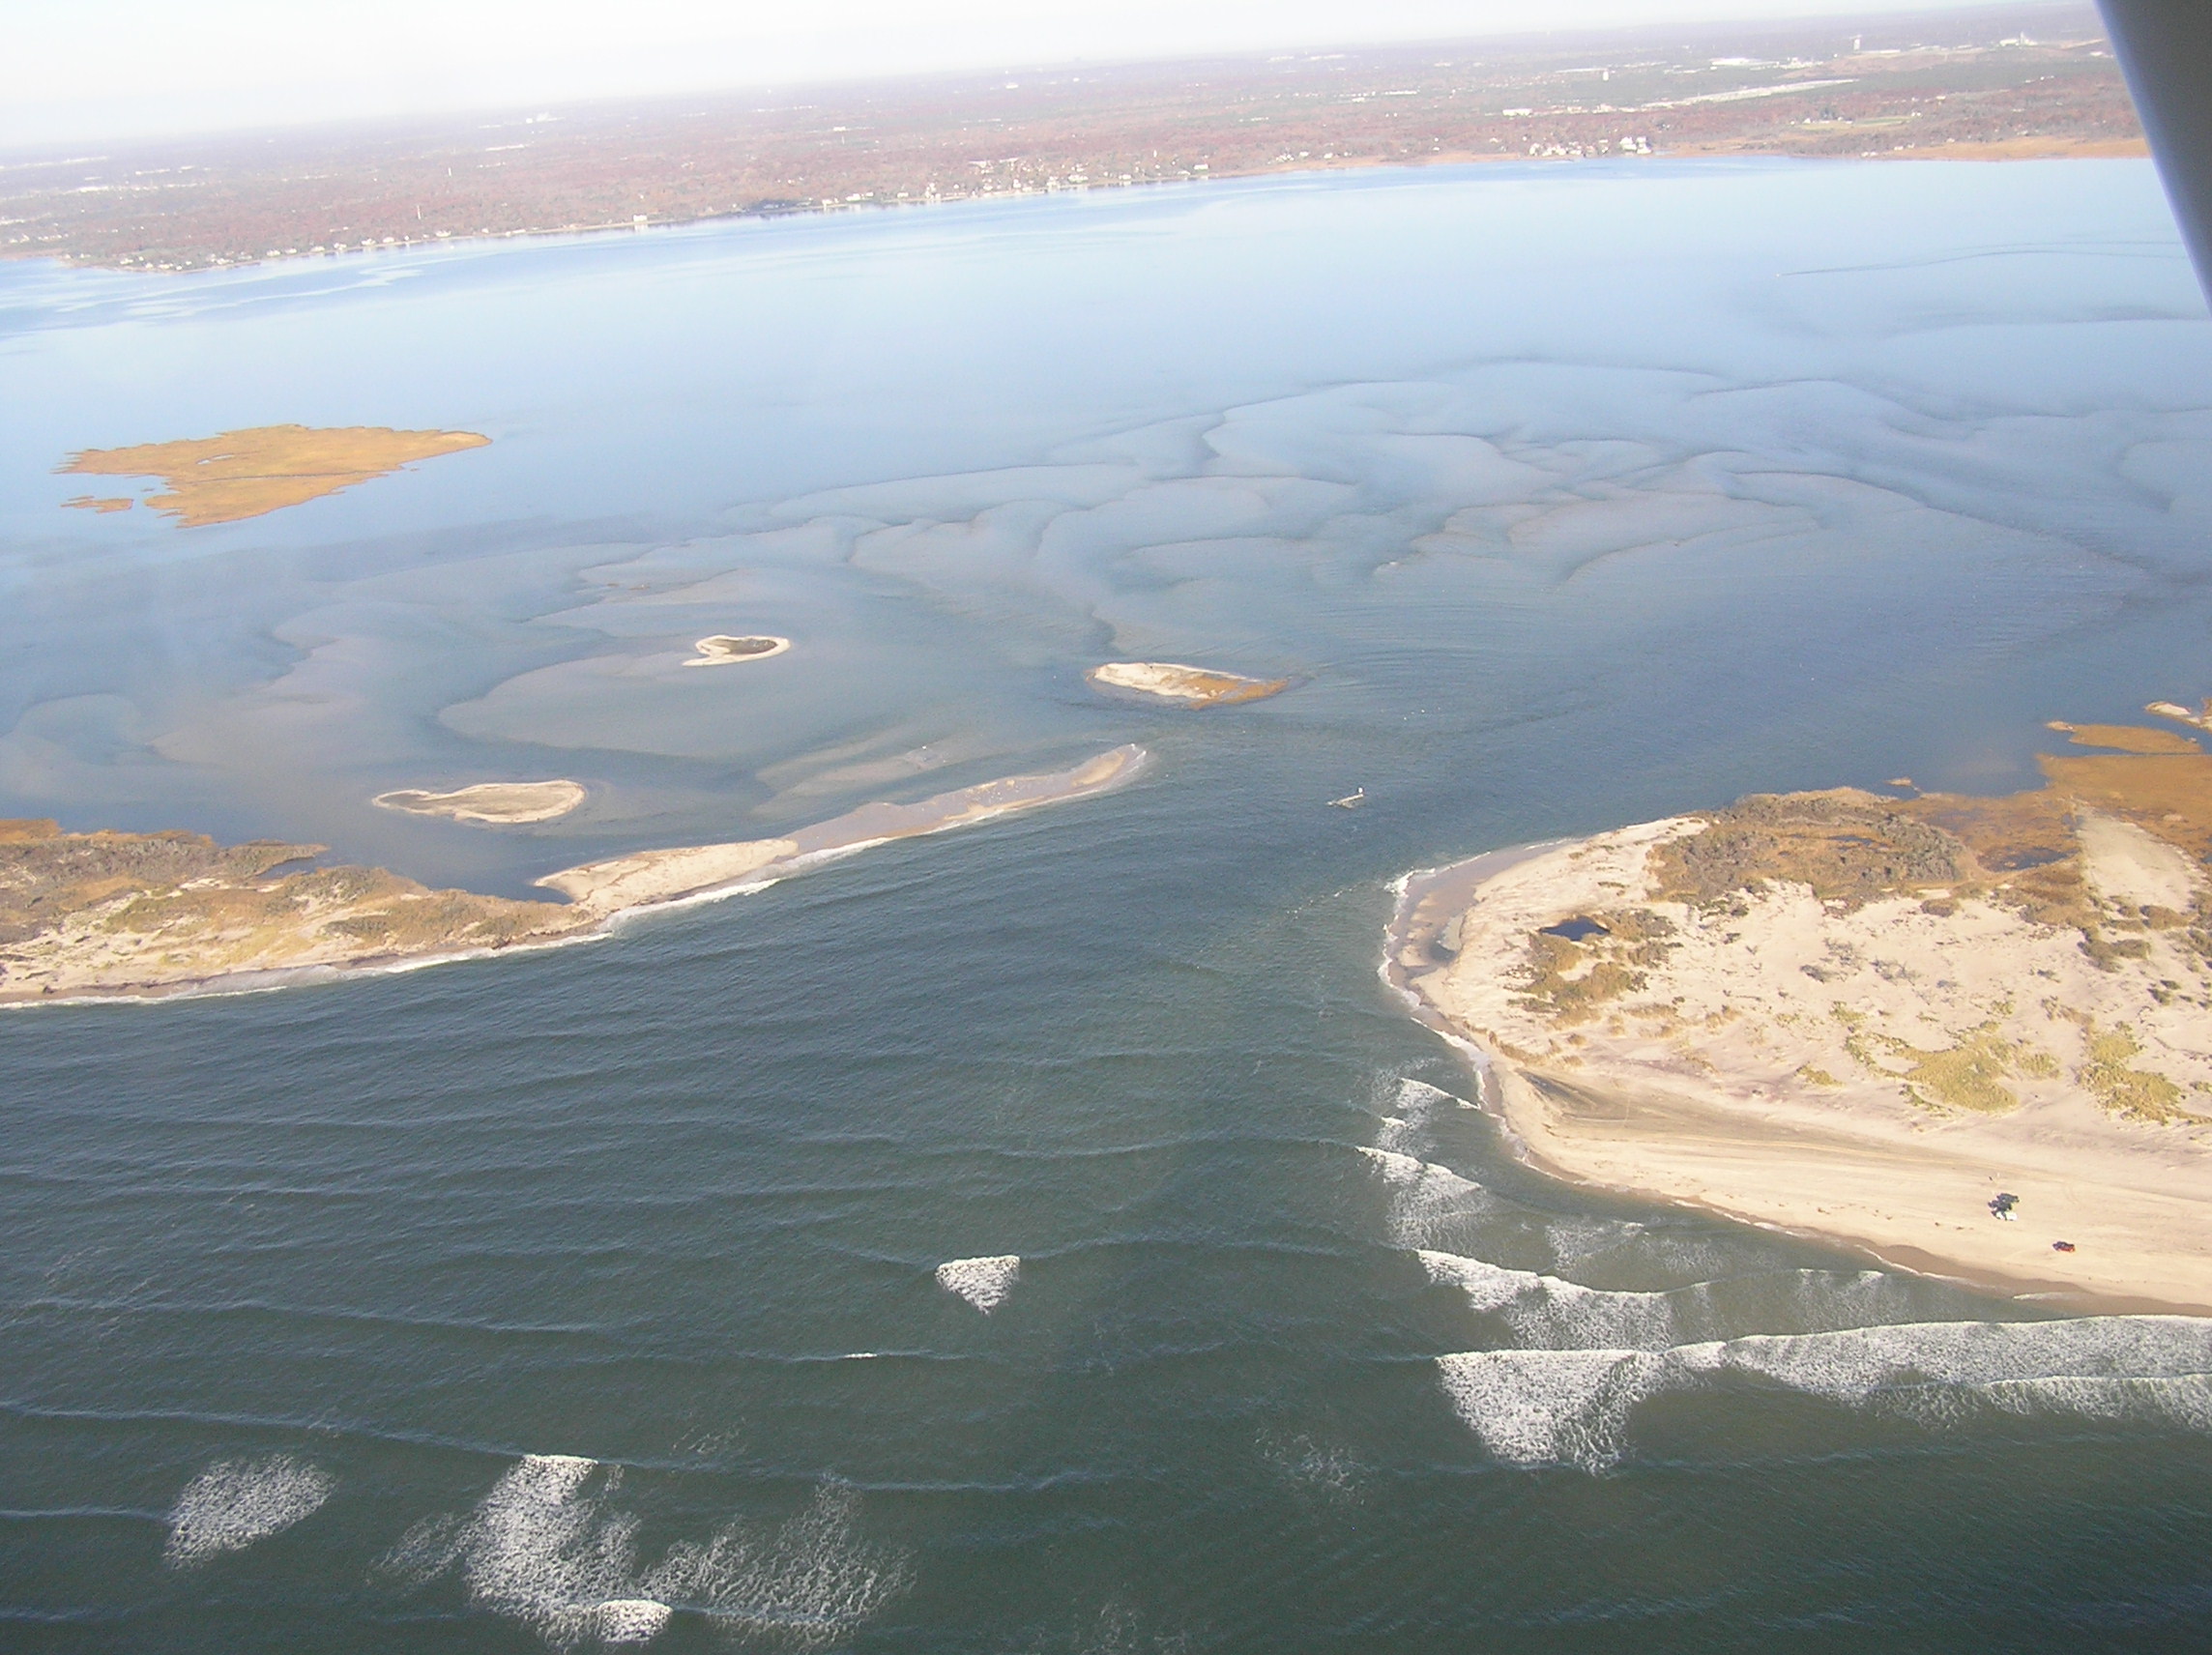 |
Dec 8, 2013 (CF)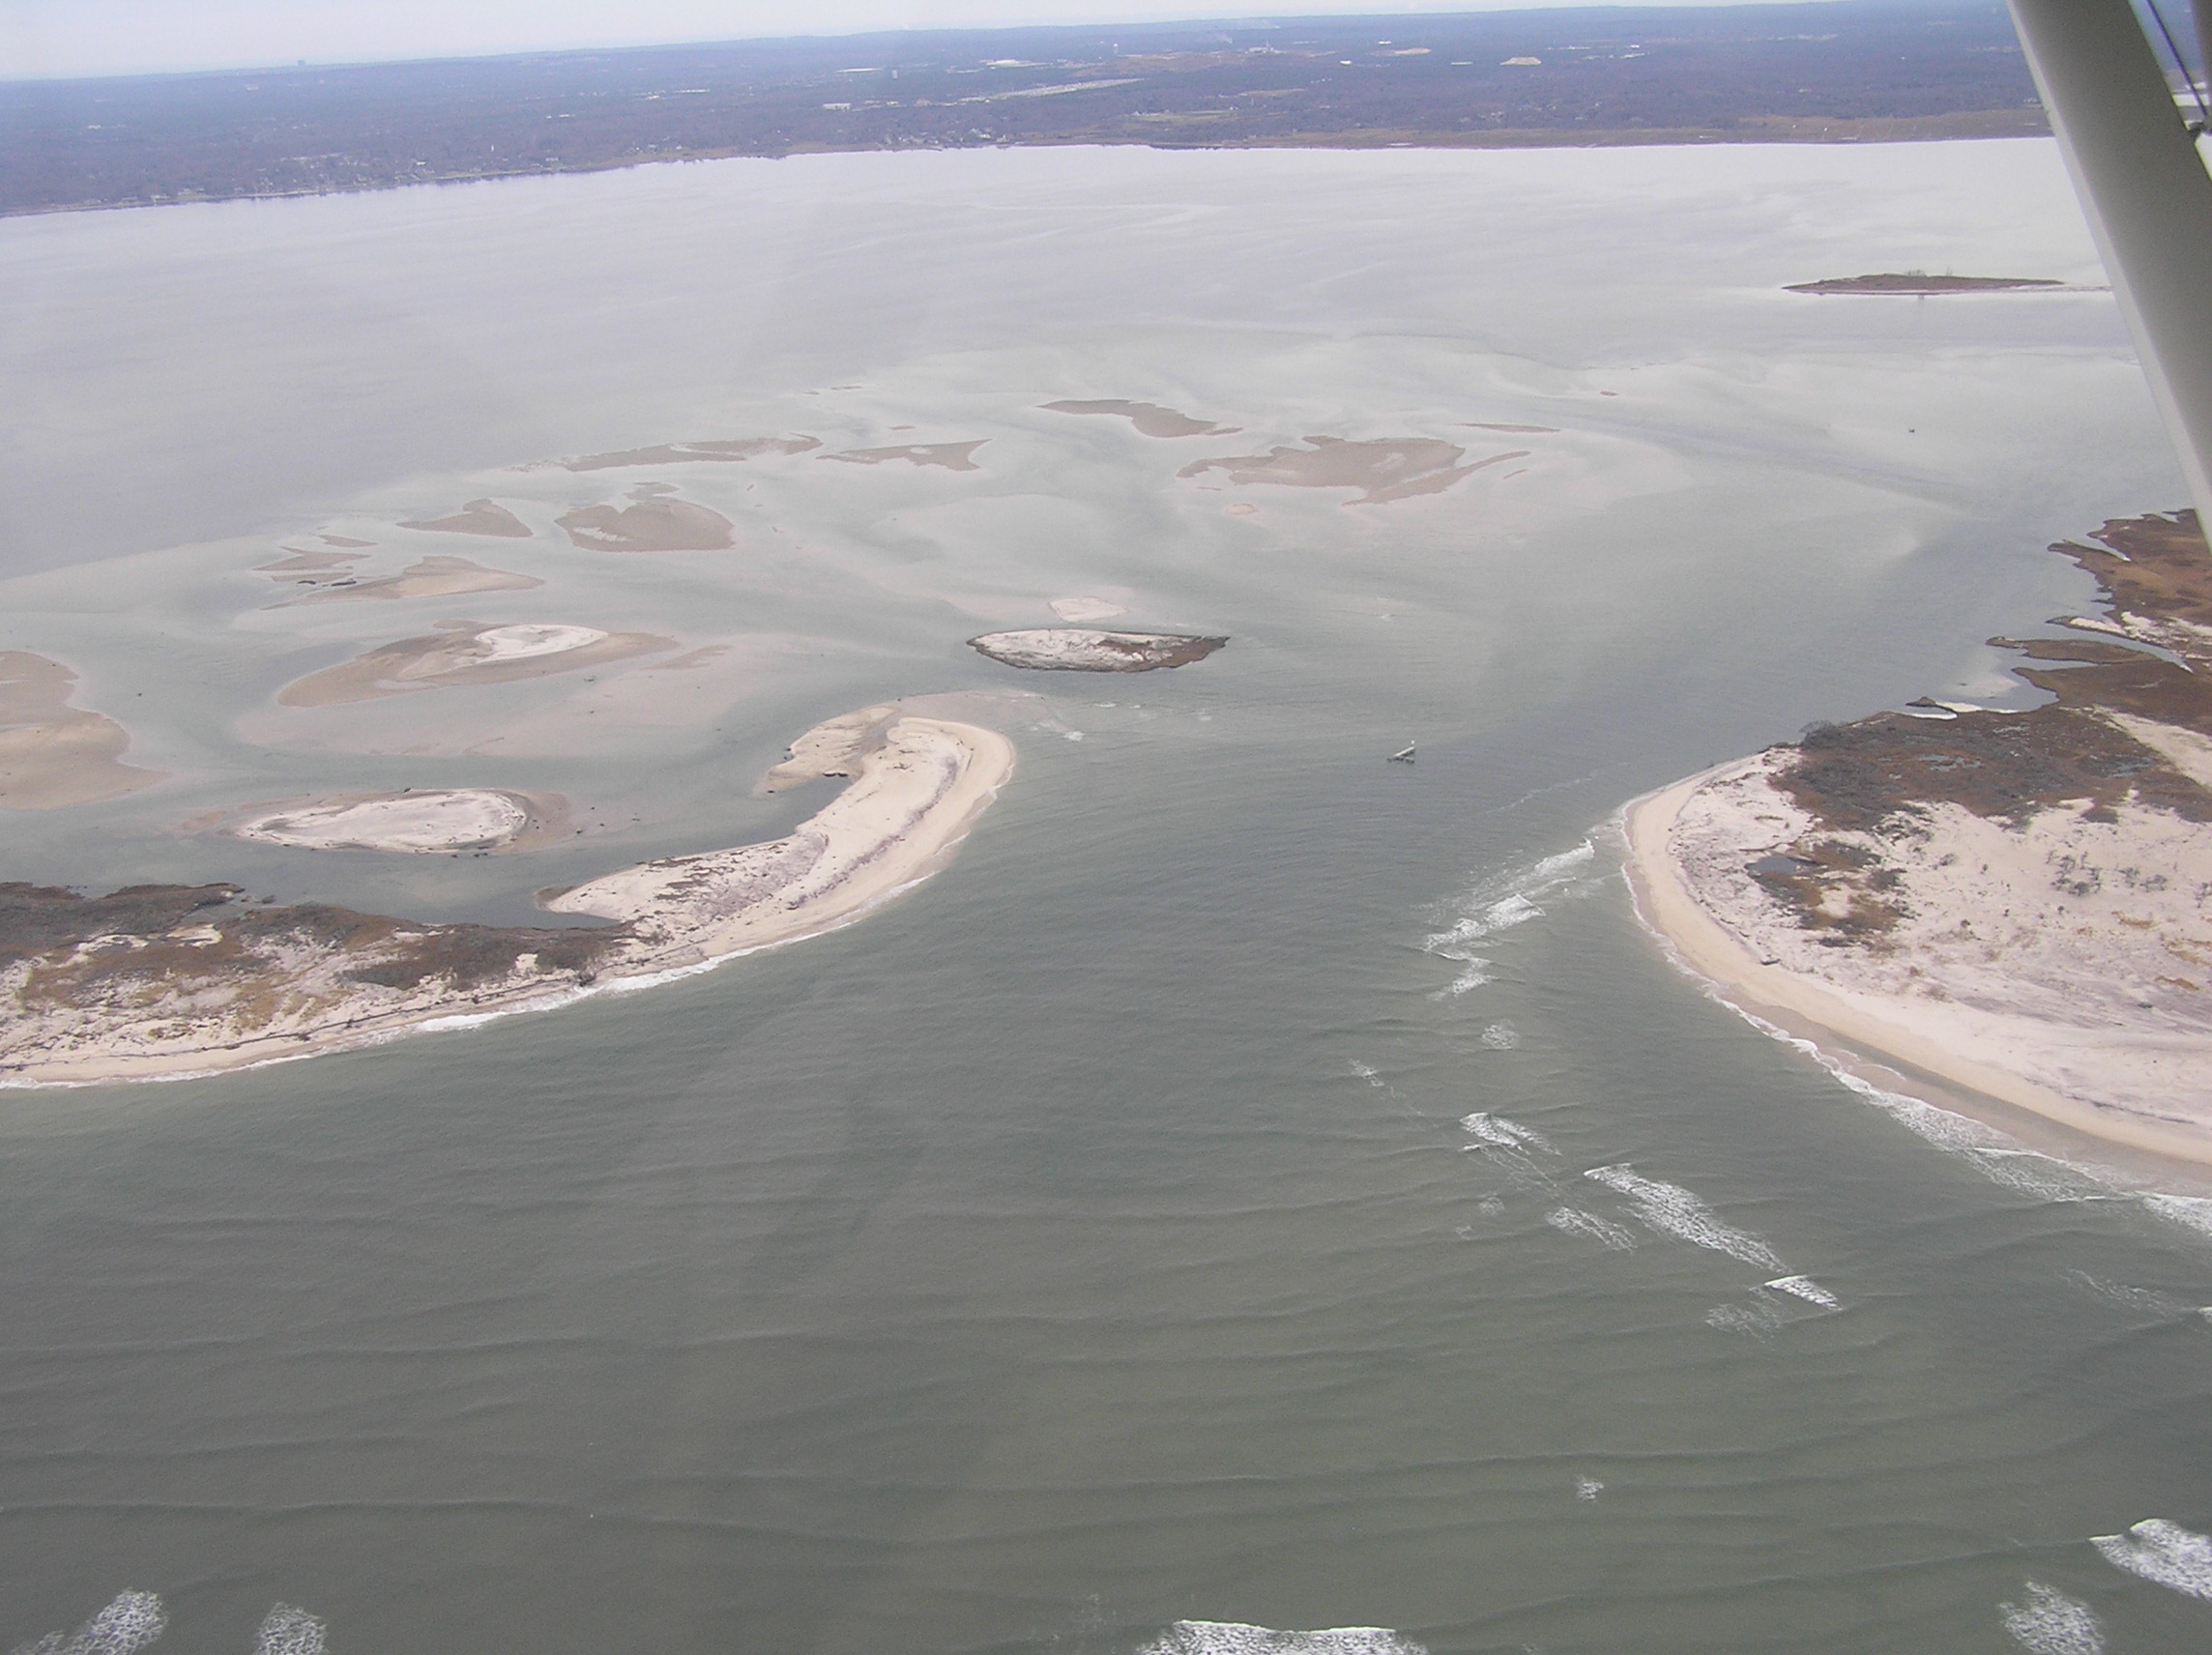 |
Dec 19, 2013 (JF&CF)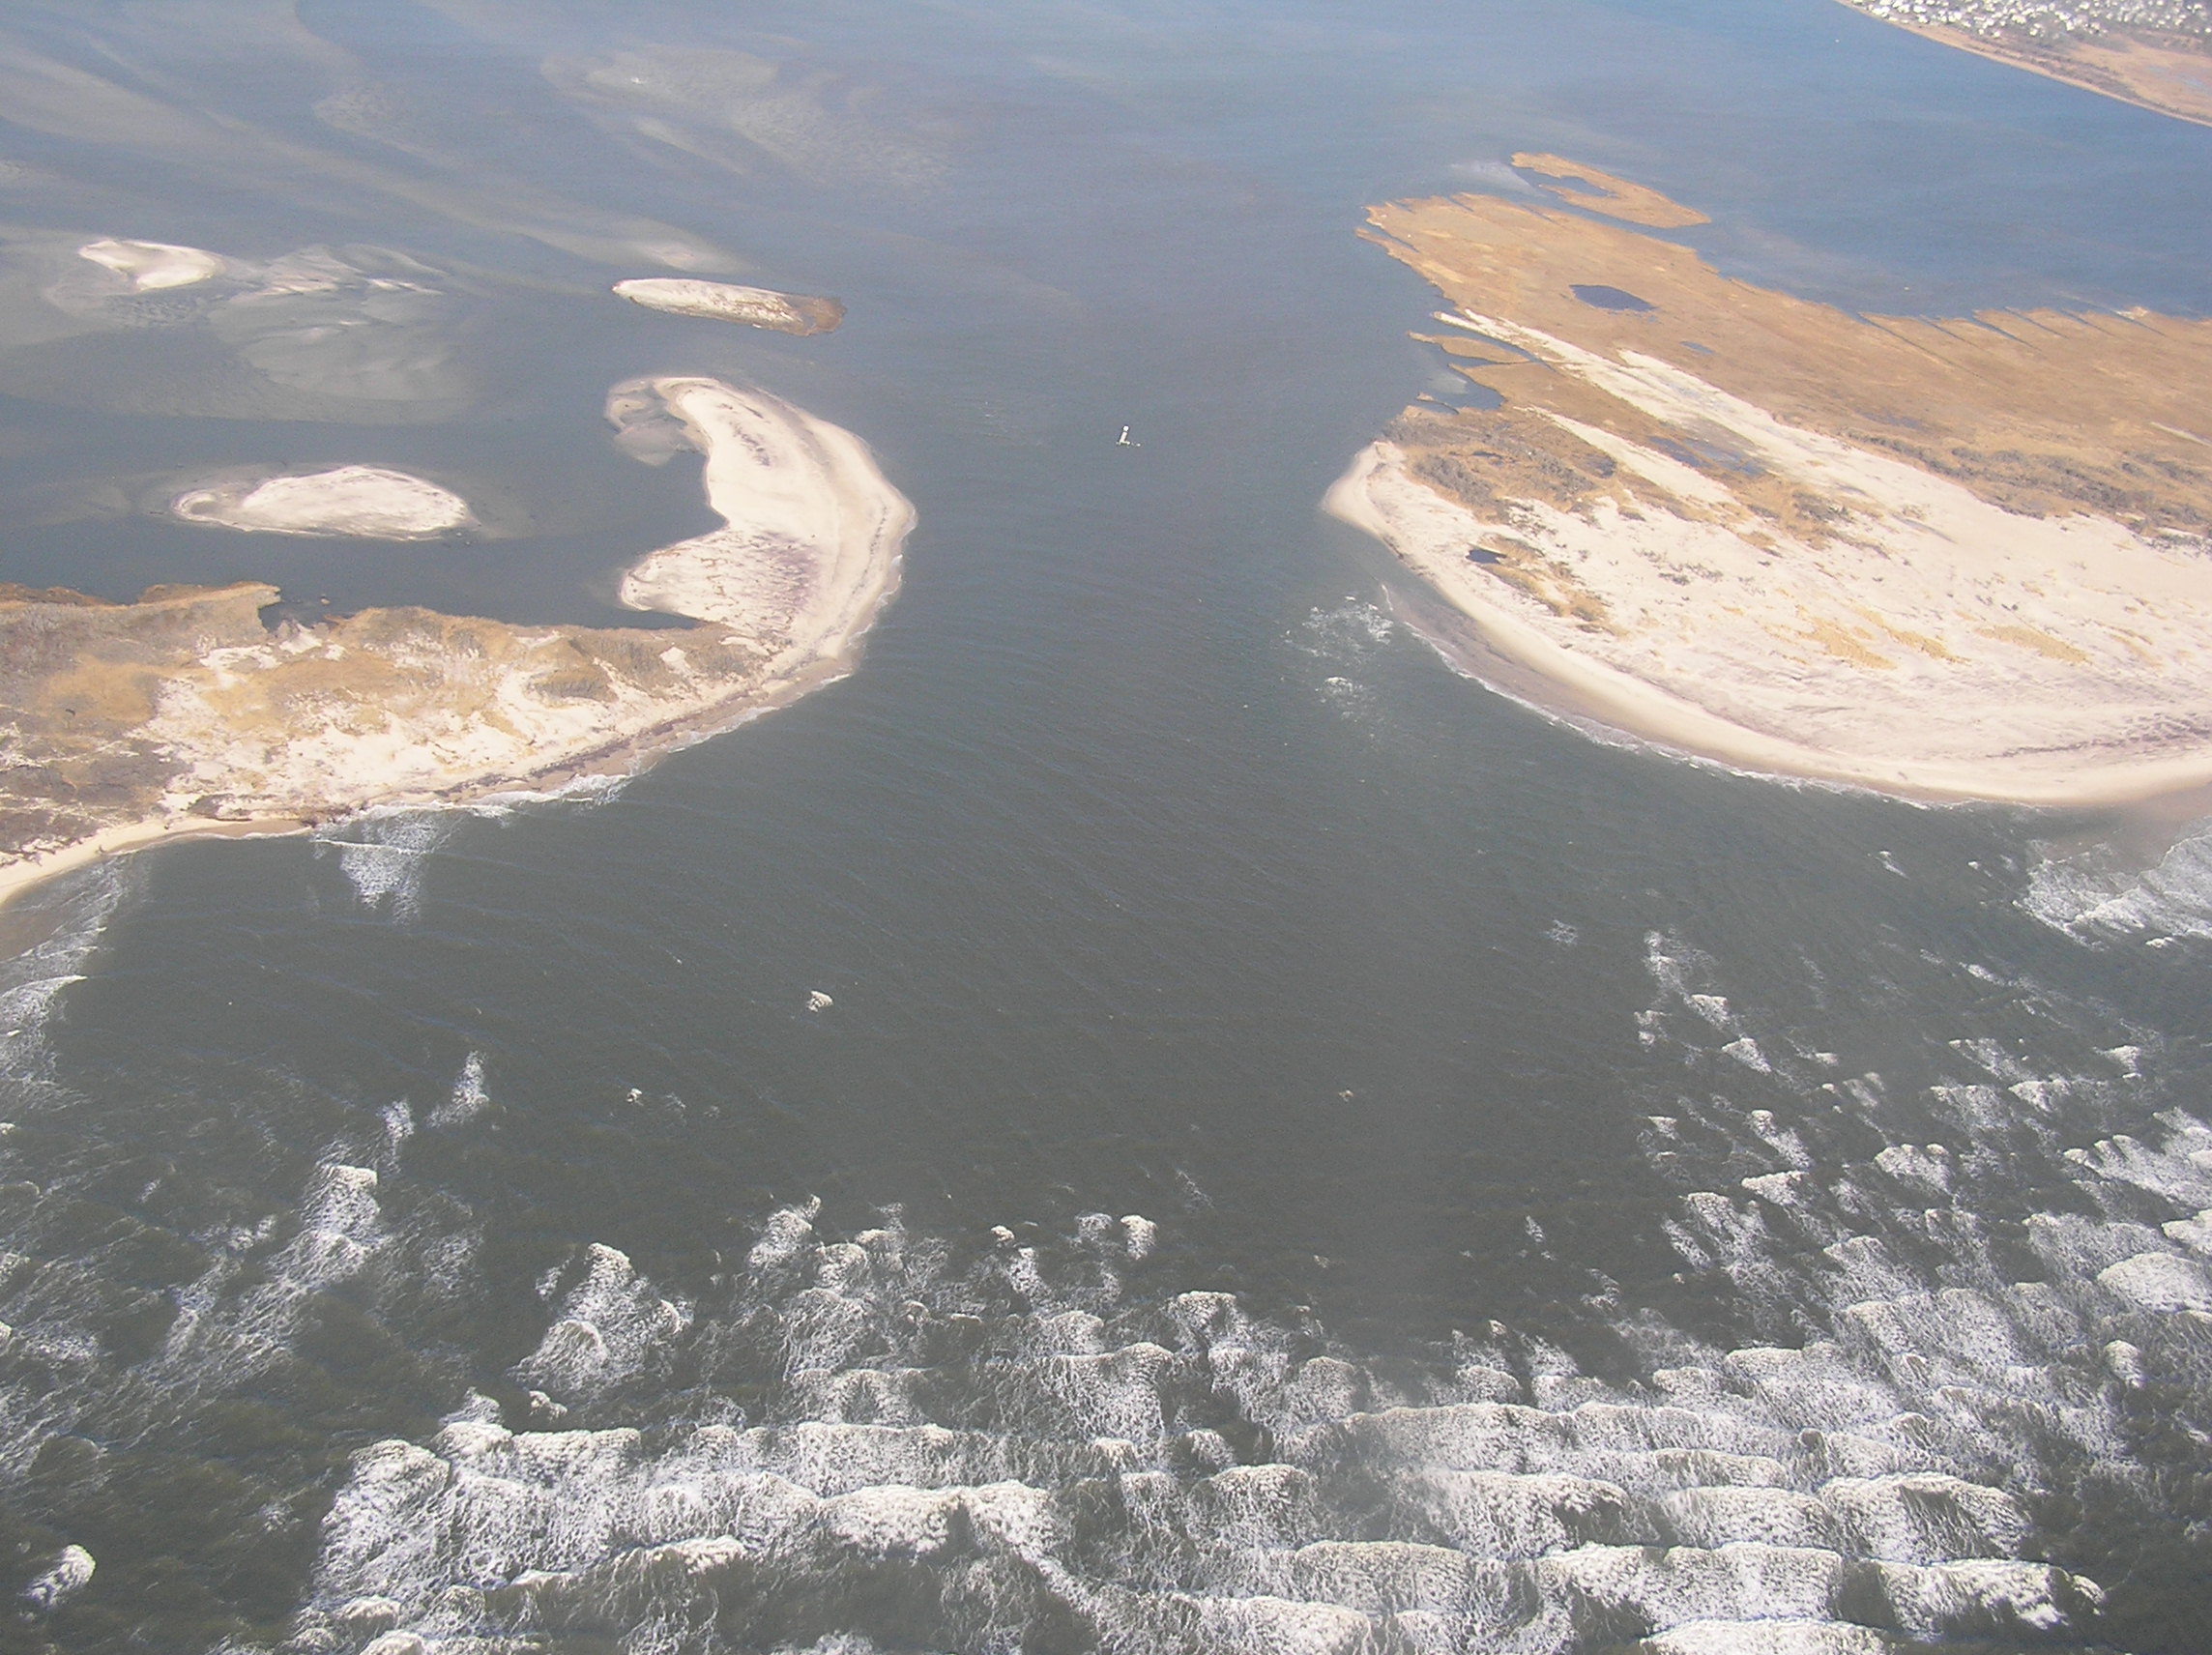 |
||||
|
Jan 8, 2013 (AL)
 |
Jan 21, 2014 (CF) |
Feb 20, 2014 (CF) |
Mar 24, 2014 (CF) |
||||
|
Apr 22, 2014 (CF)
 |
May 18, 2014 (CF) |
June 8, 2014 (CF&RG)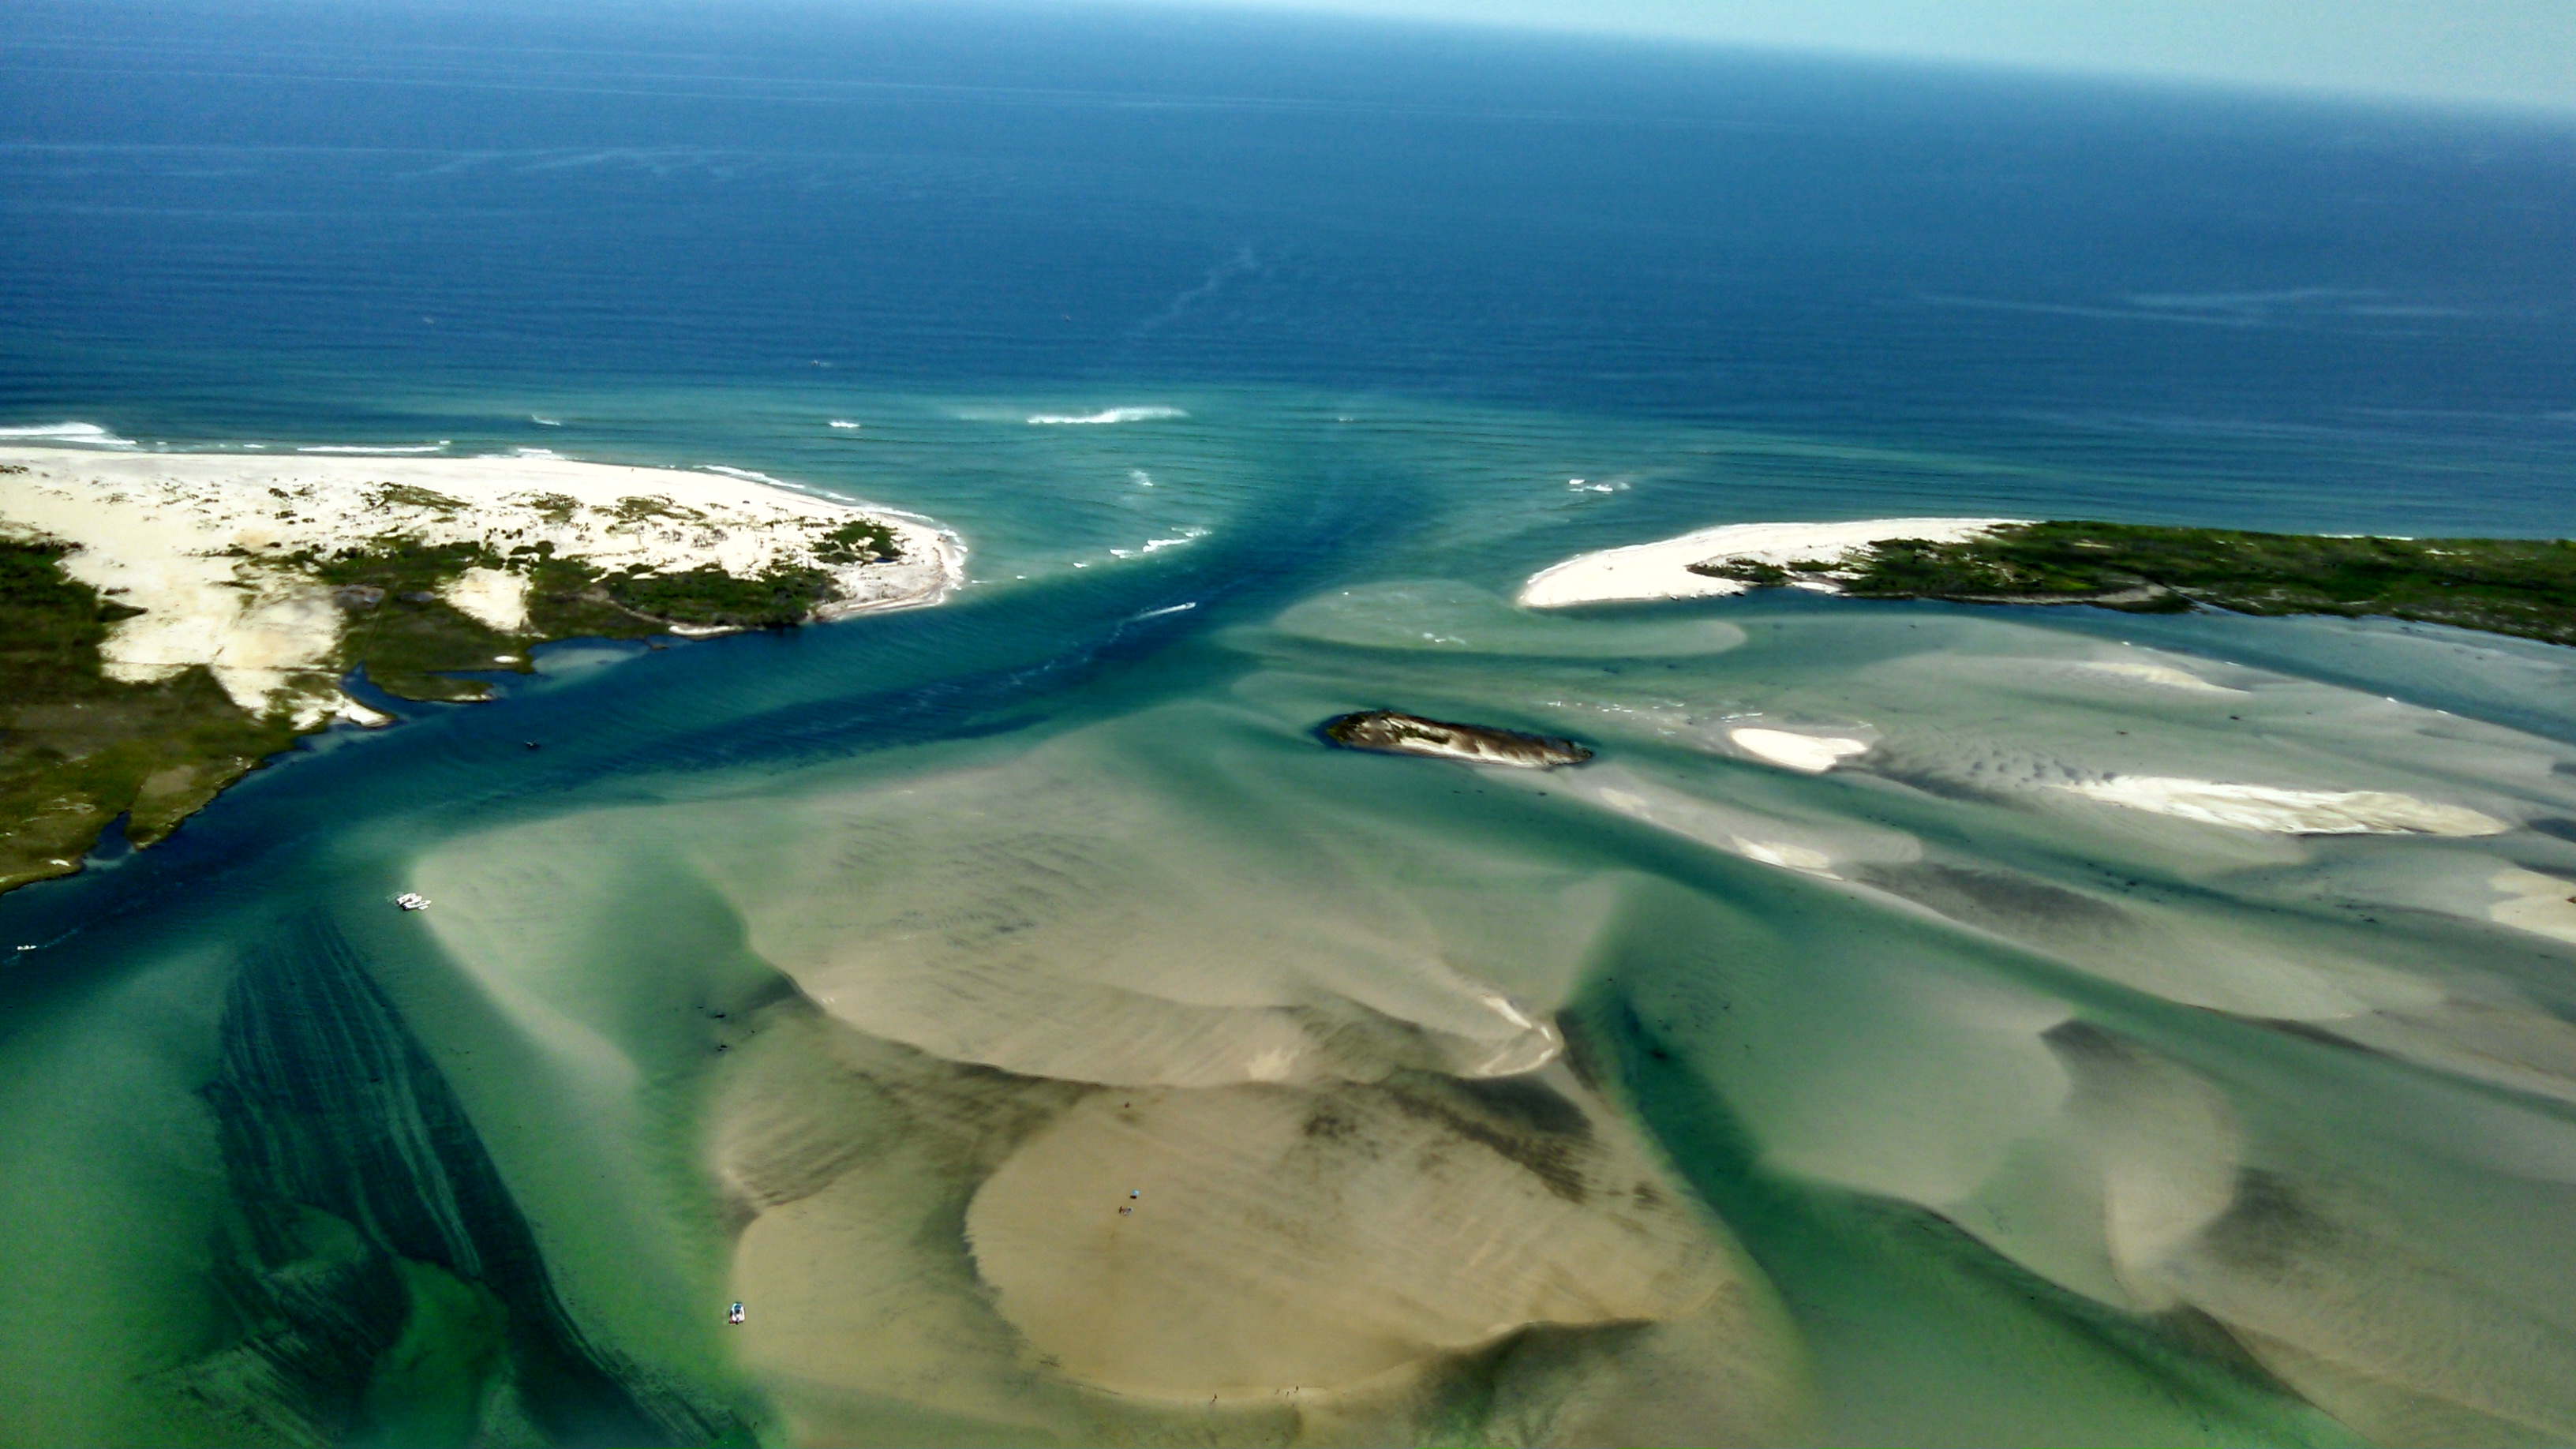 |
June 24, 2014 (CF)
 |
||||
July 31, 2014 (CF&RG)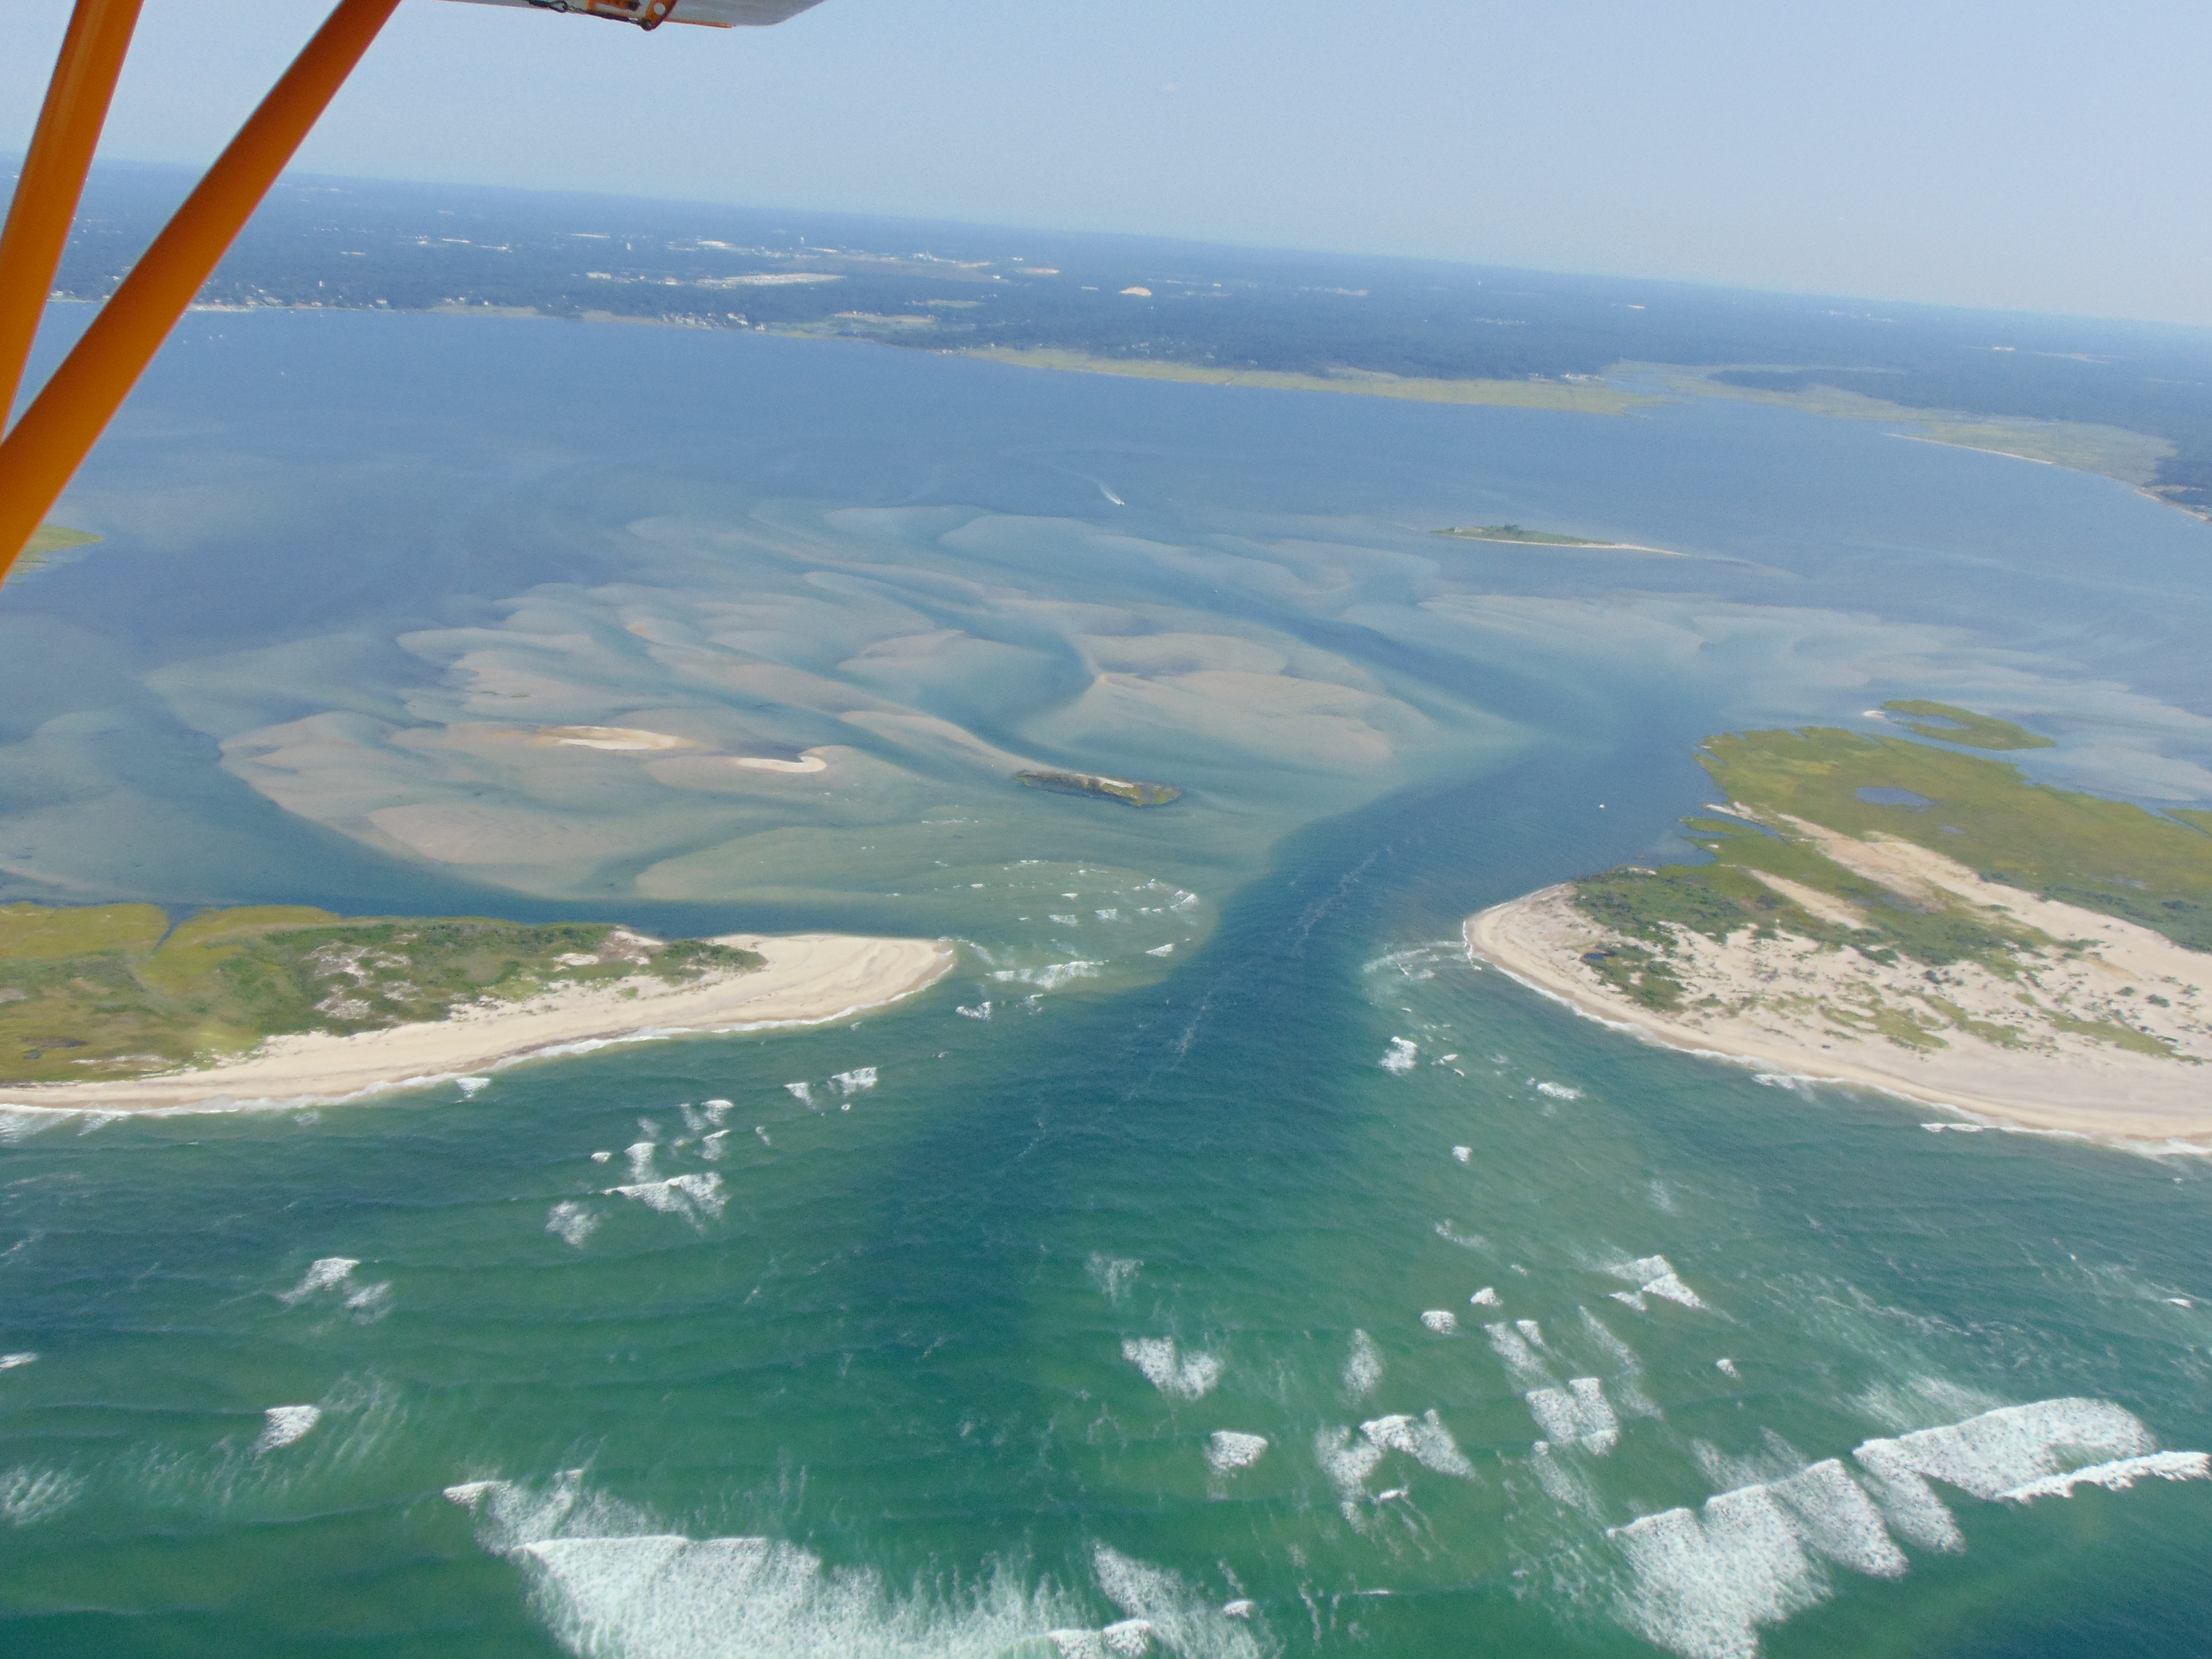 |
Aug 28, 2014 (CF)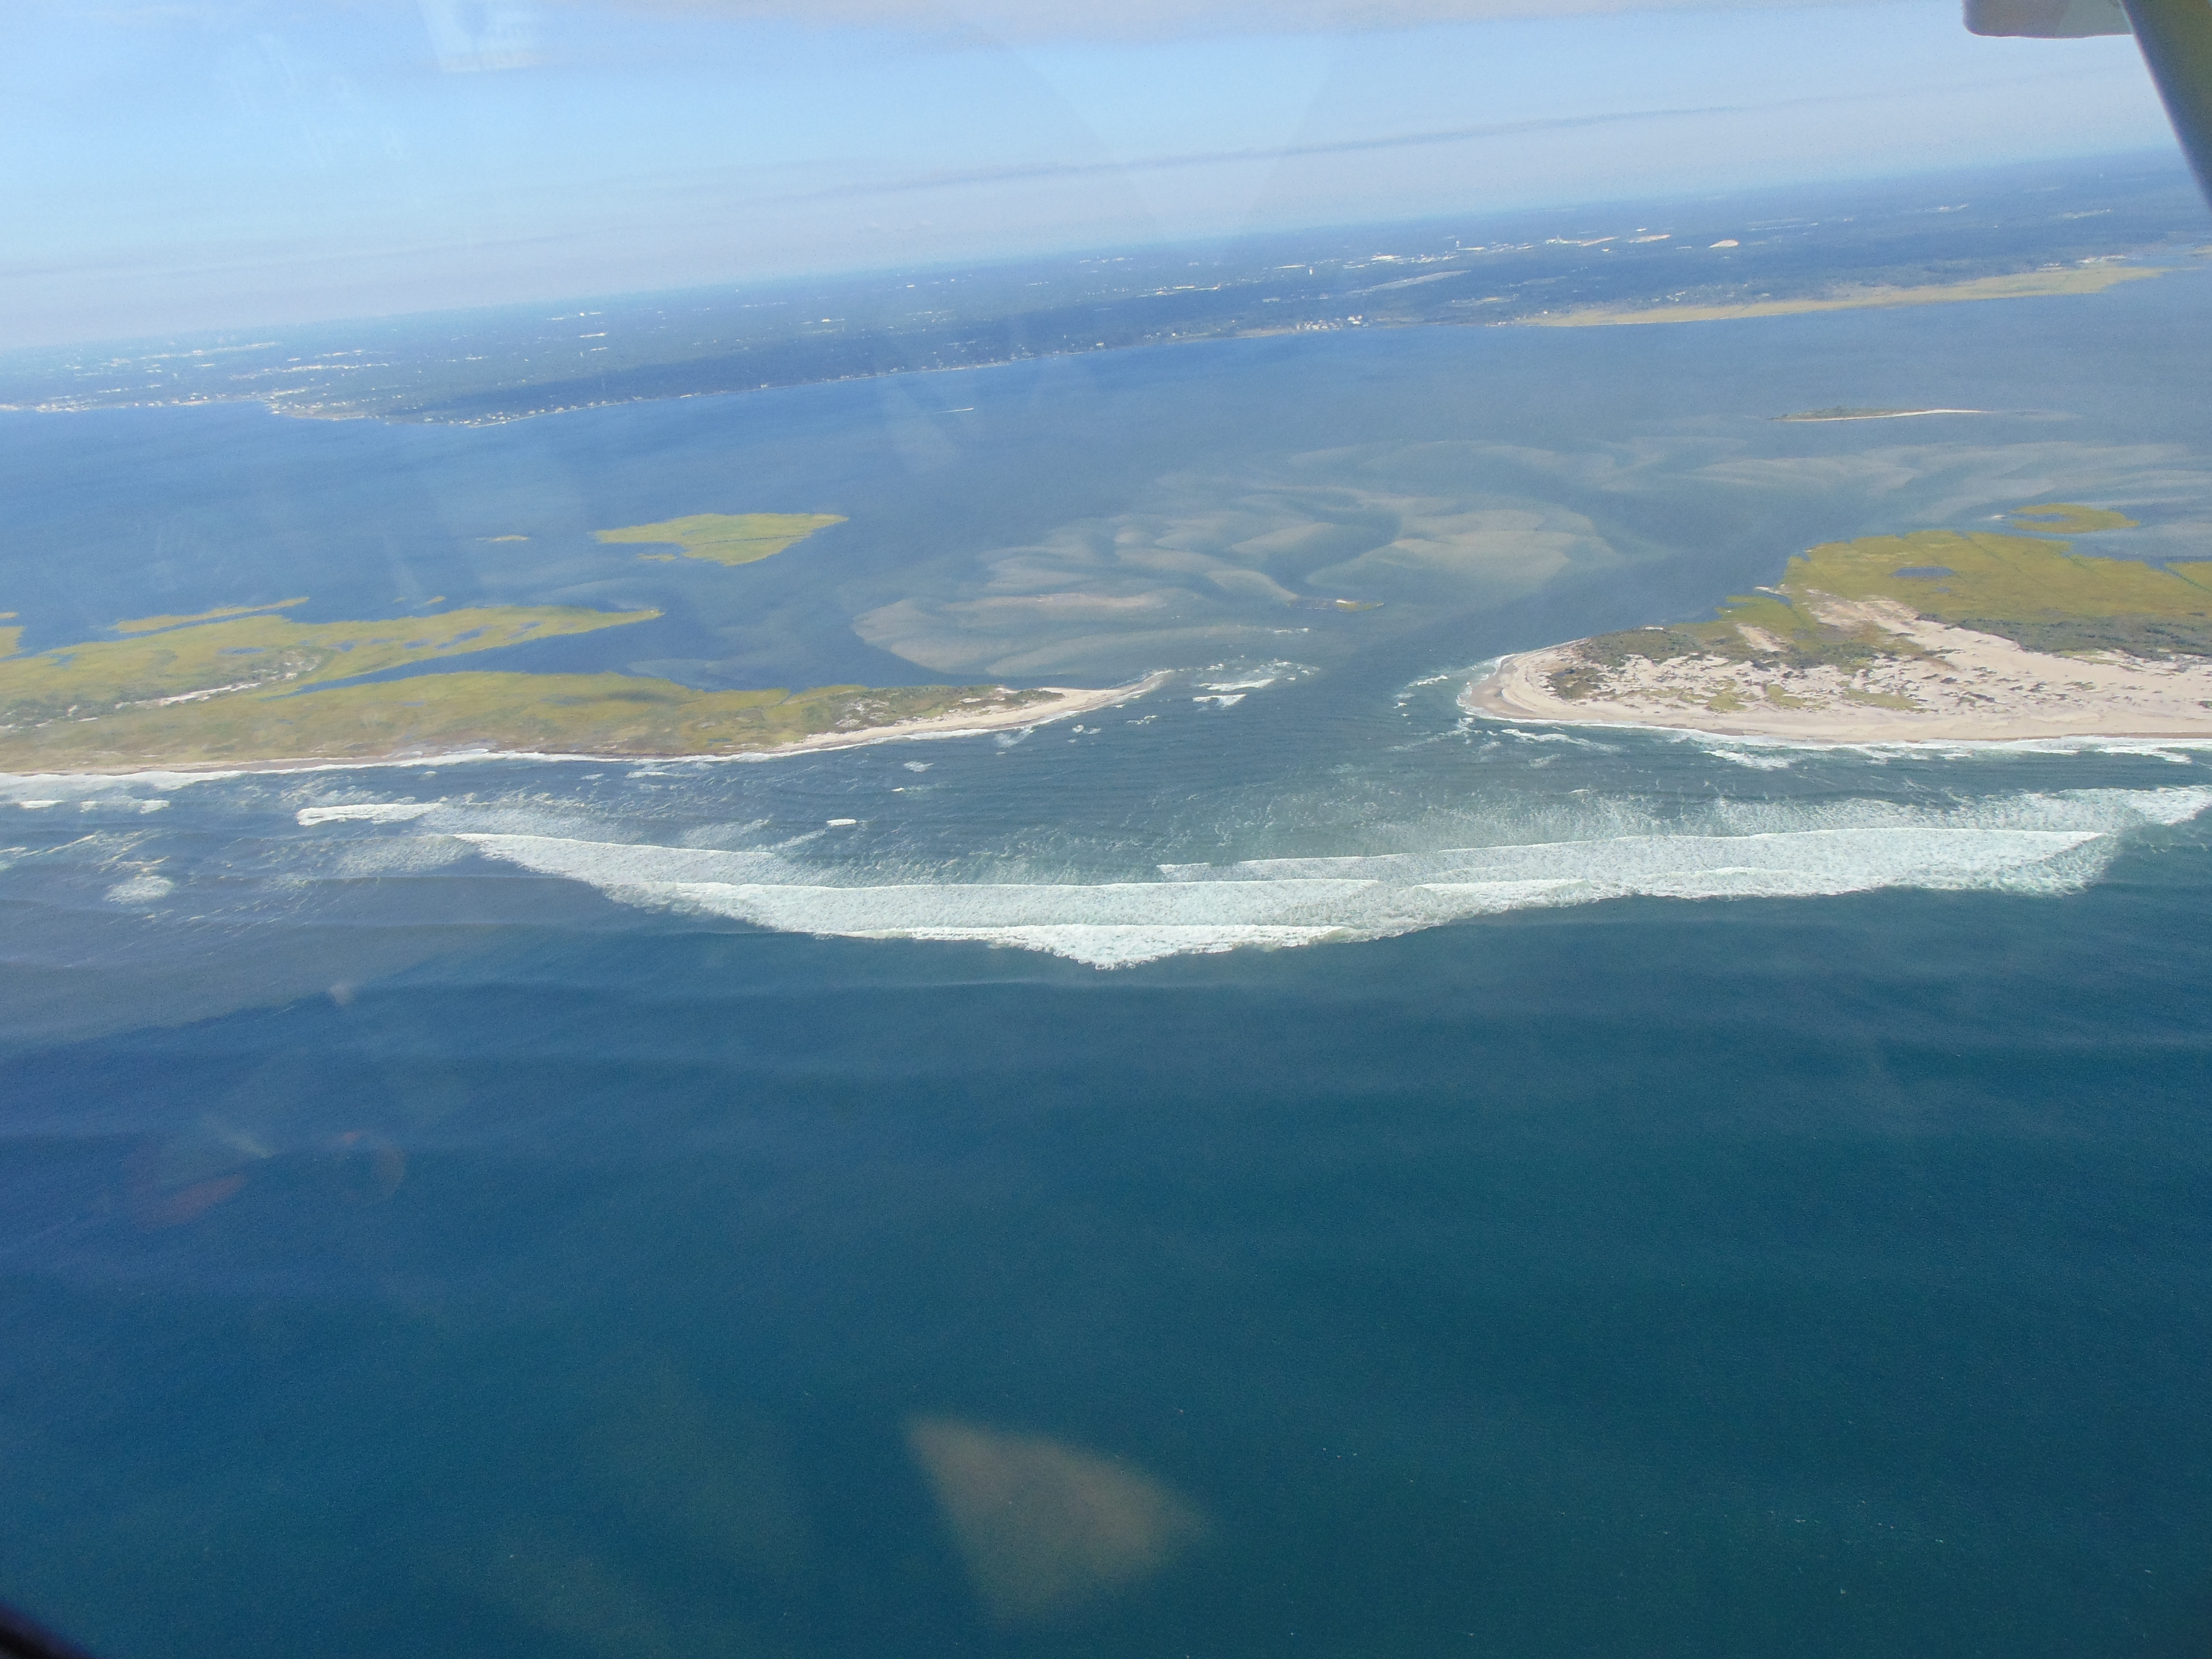 |
Sept 8, 2014 (JV)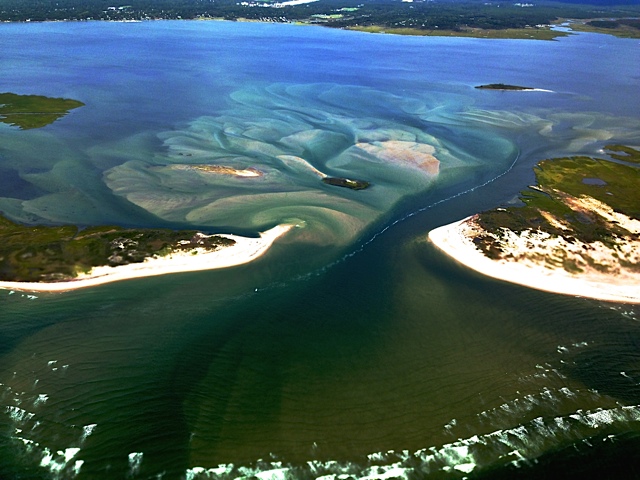 |
Sept 26, 2014 (CF)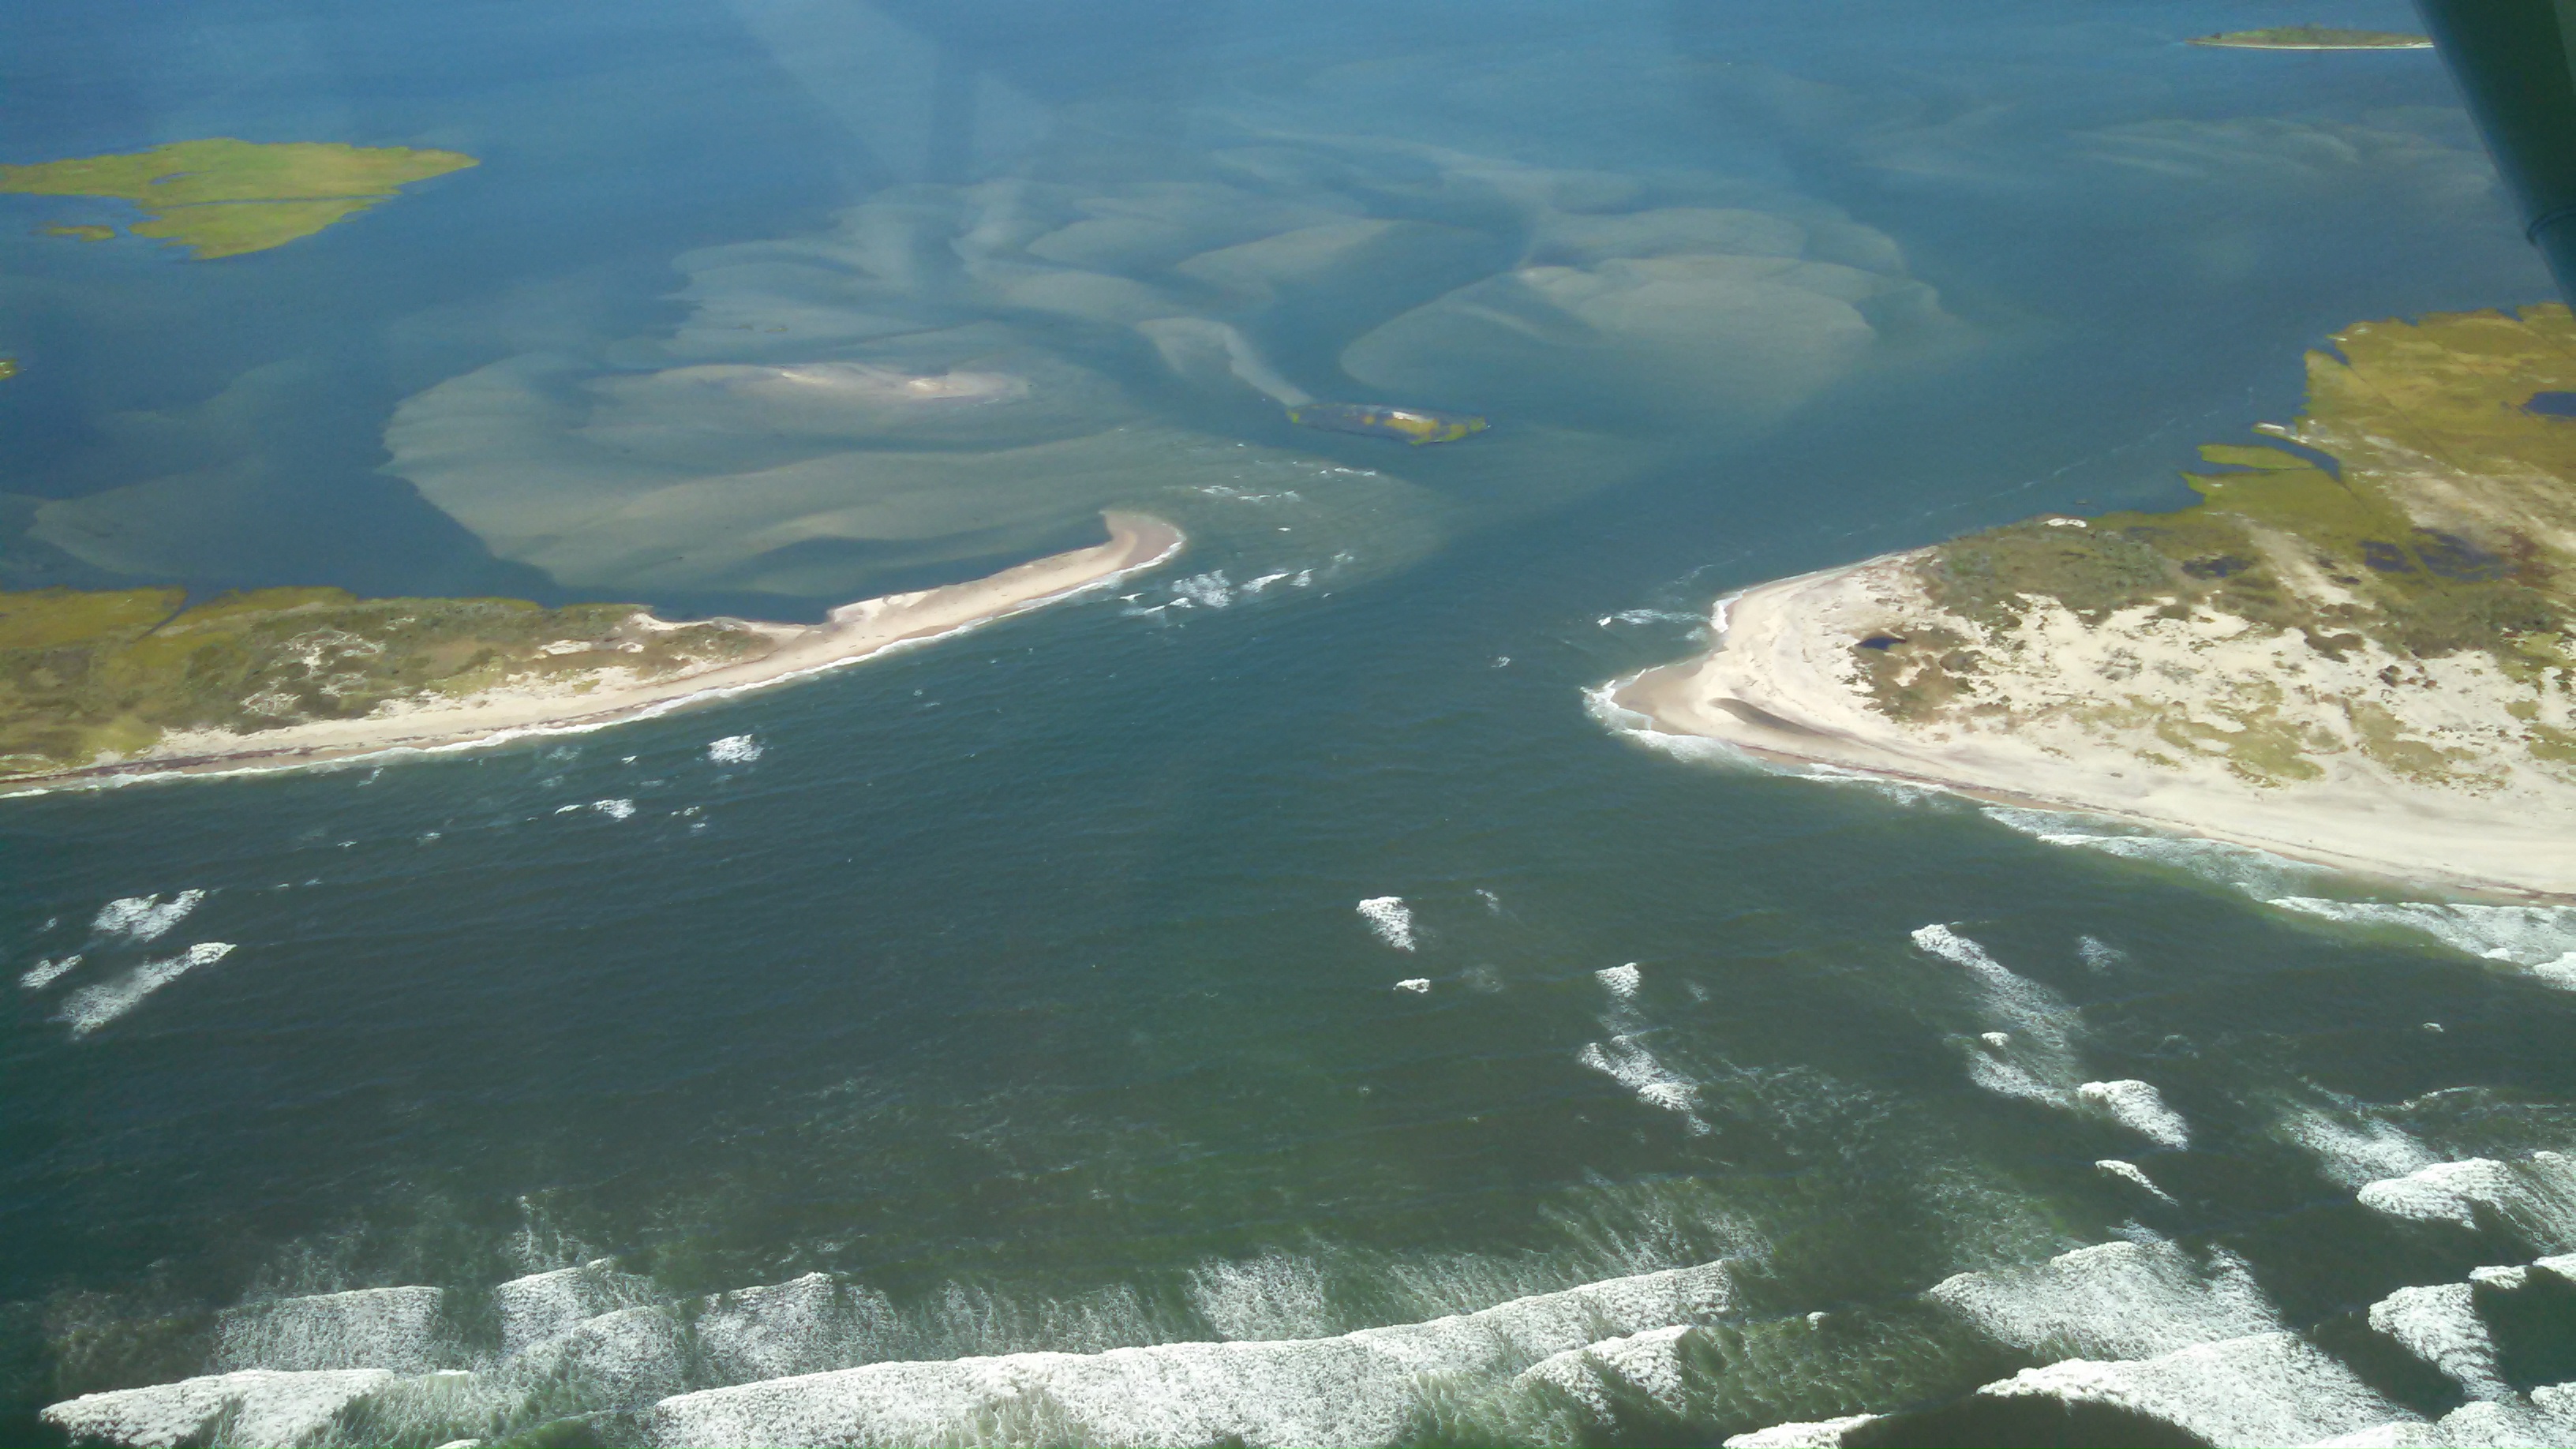 |
||||
Oct 30, 2014 (CF)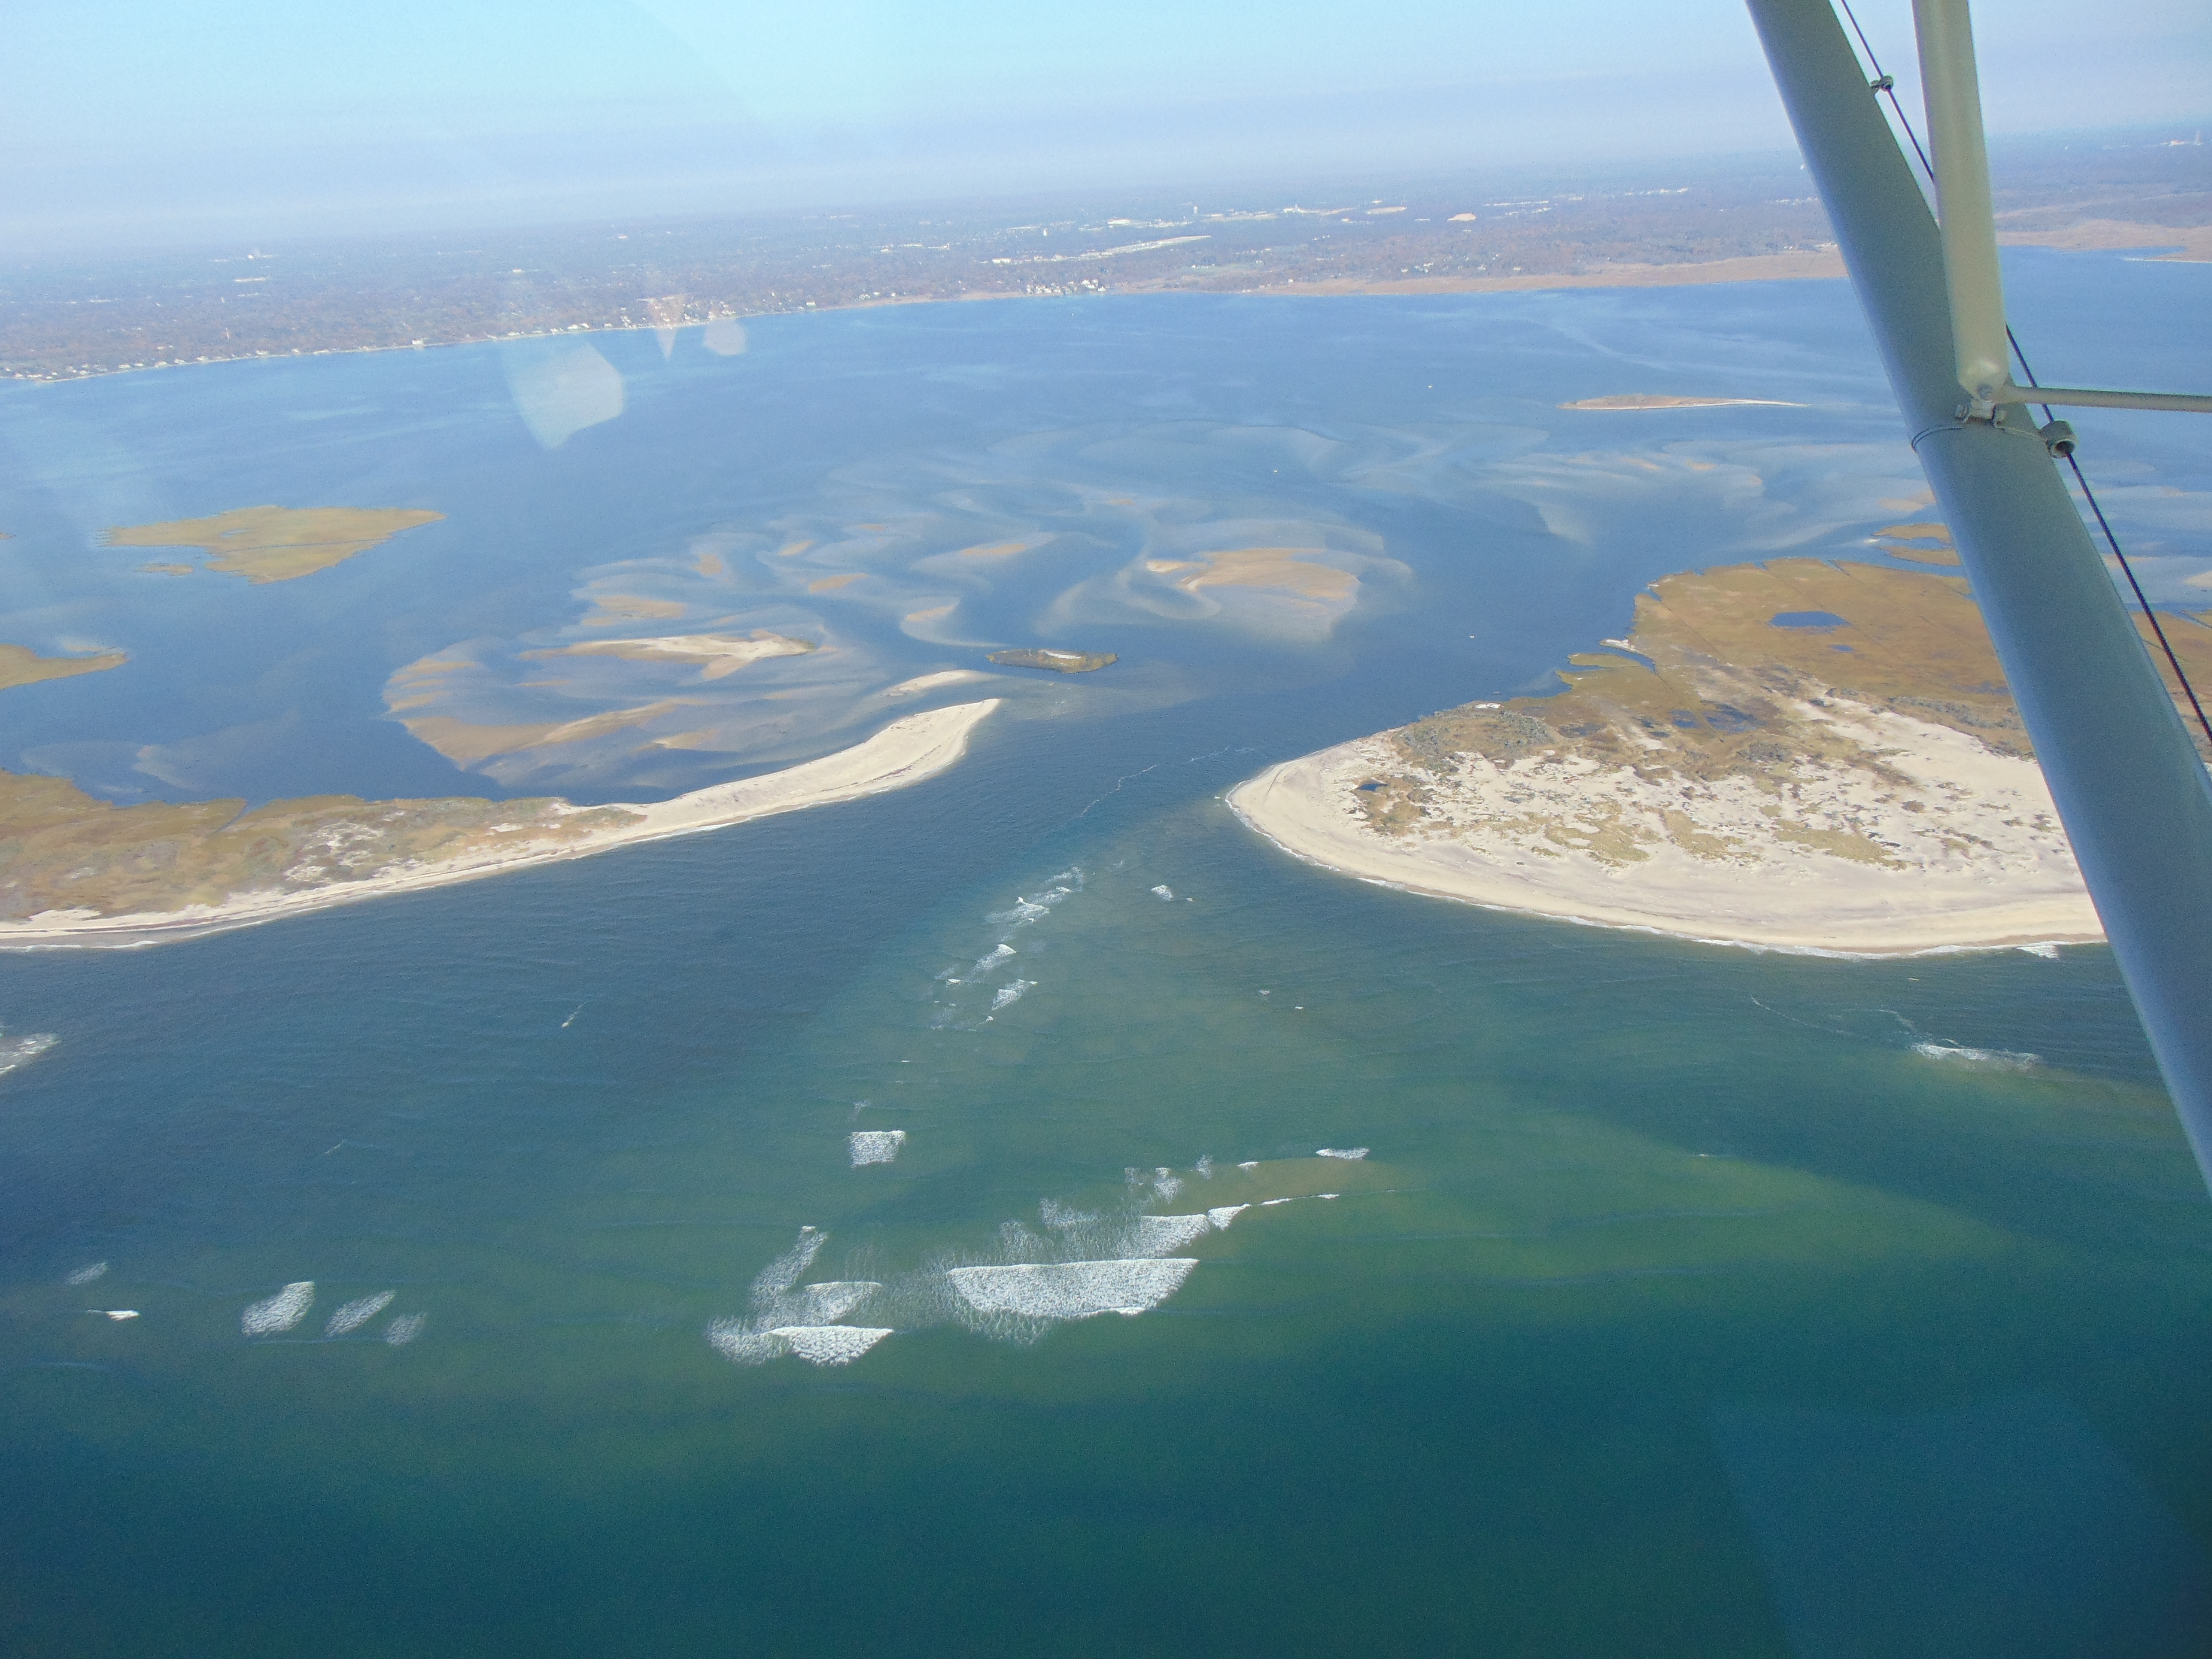 |
Nov 30, 2014 (ASF&CF) |
Dec 14, 2014 (CF)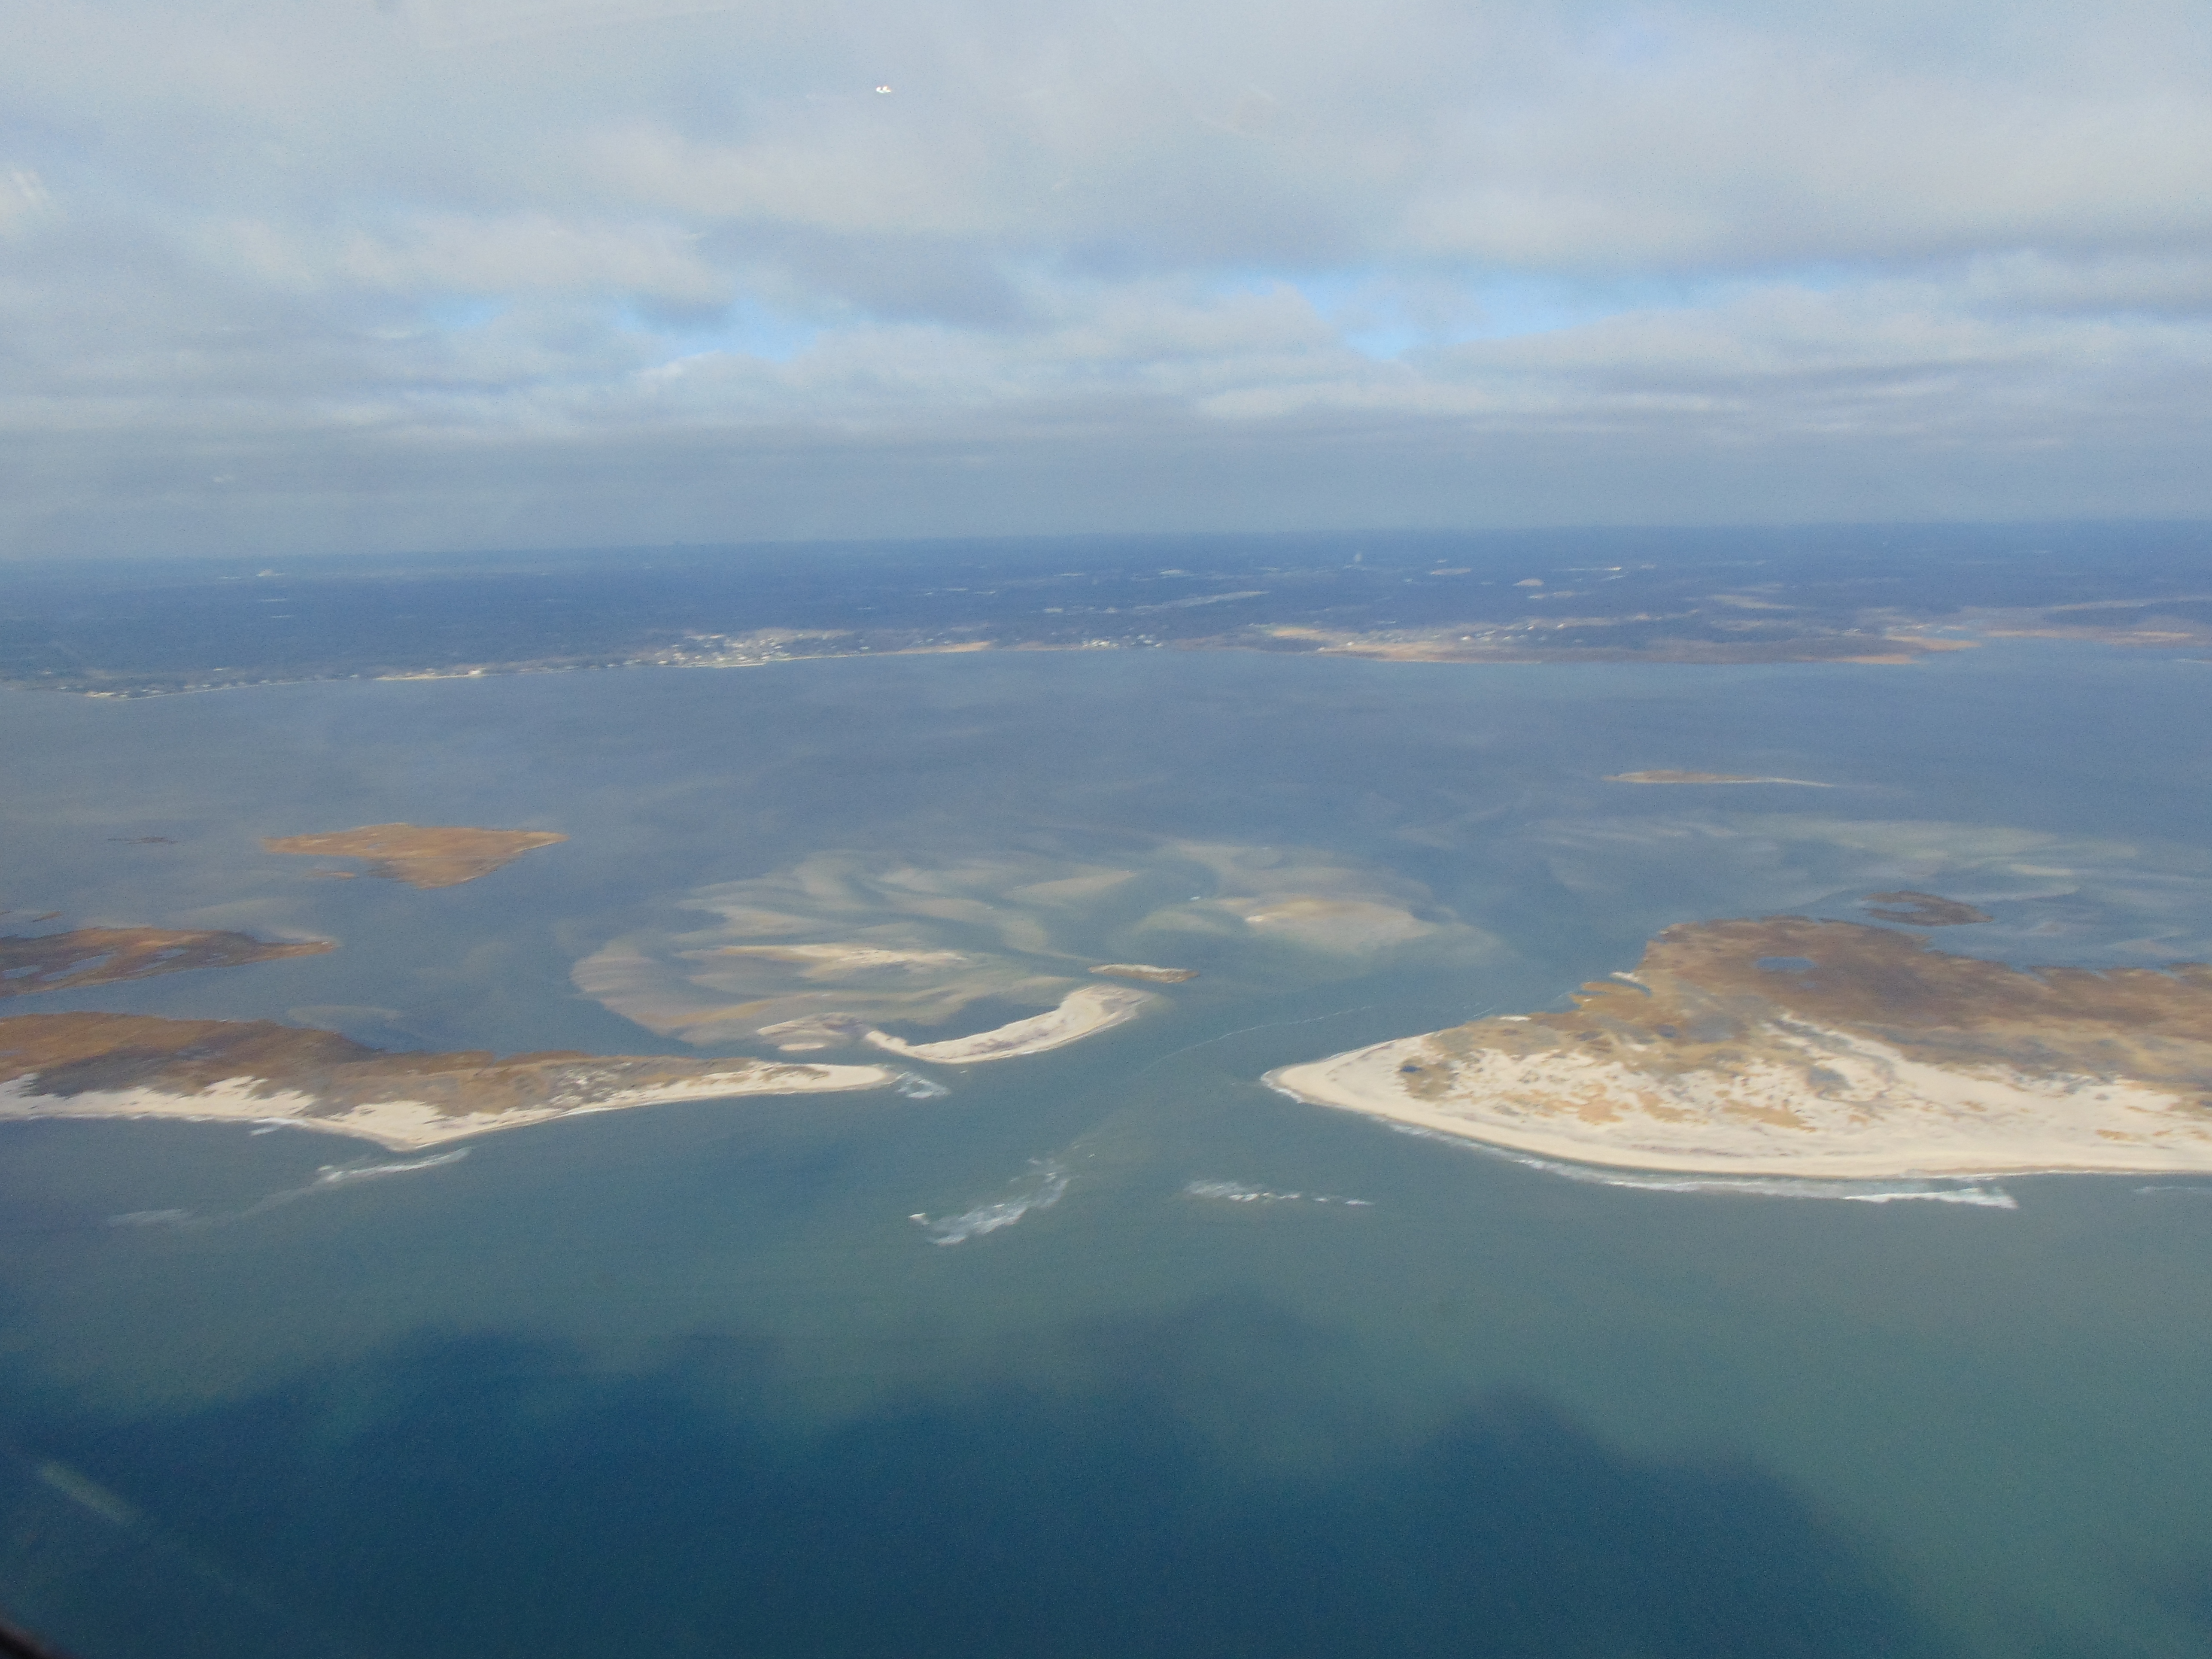 |
Dec 29,2014 (RS&CF)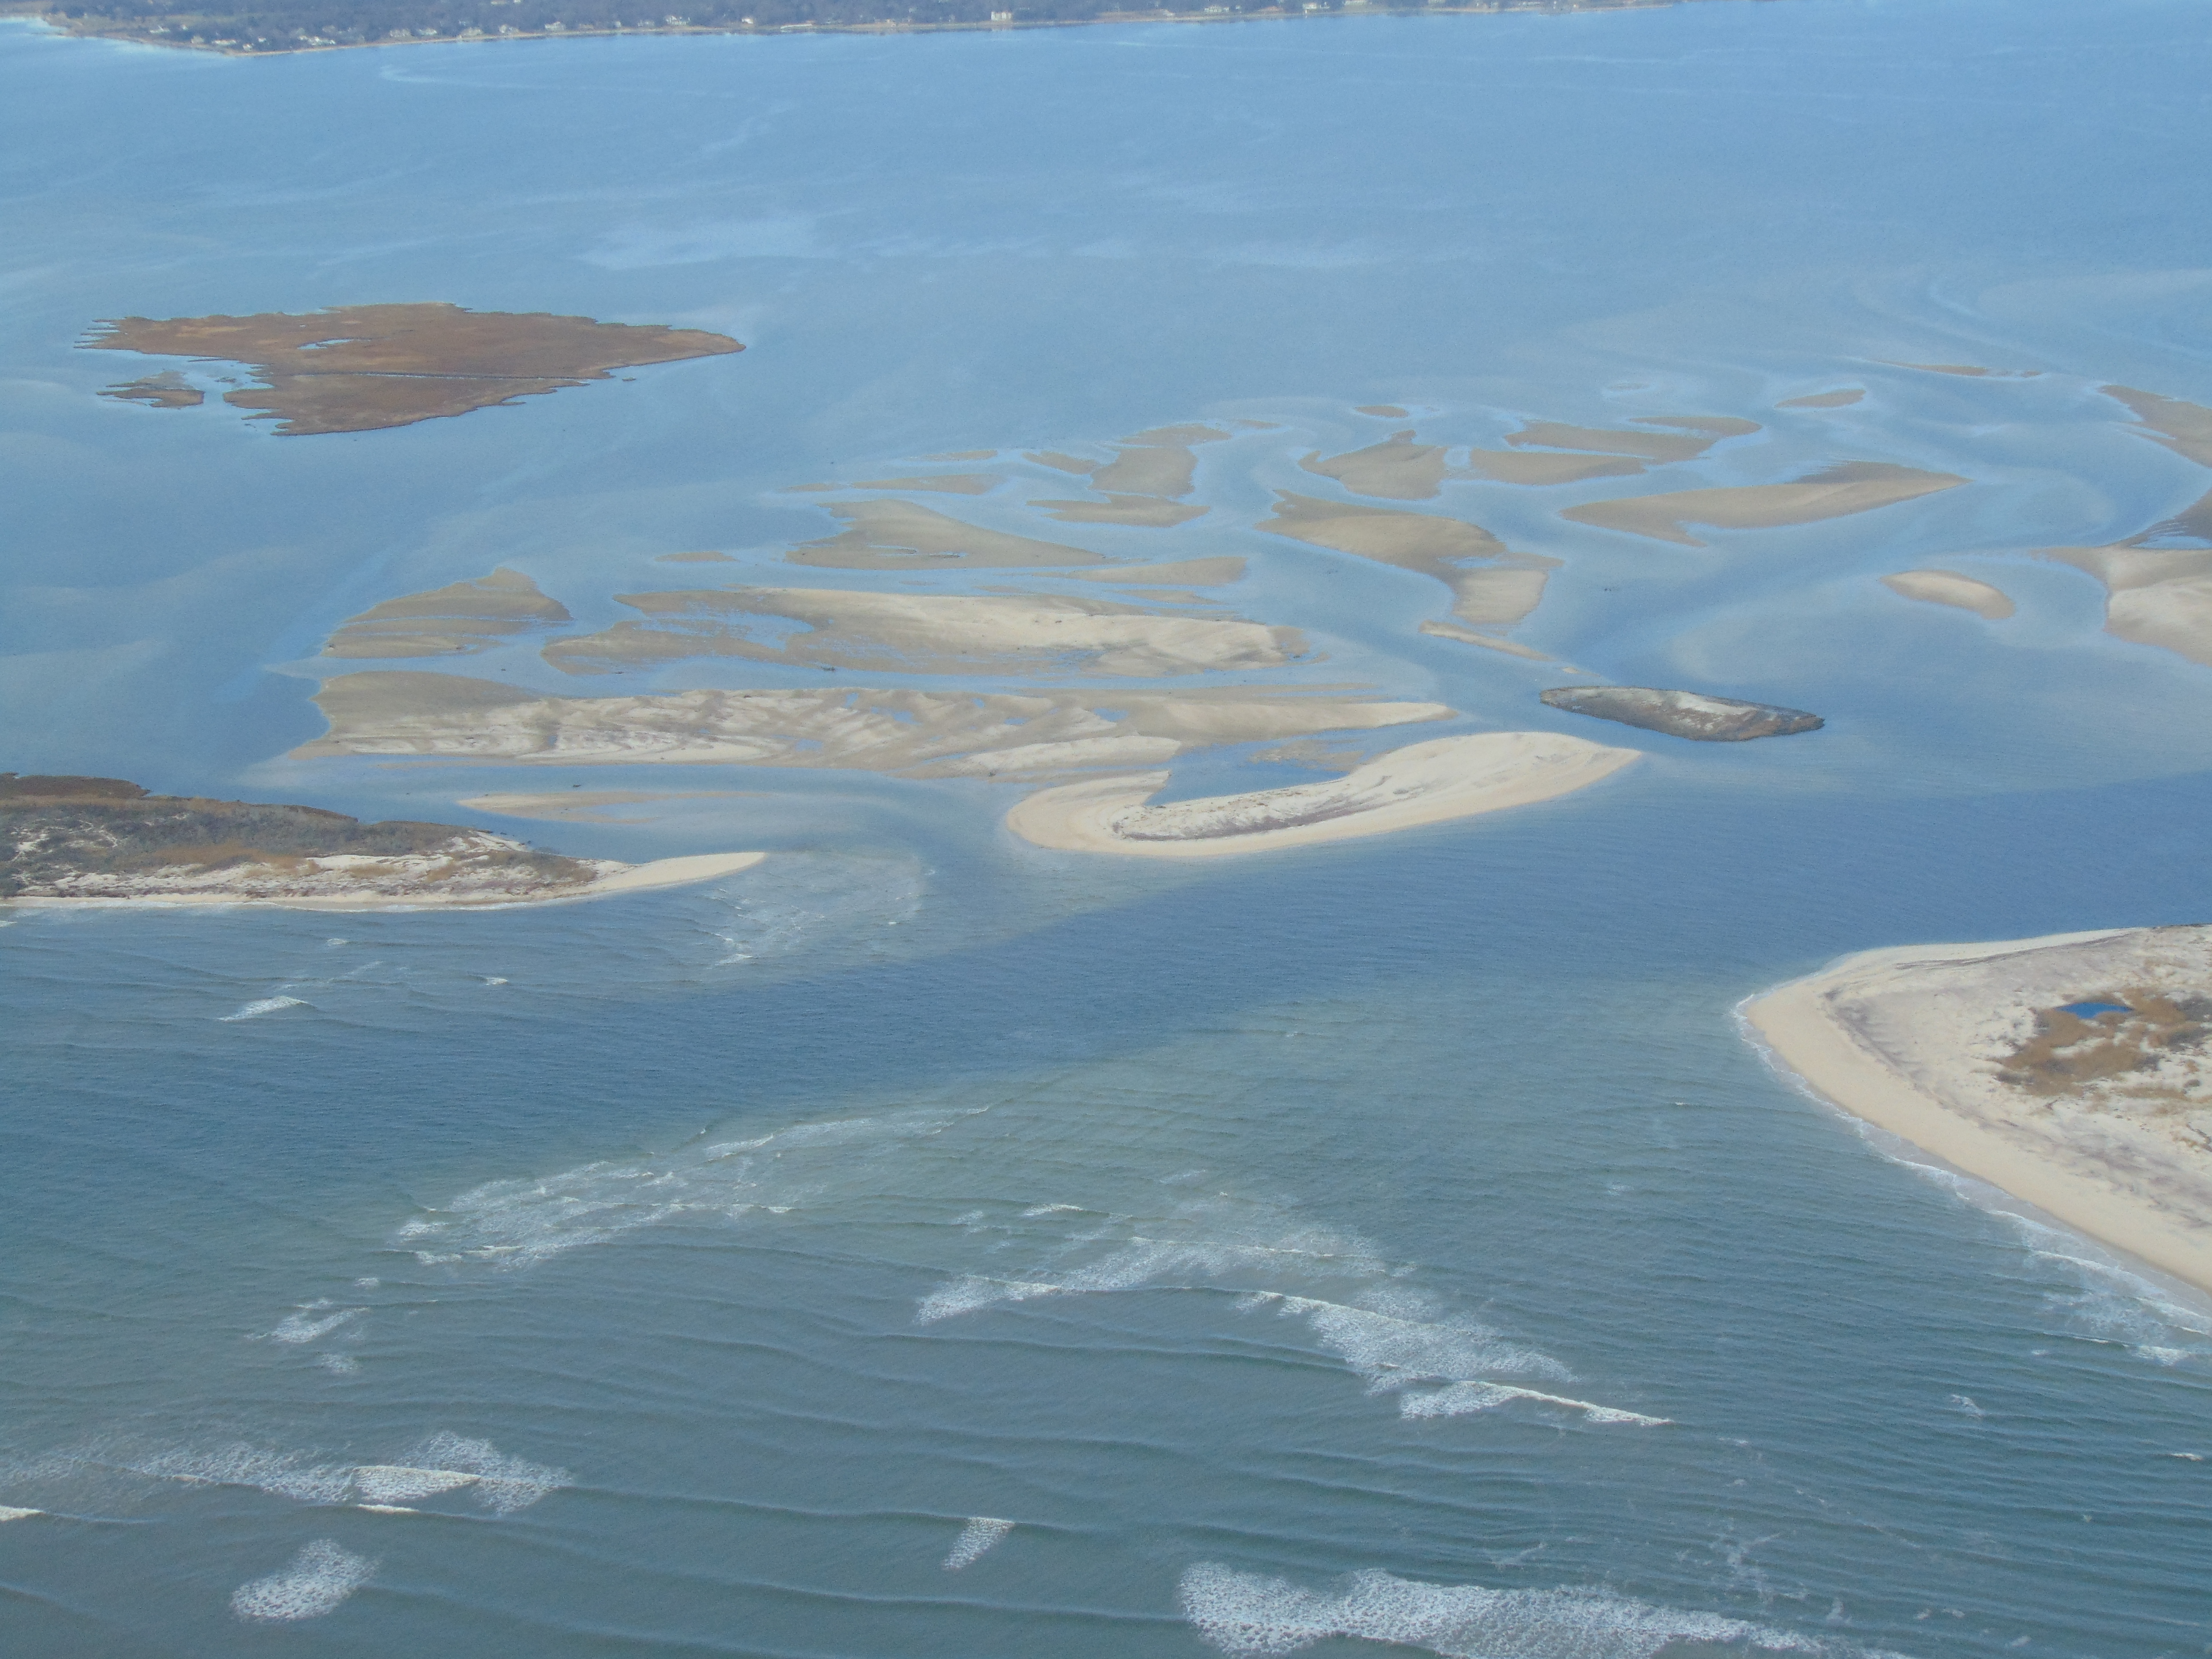 |
||||
Jan 17, 2015 (JV&SCPD)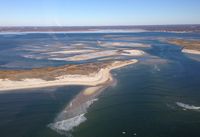 |
Jan 29, 2015 (RG)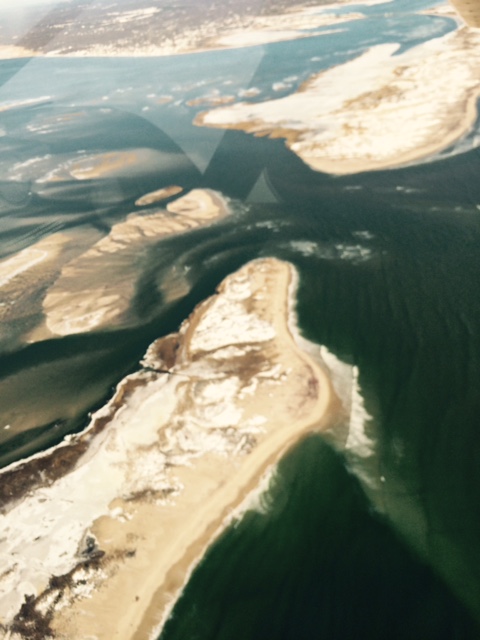 |
Feb 28, 2015
(CF)
|
Mar 29. 2015 (CF)
|
||||
Apr 6, 2015 (JV)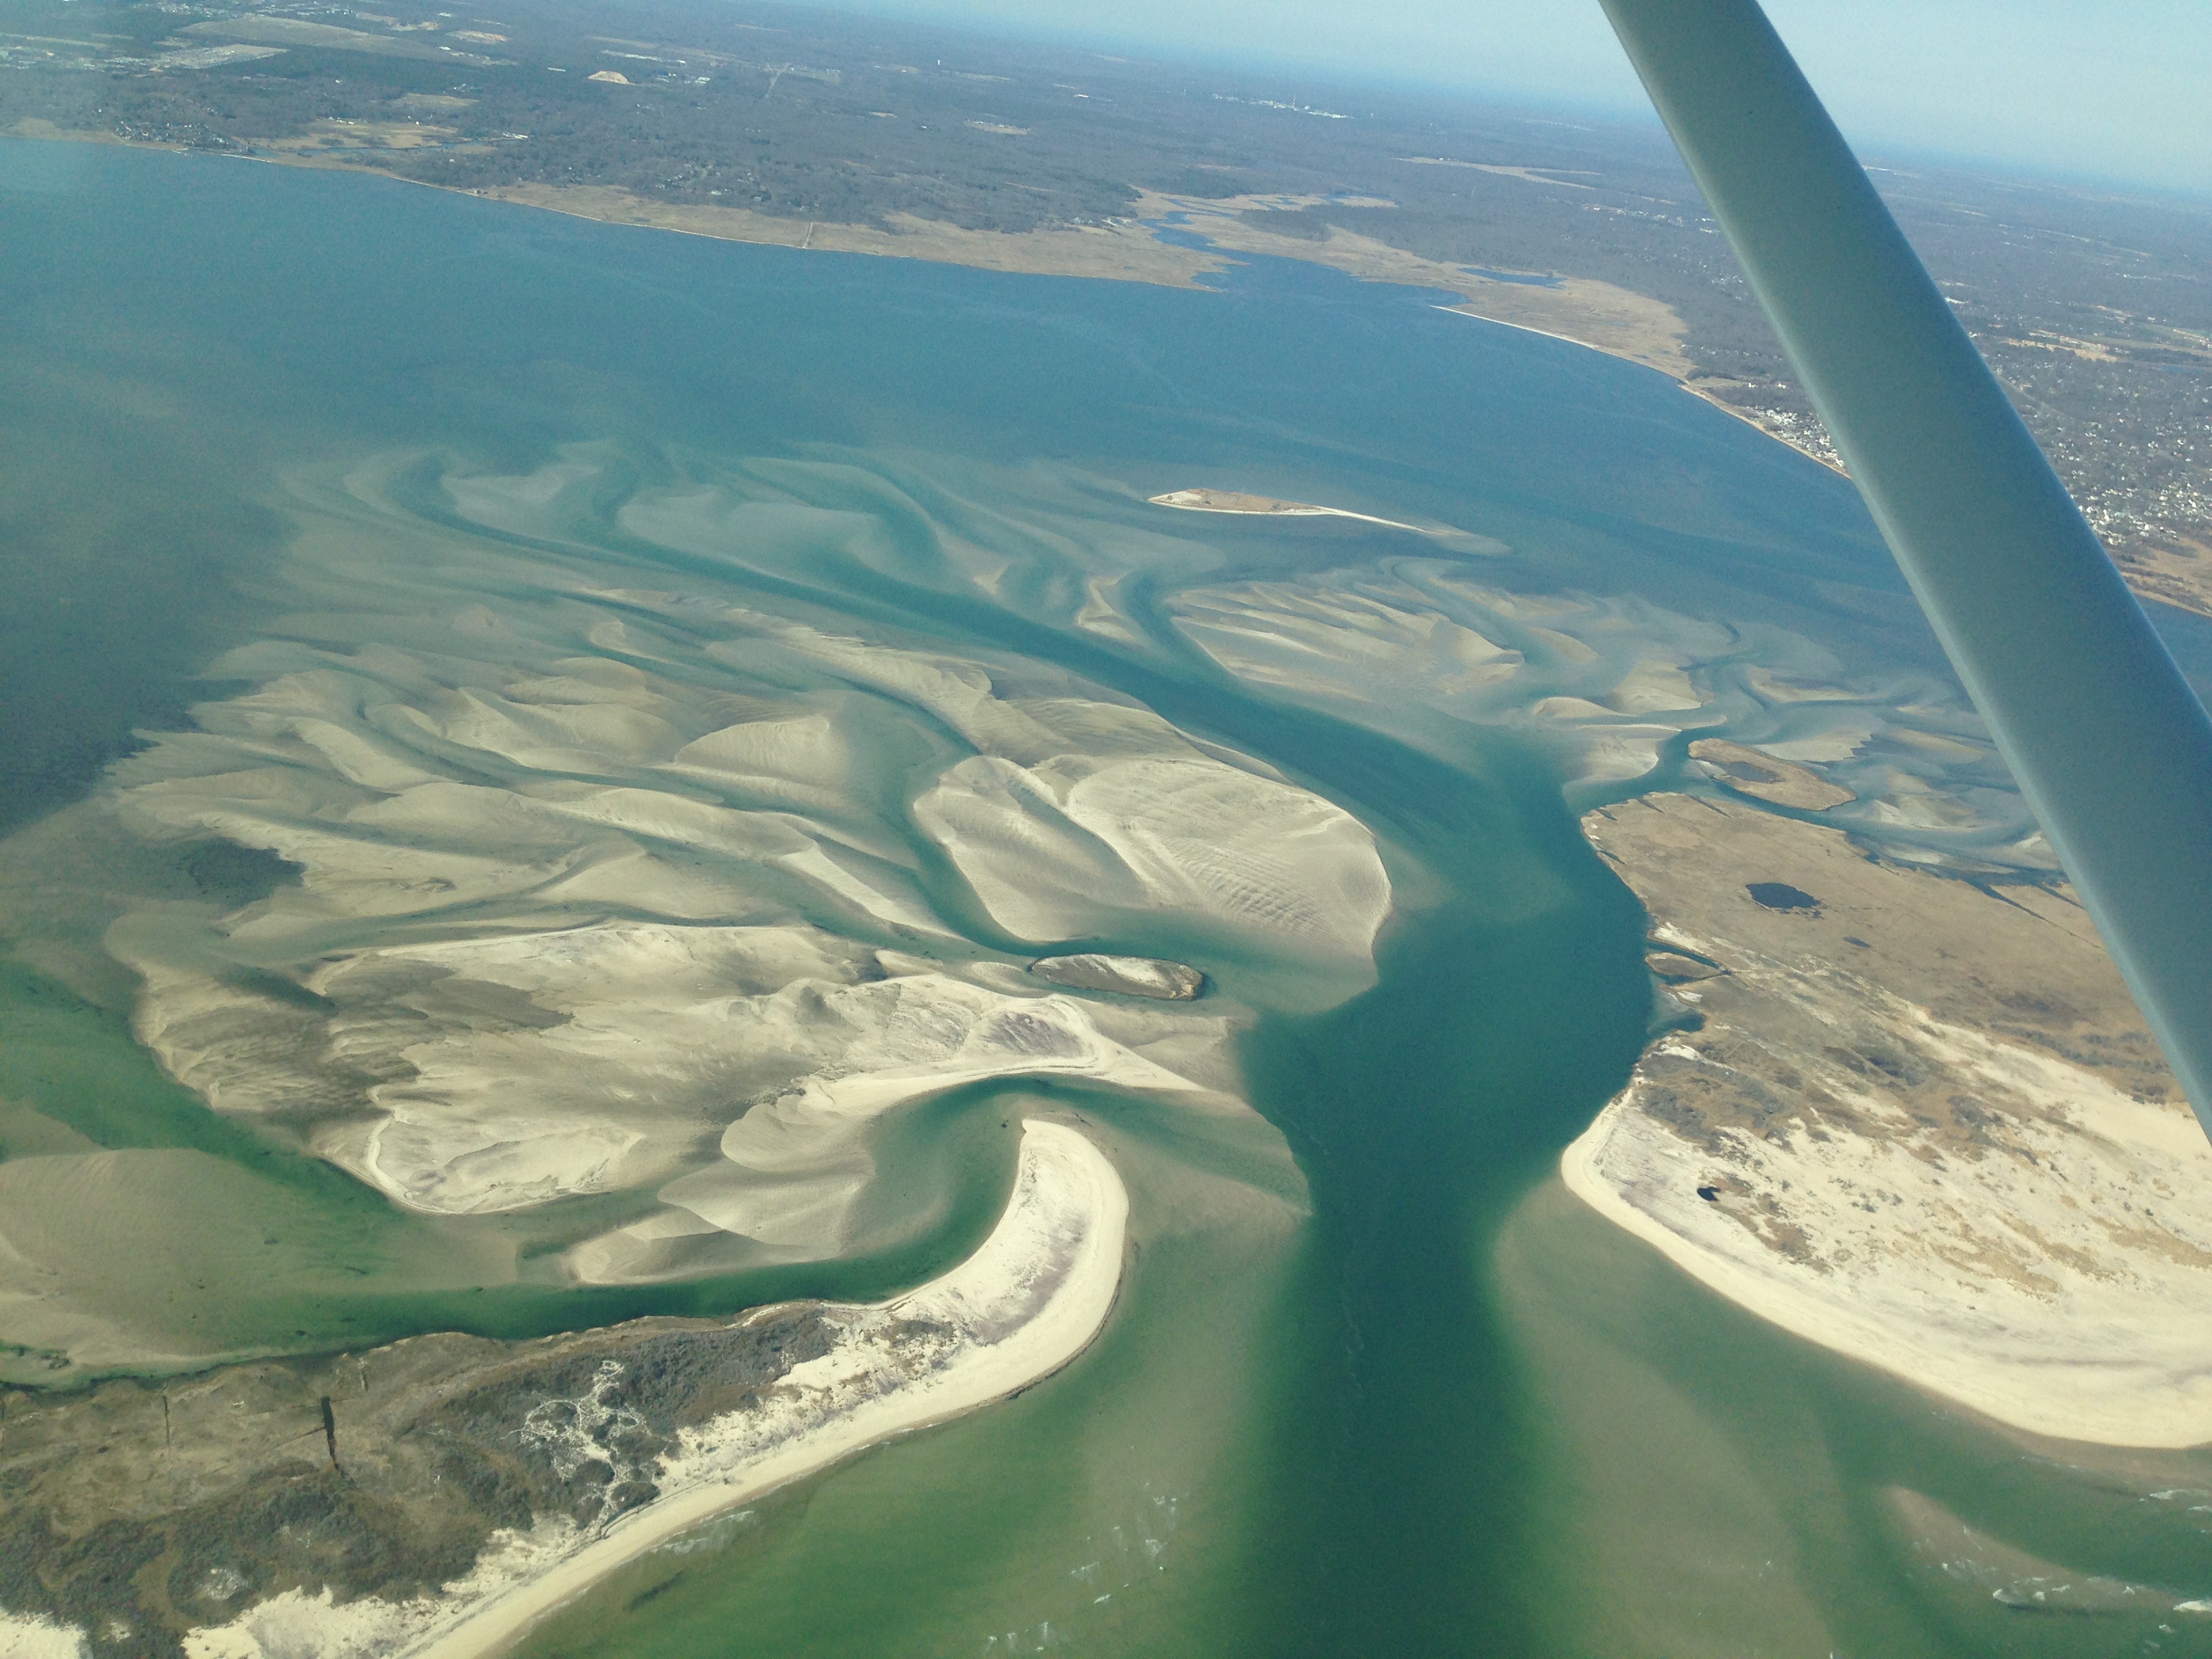 |
Apr 12, 2015 (JV)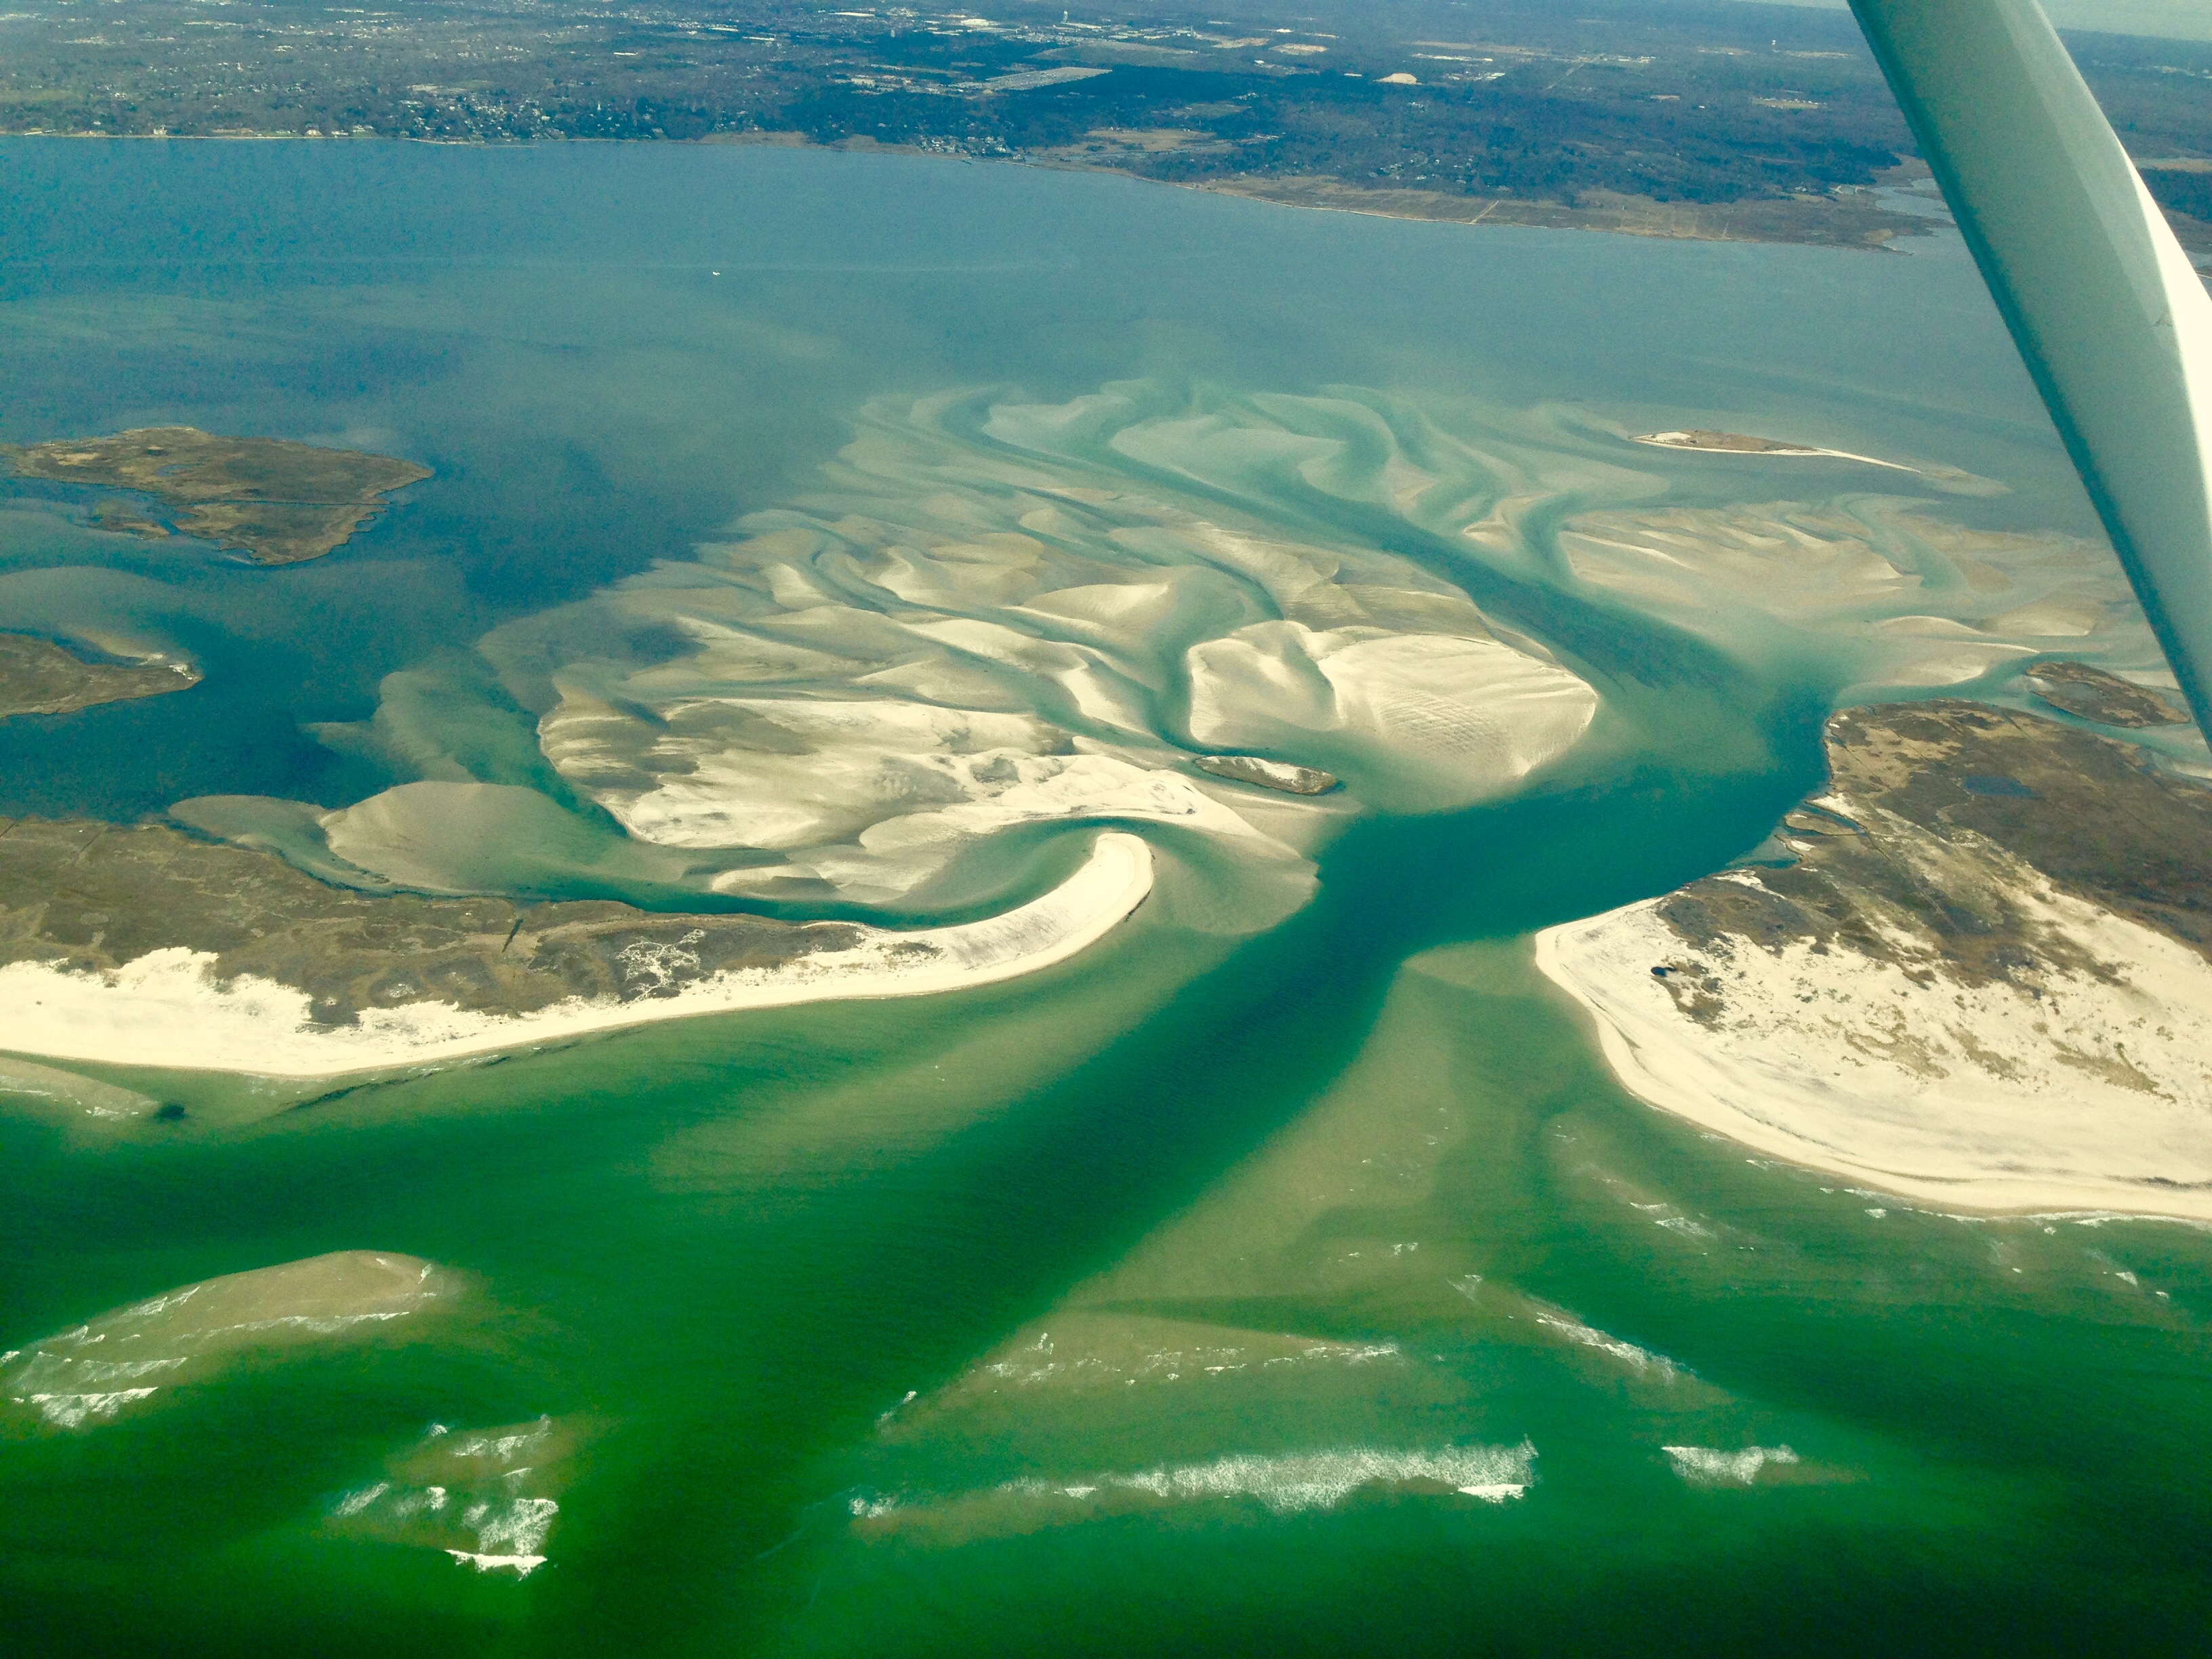 |
Apr 26, 2015 (CF)
|
May 26, 2015 (CF)
|
||||
June 30, 2015 (RG&CF)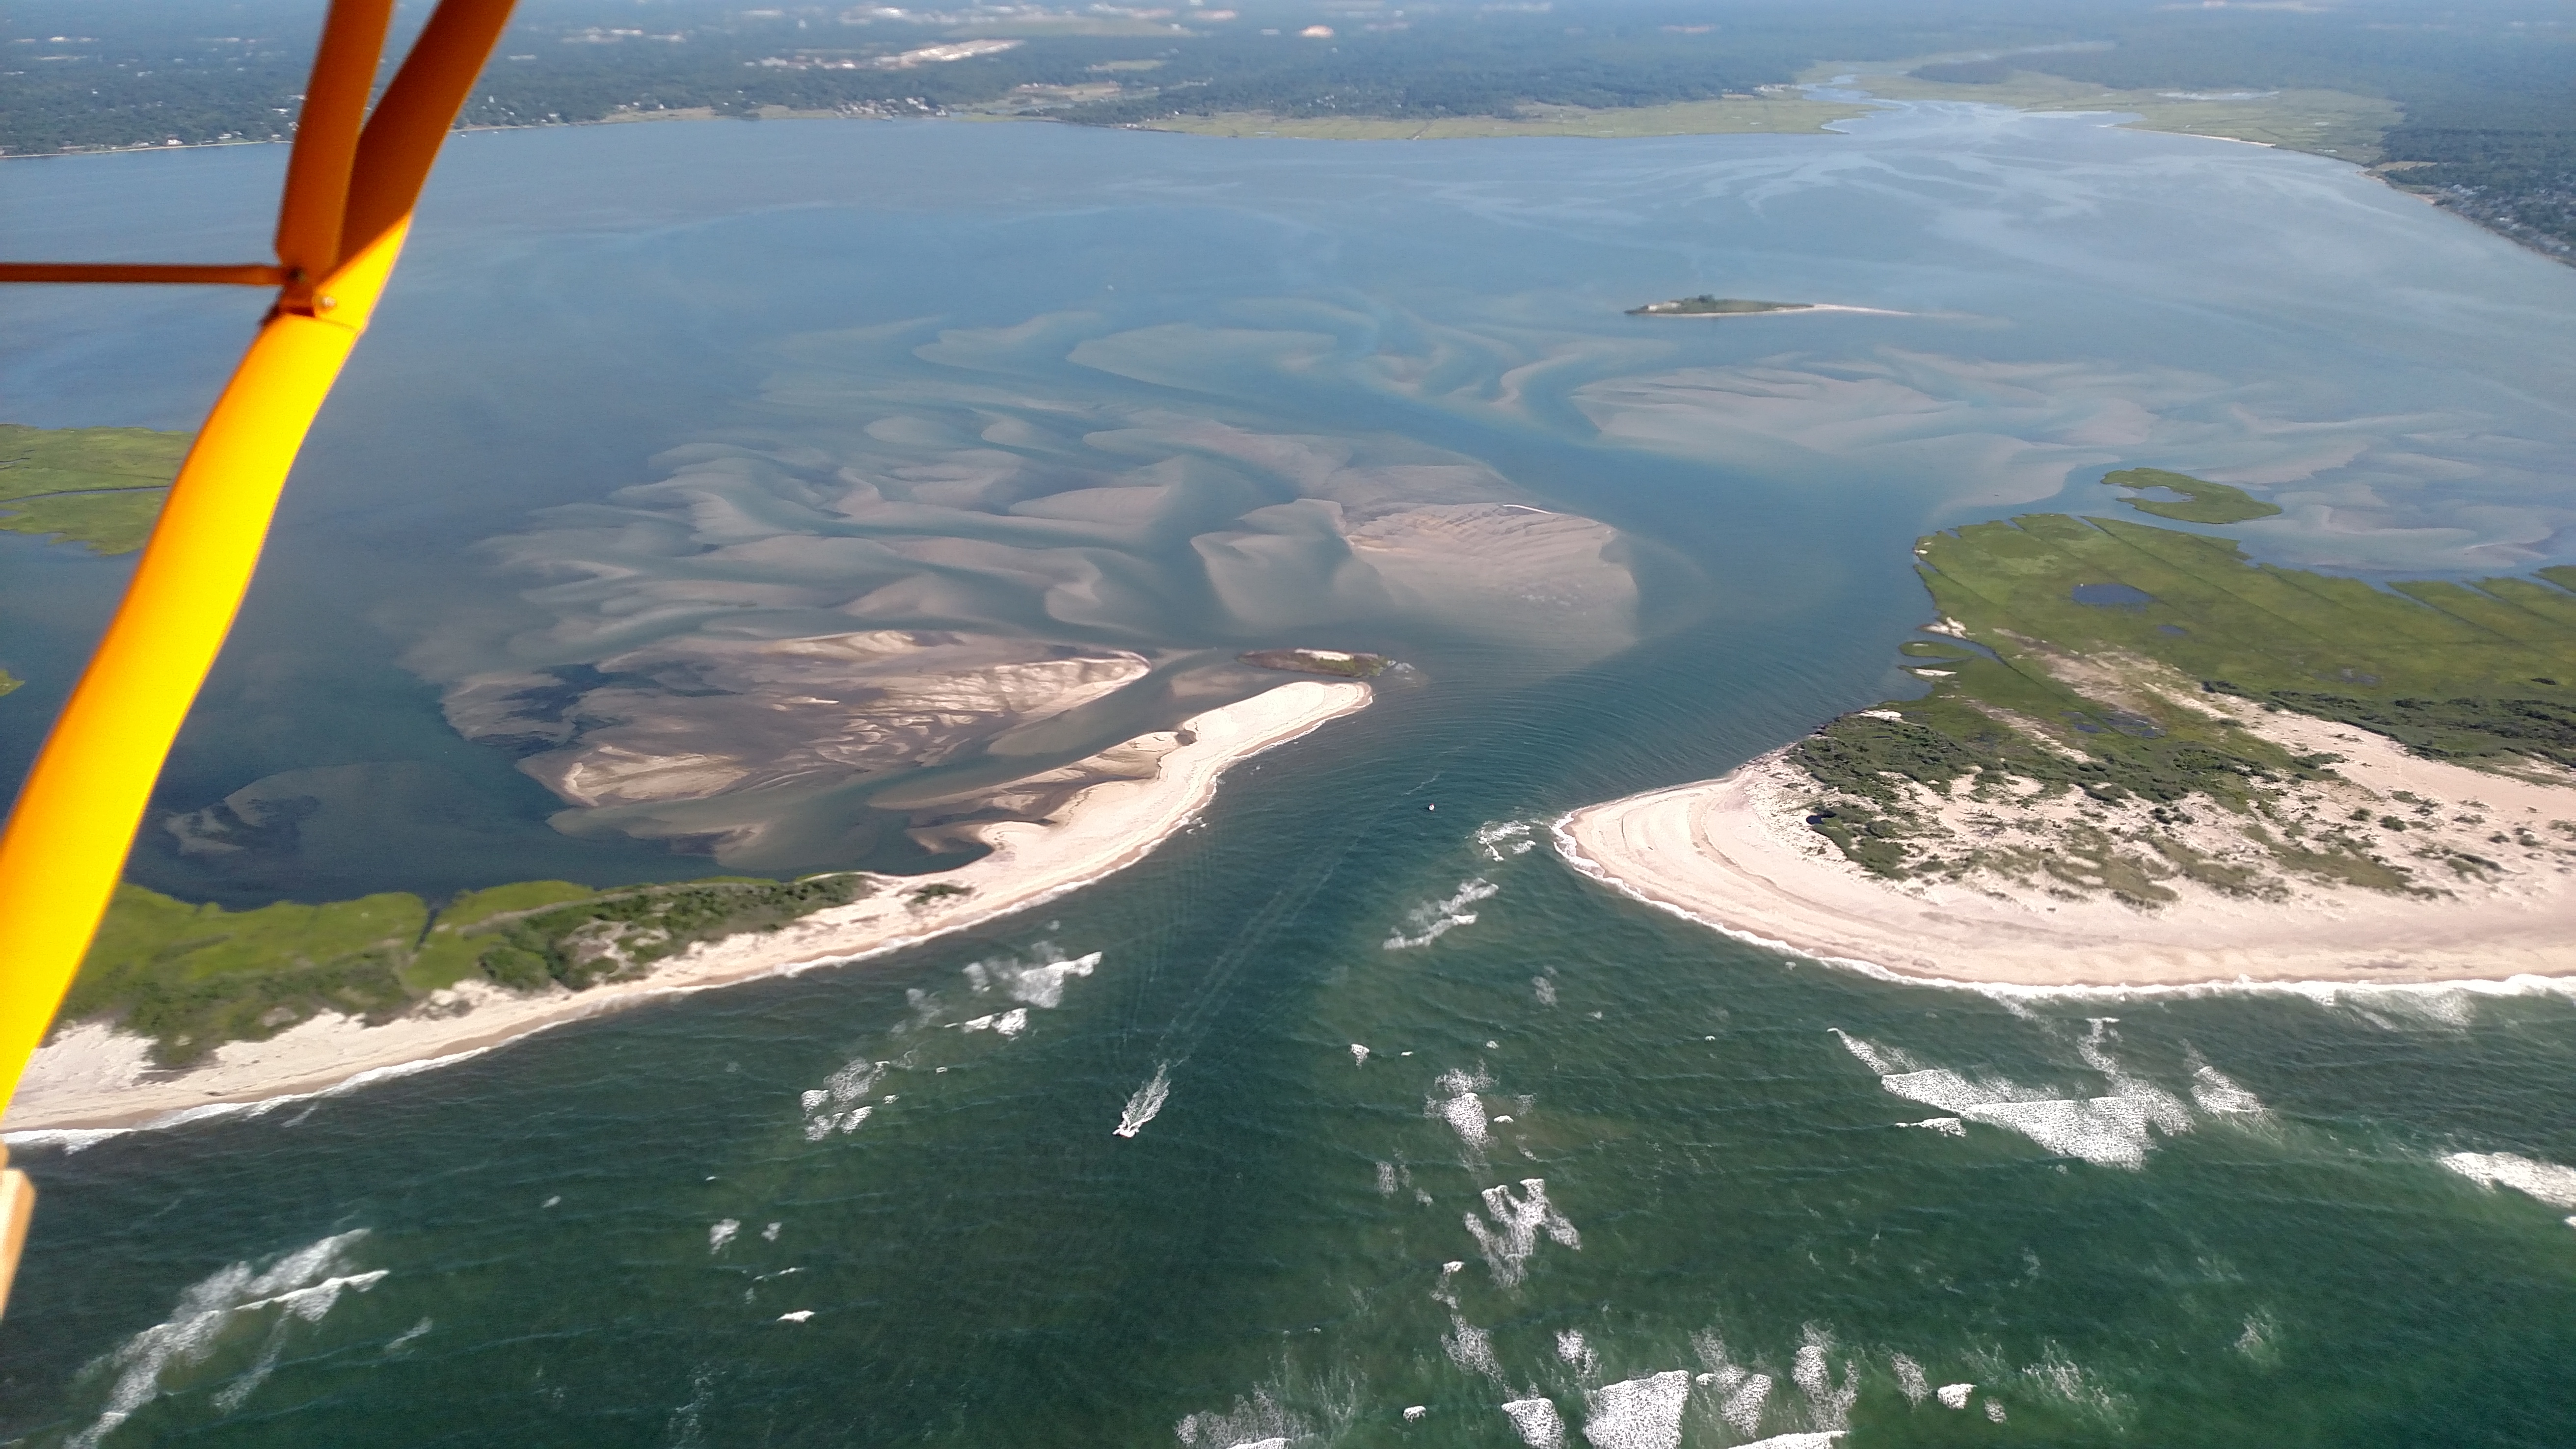 |
July 23, 2015 (RG&CF)
|
Aug 12, 2015 (CF&SG) |
Aug 28, 2015 (CF&CH)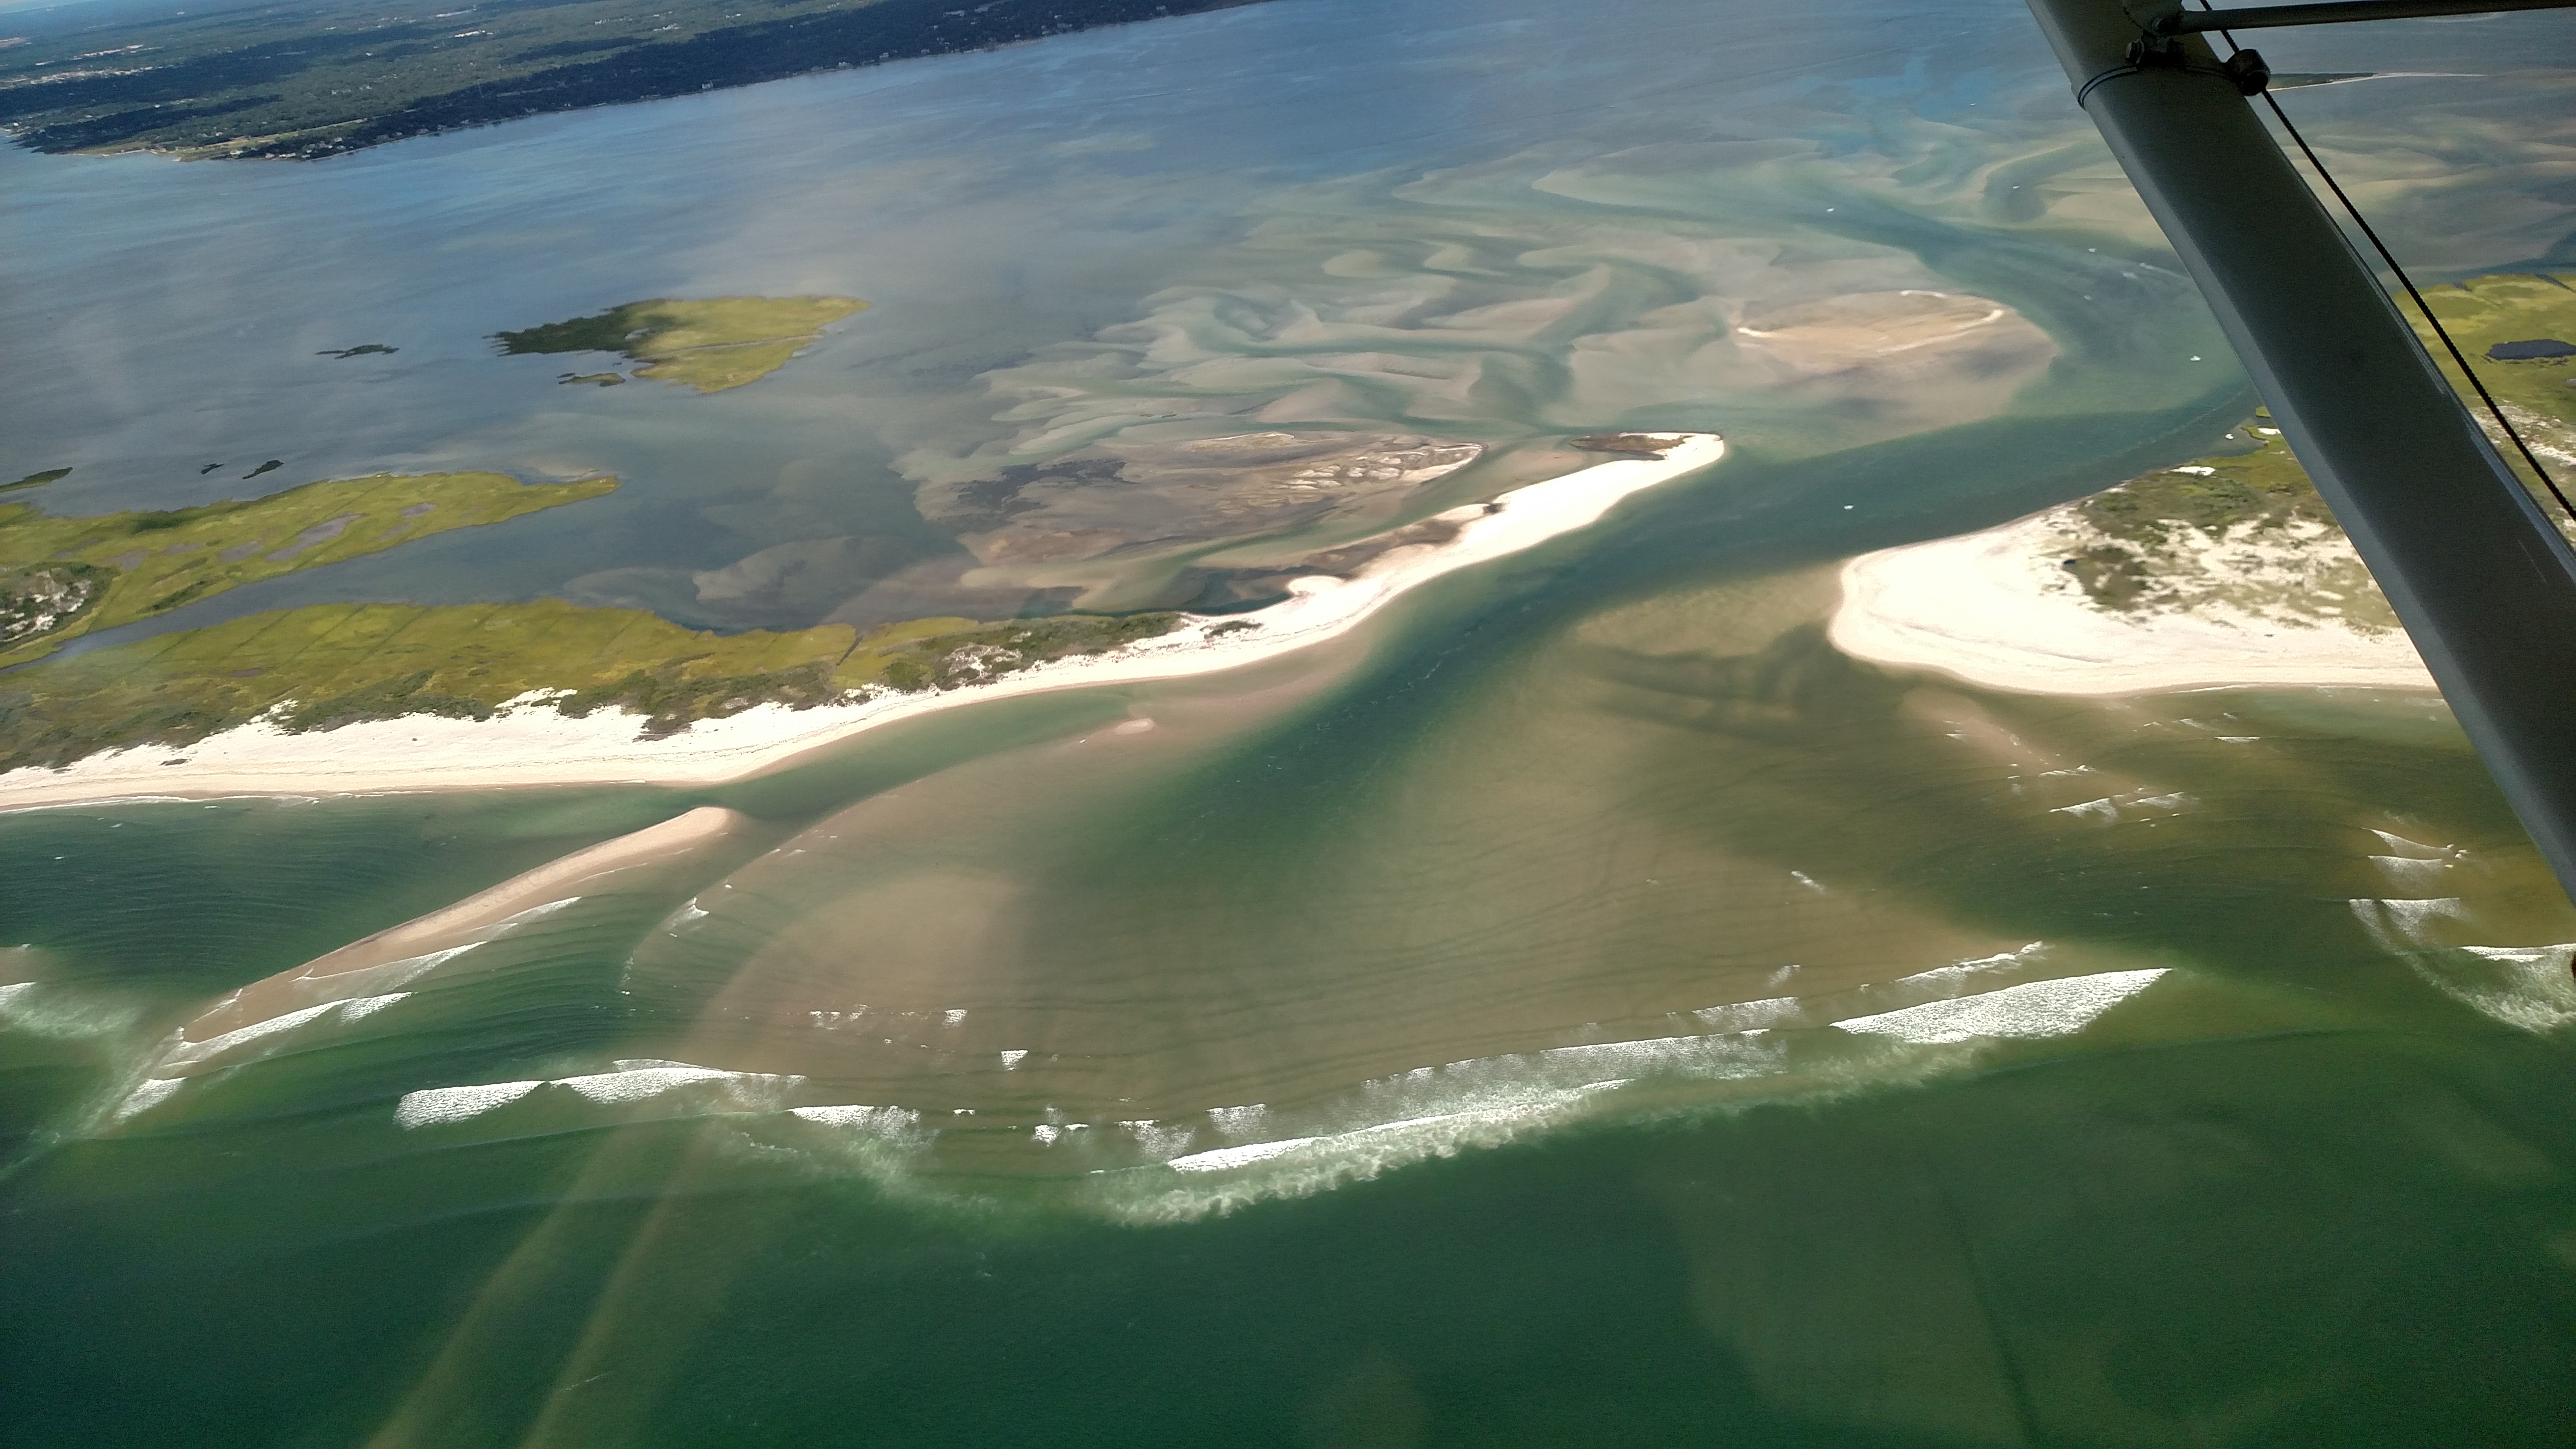 |
||||
Sept 25, 2015 (CF)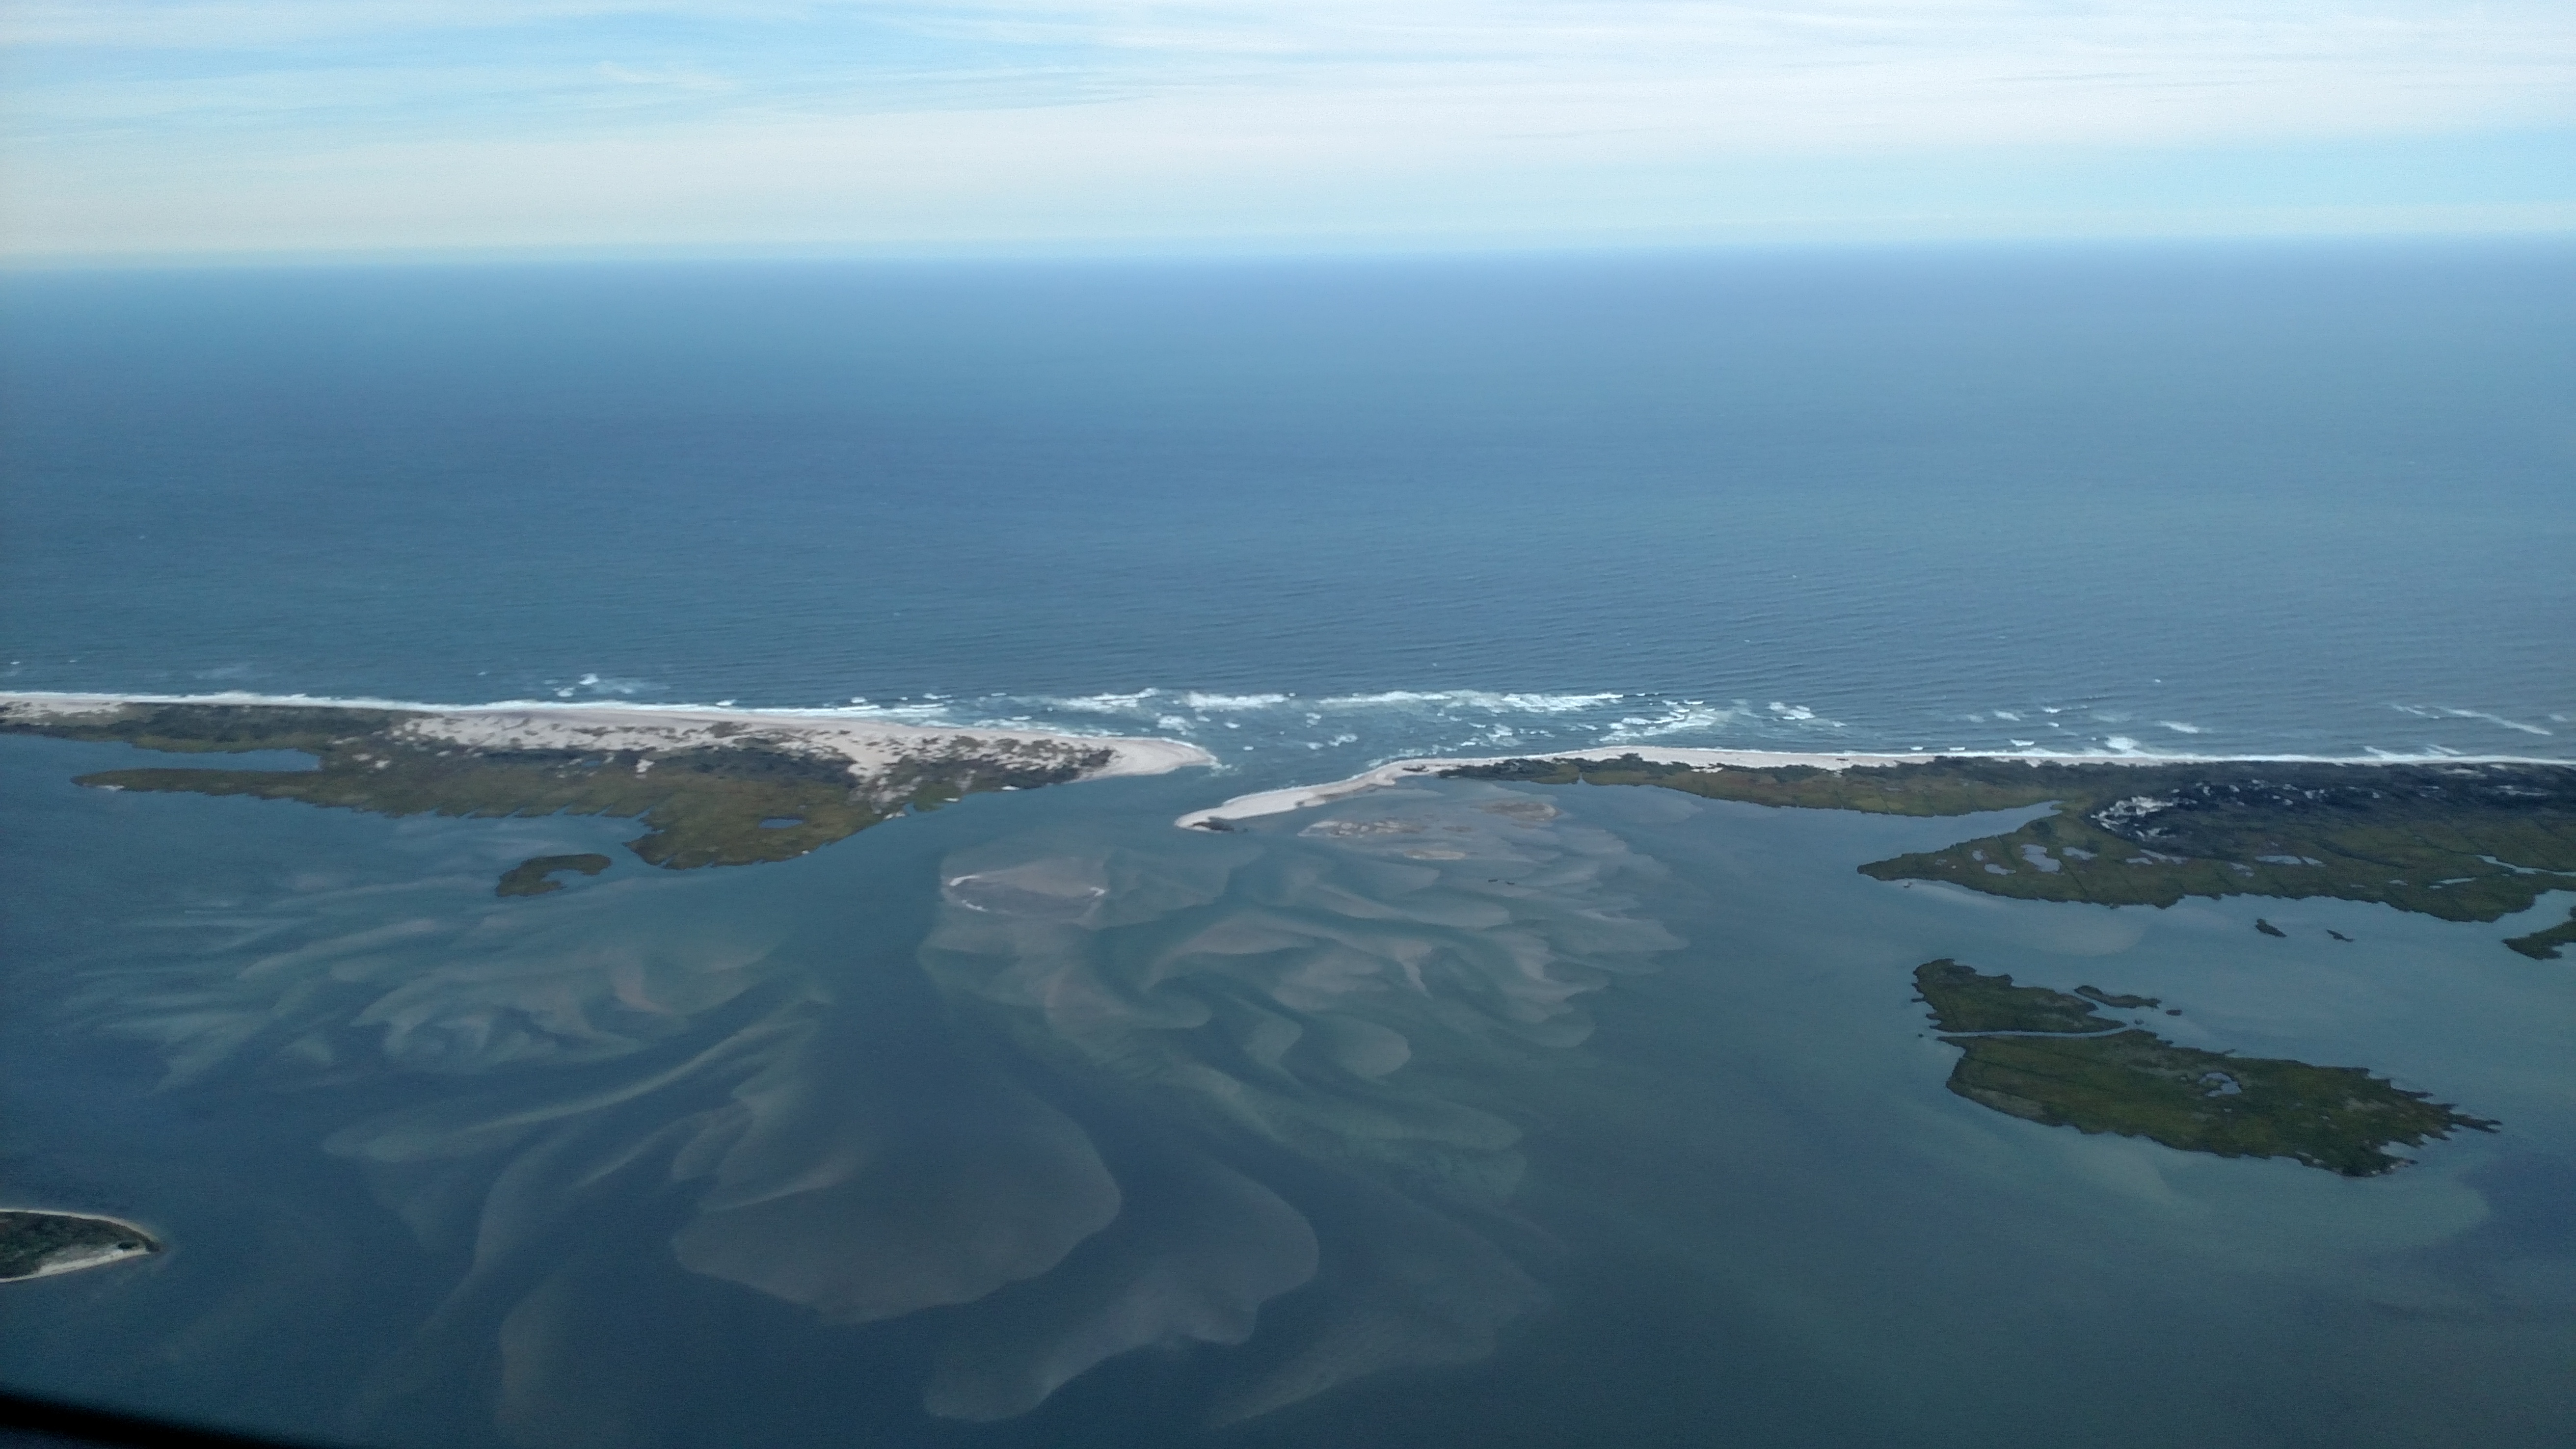 |
Oct 6, 2015 (RG)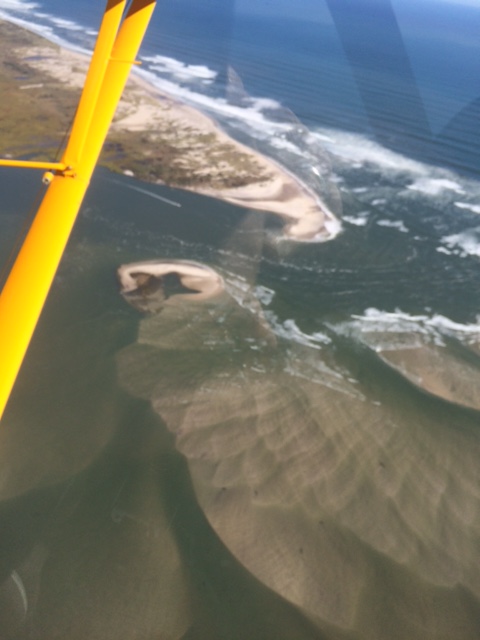 |
Oct 7, 2015 (CF)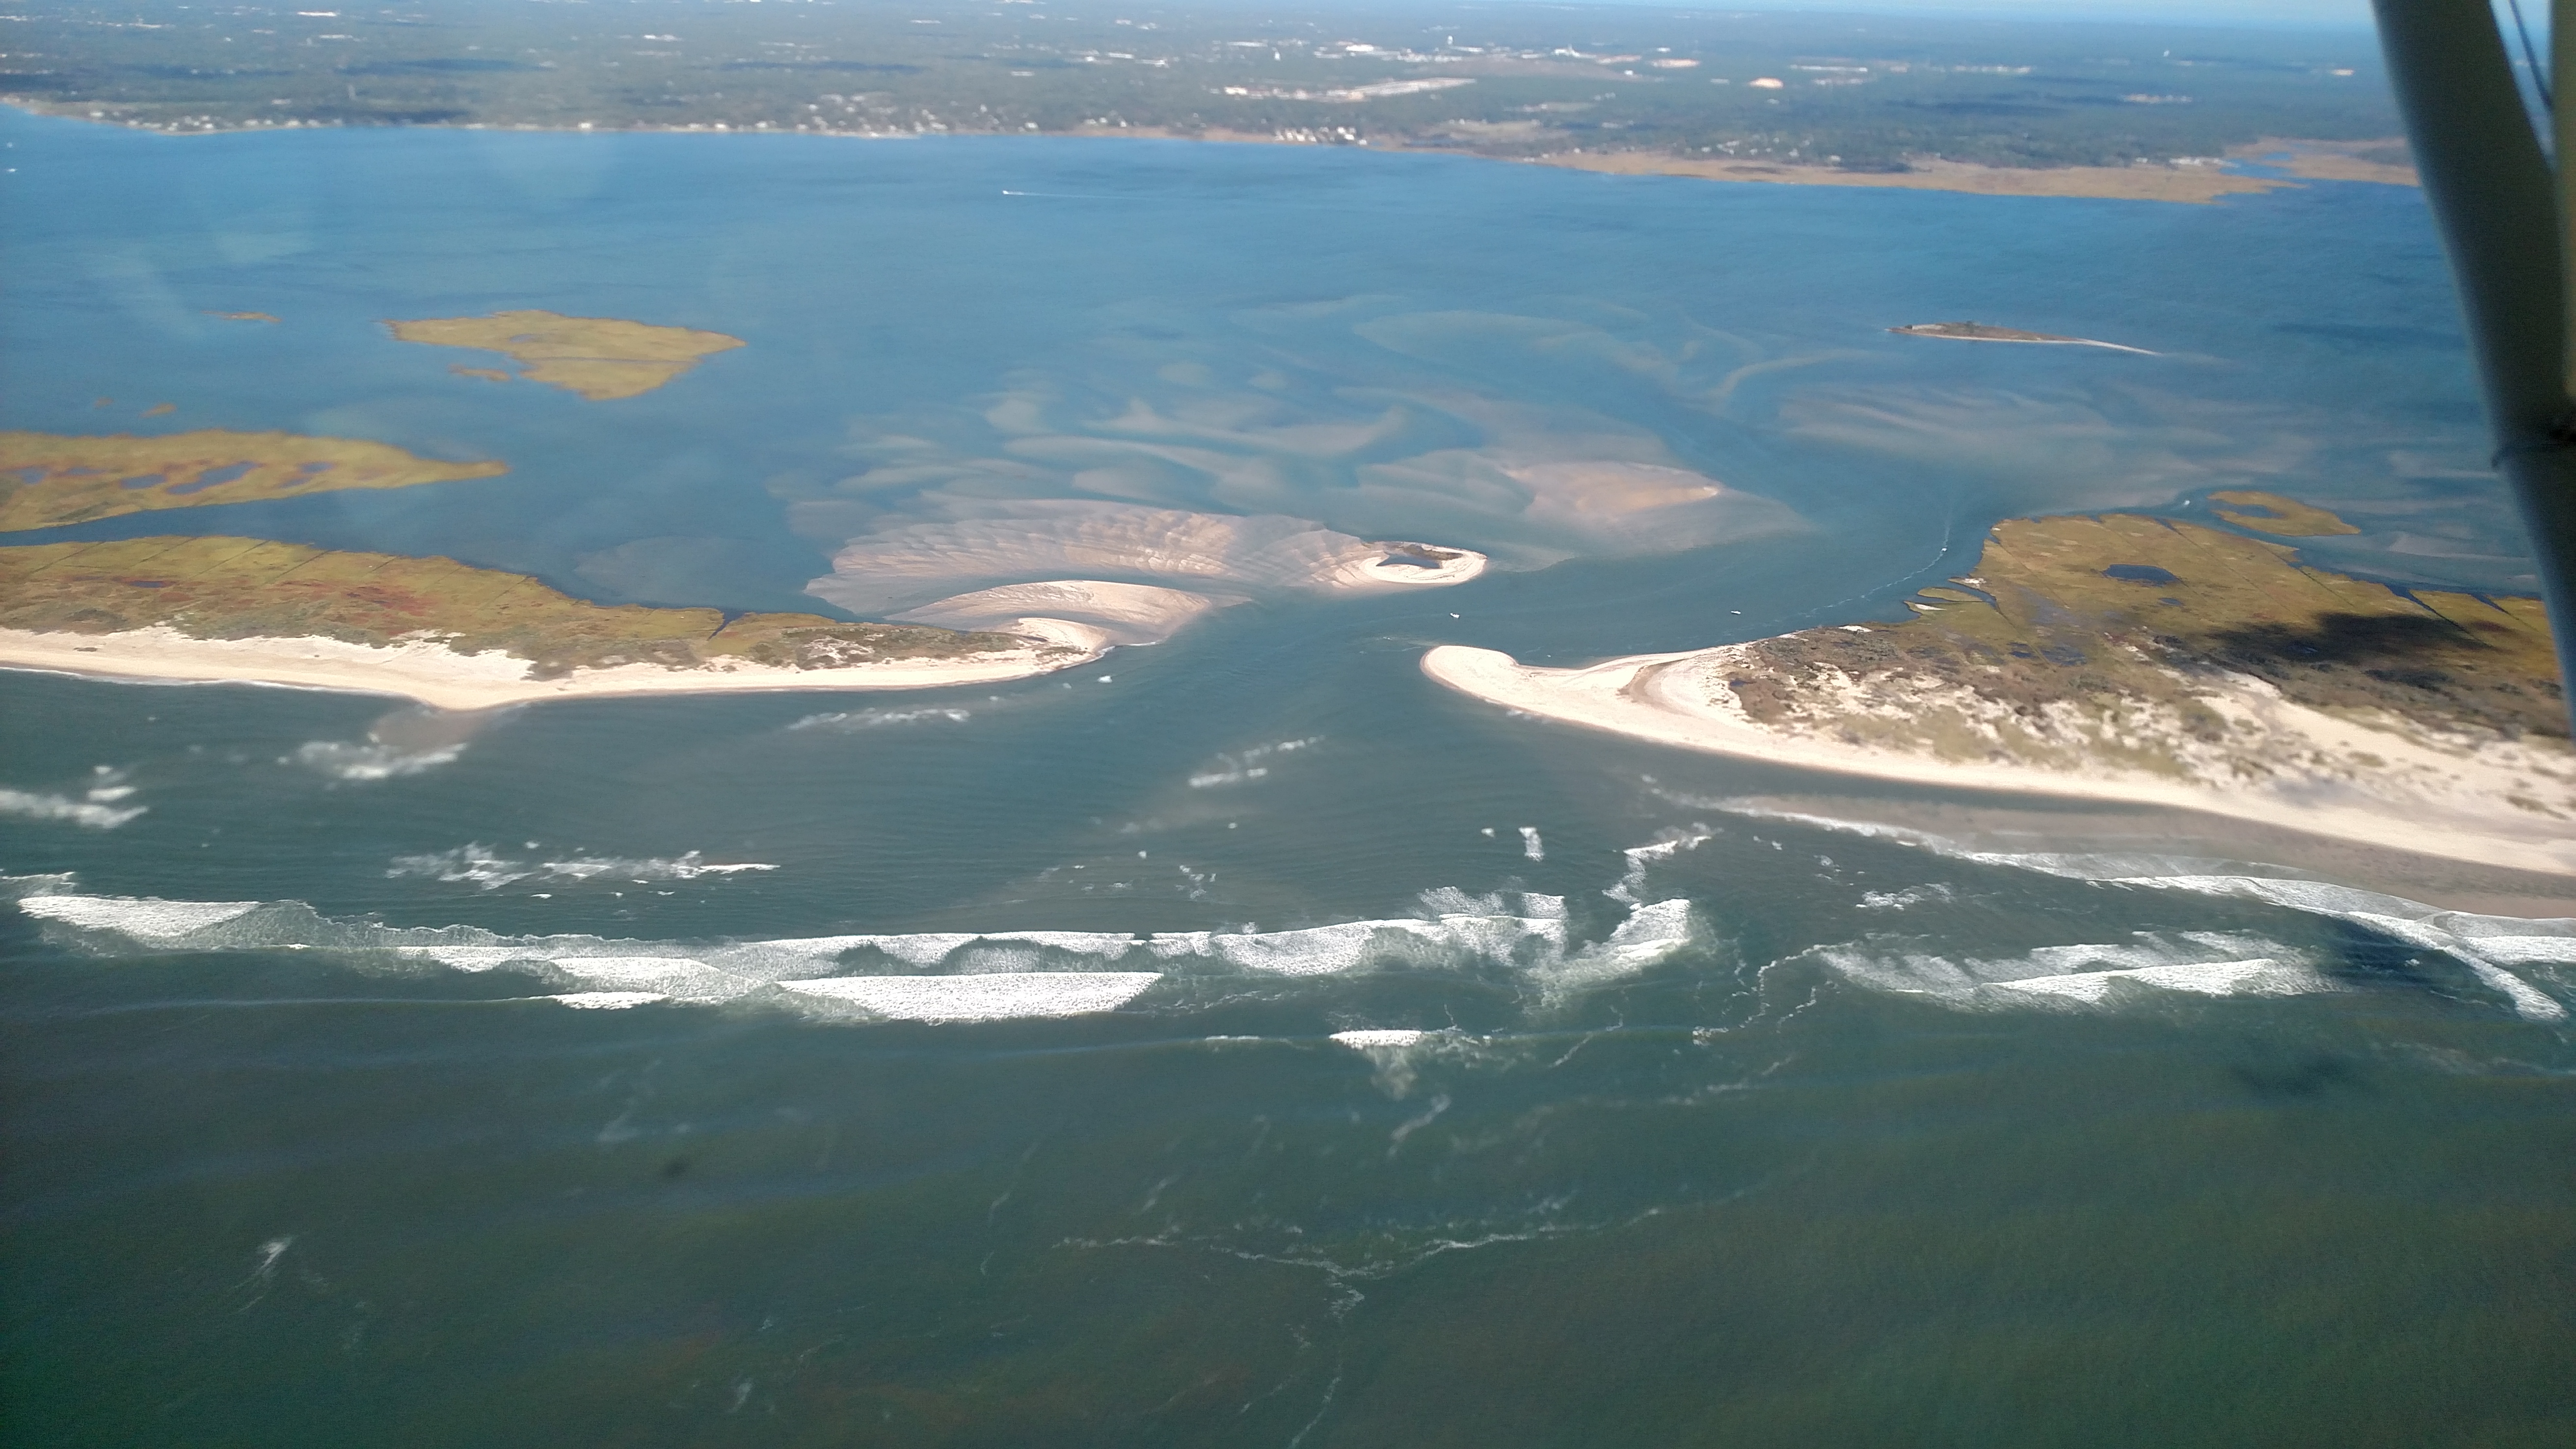  |
Oct 21, 2015 (RG)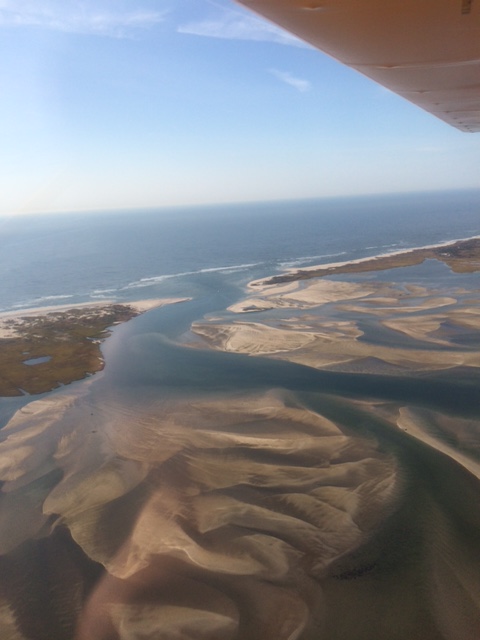 |
||||
Oct 26, 2015 (CF)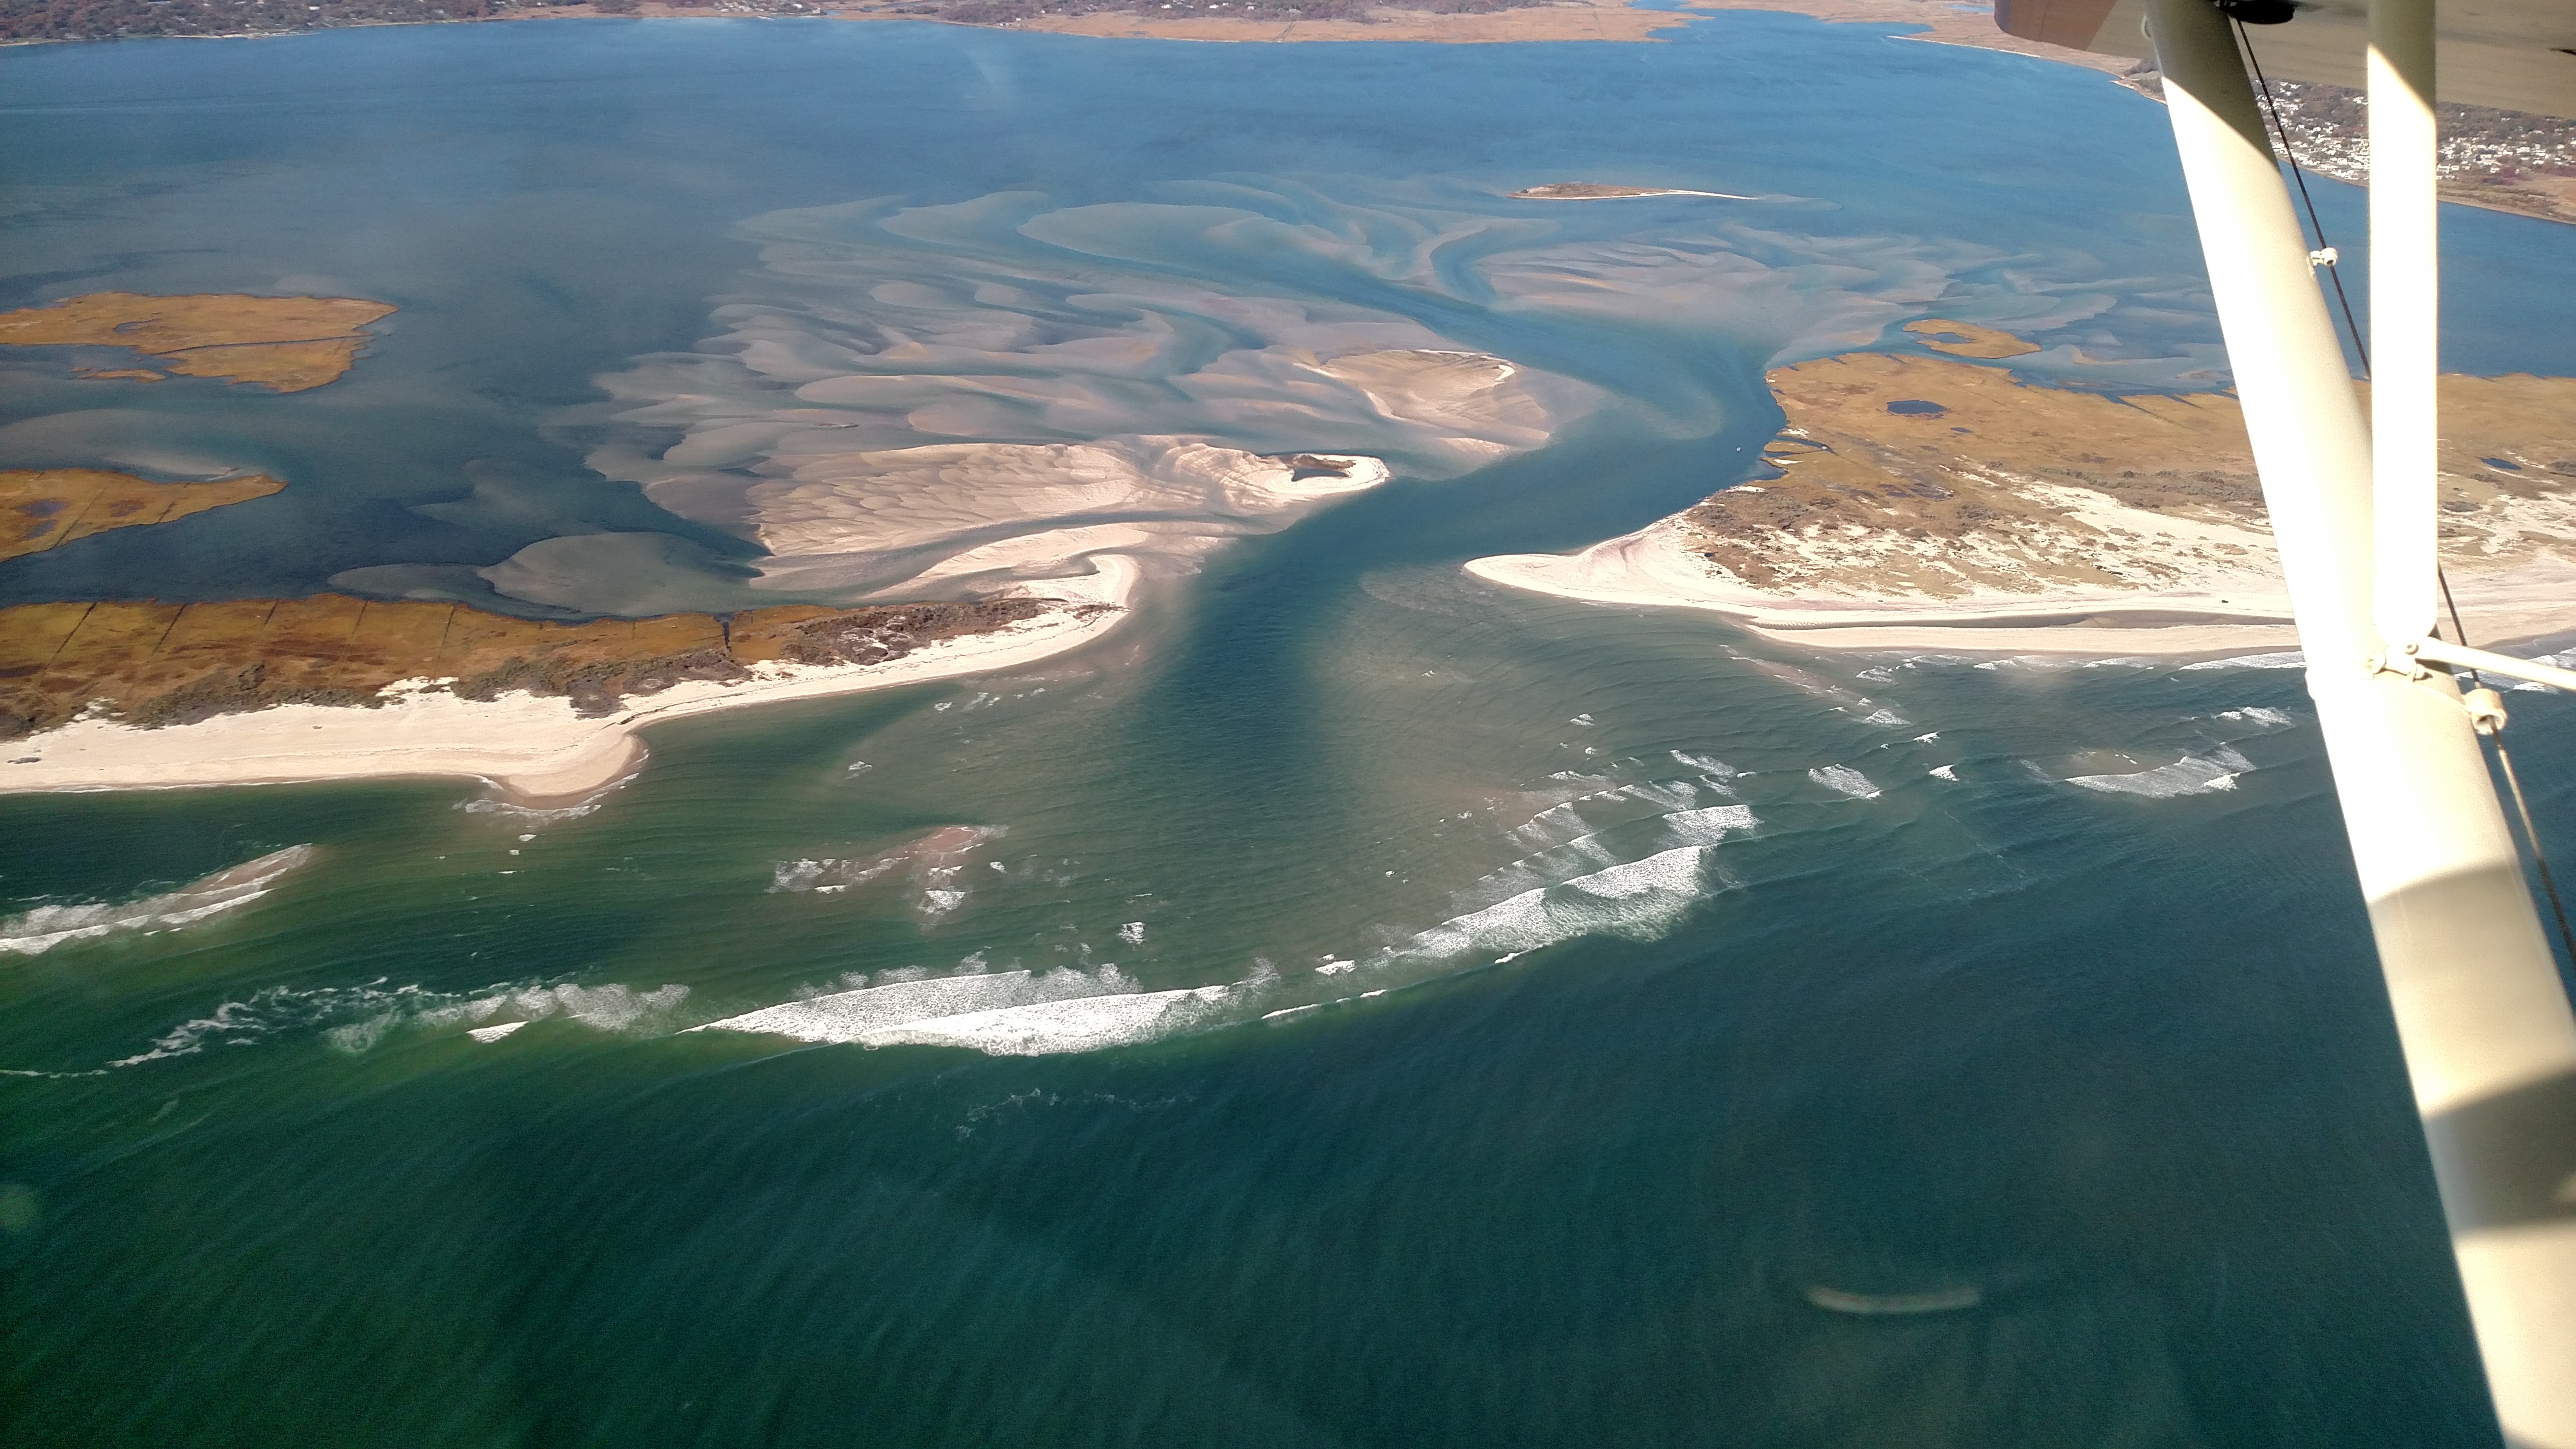 |
Nov 25, 2015 (RG&CF)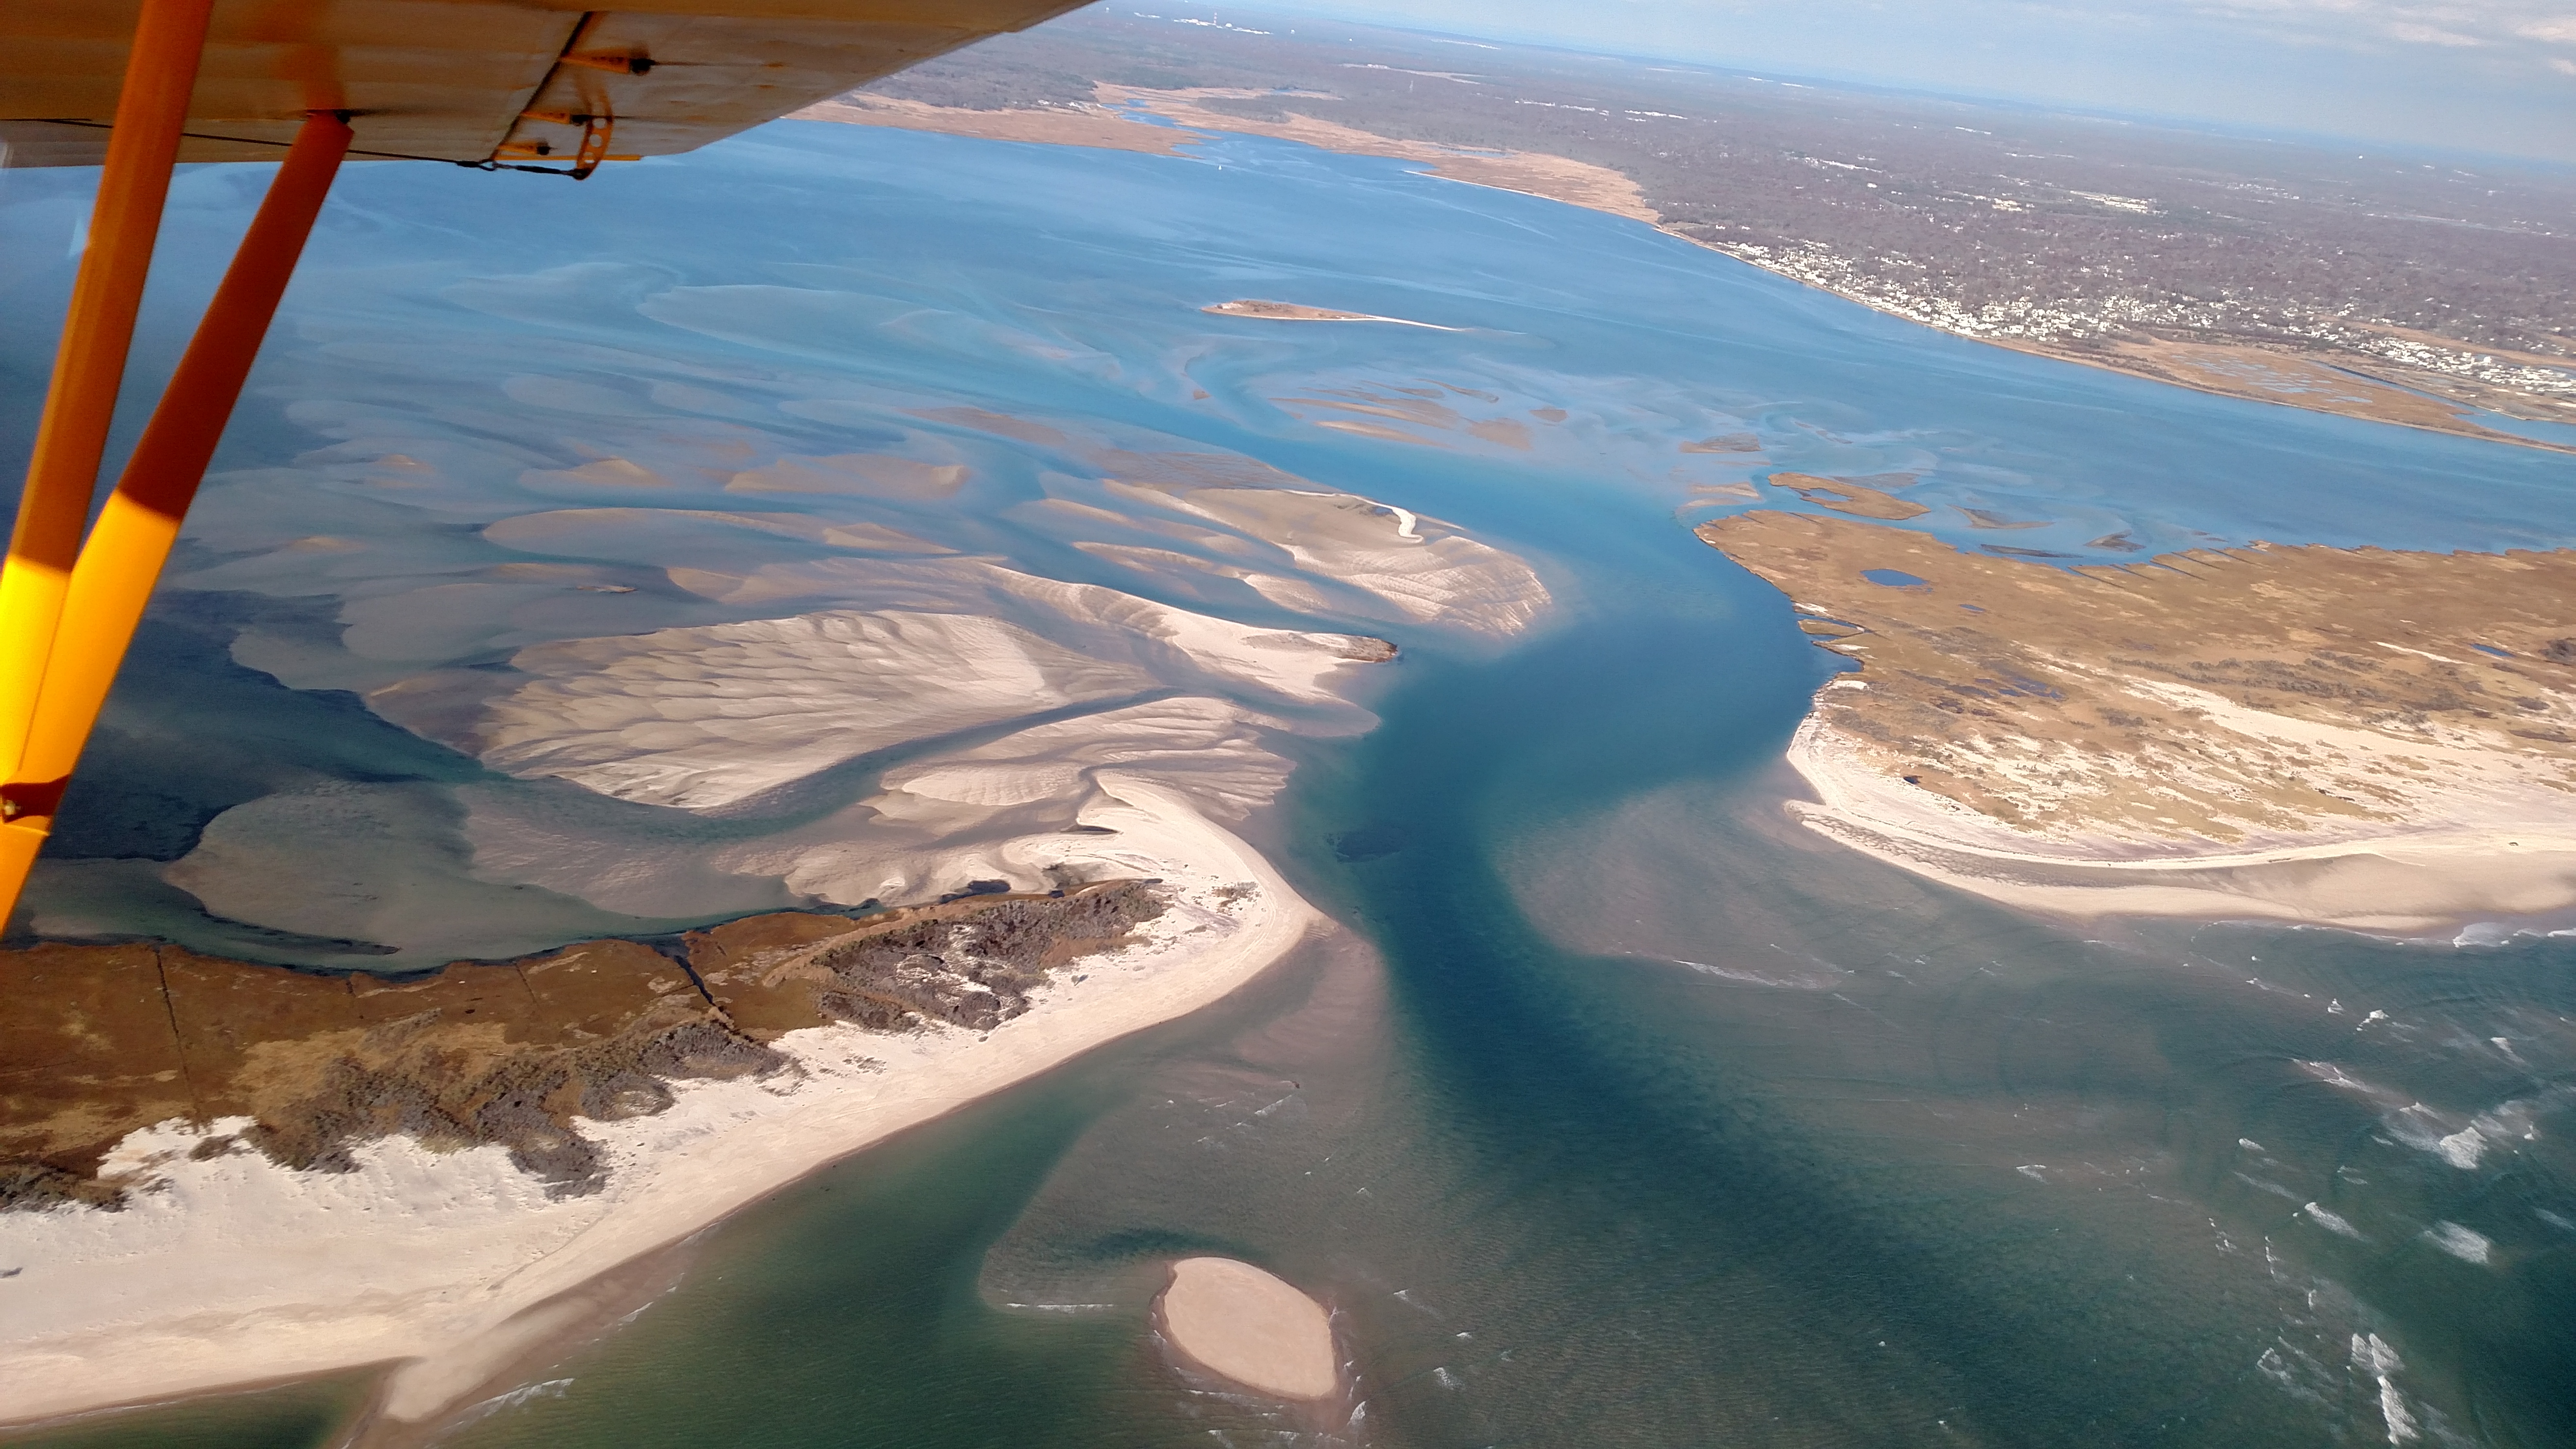 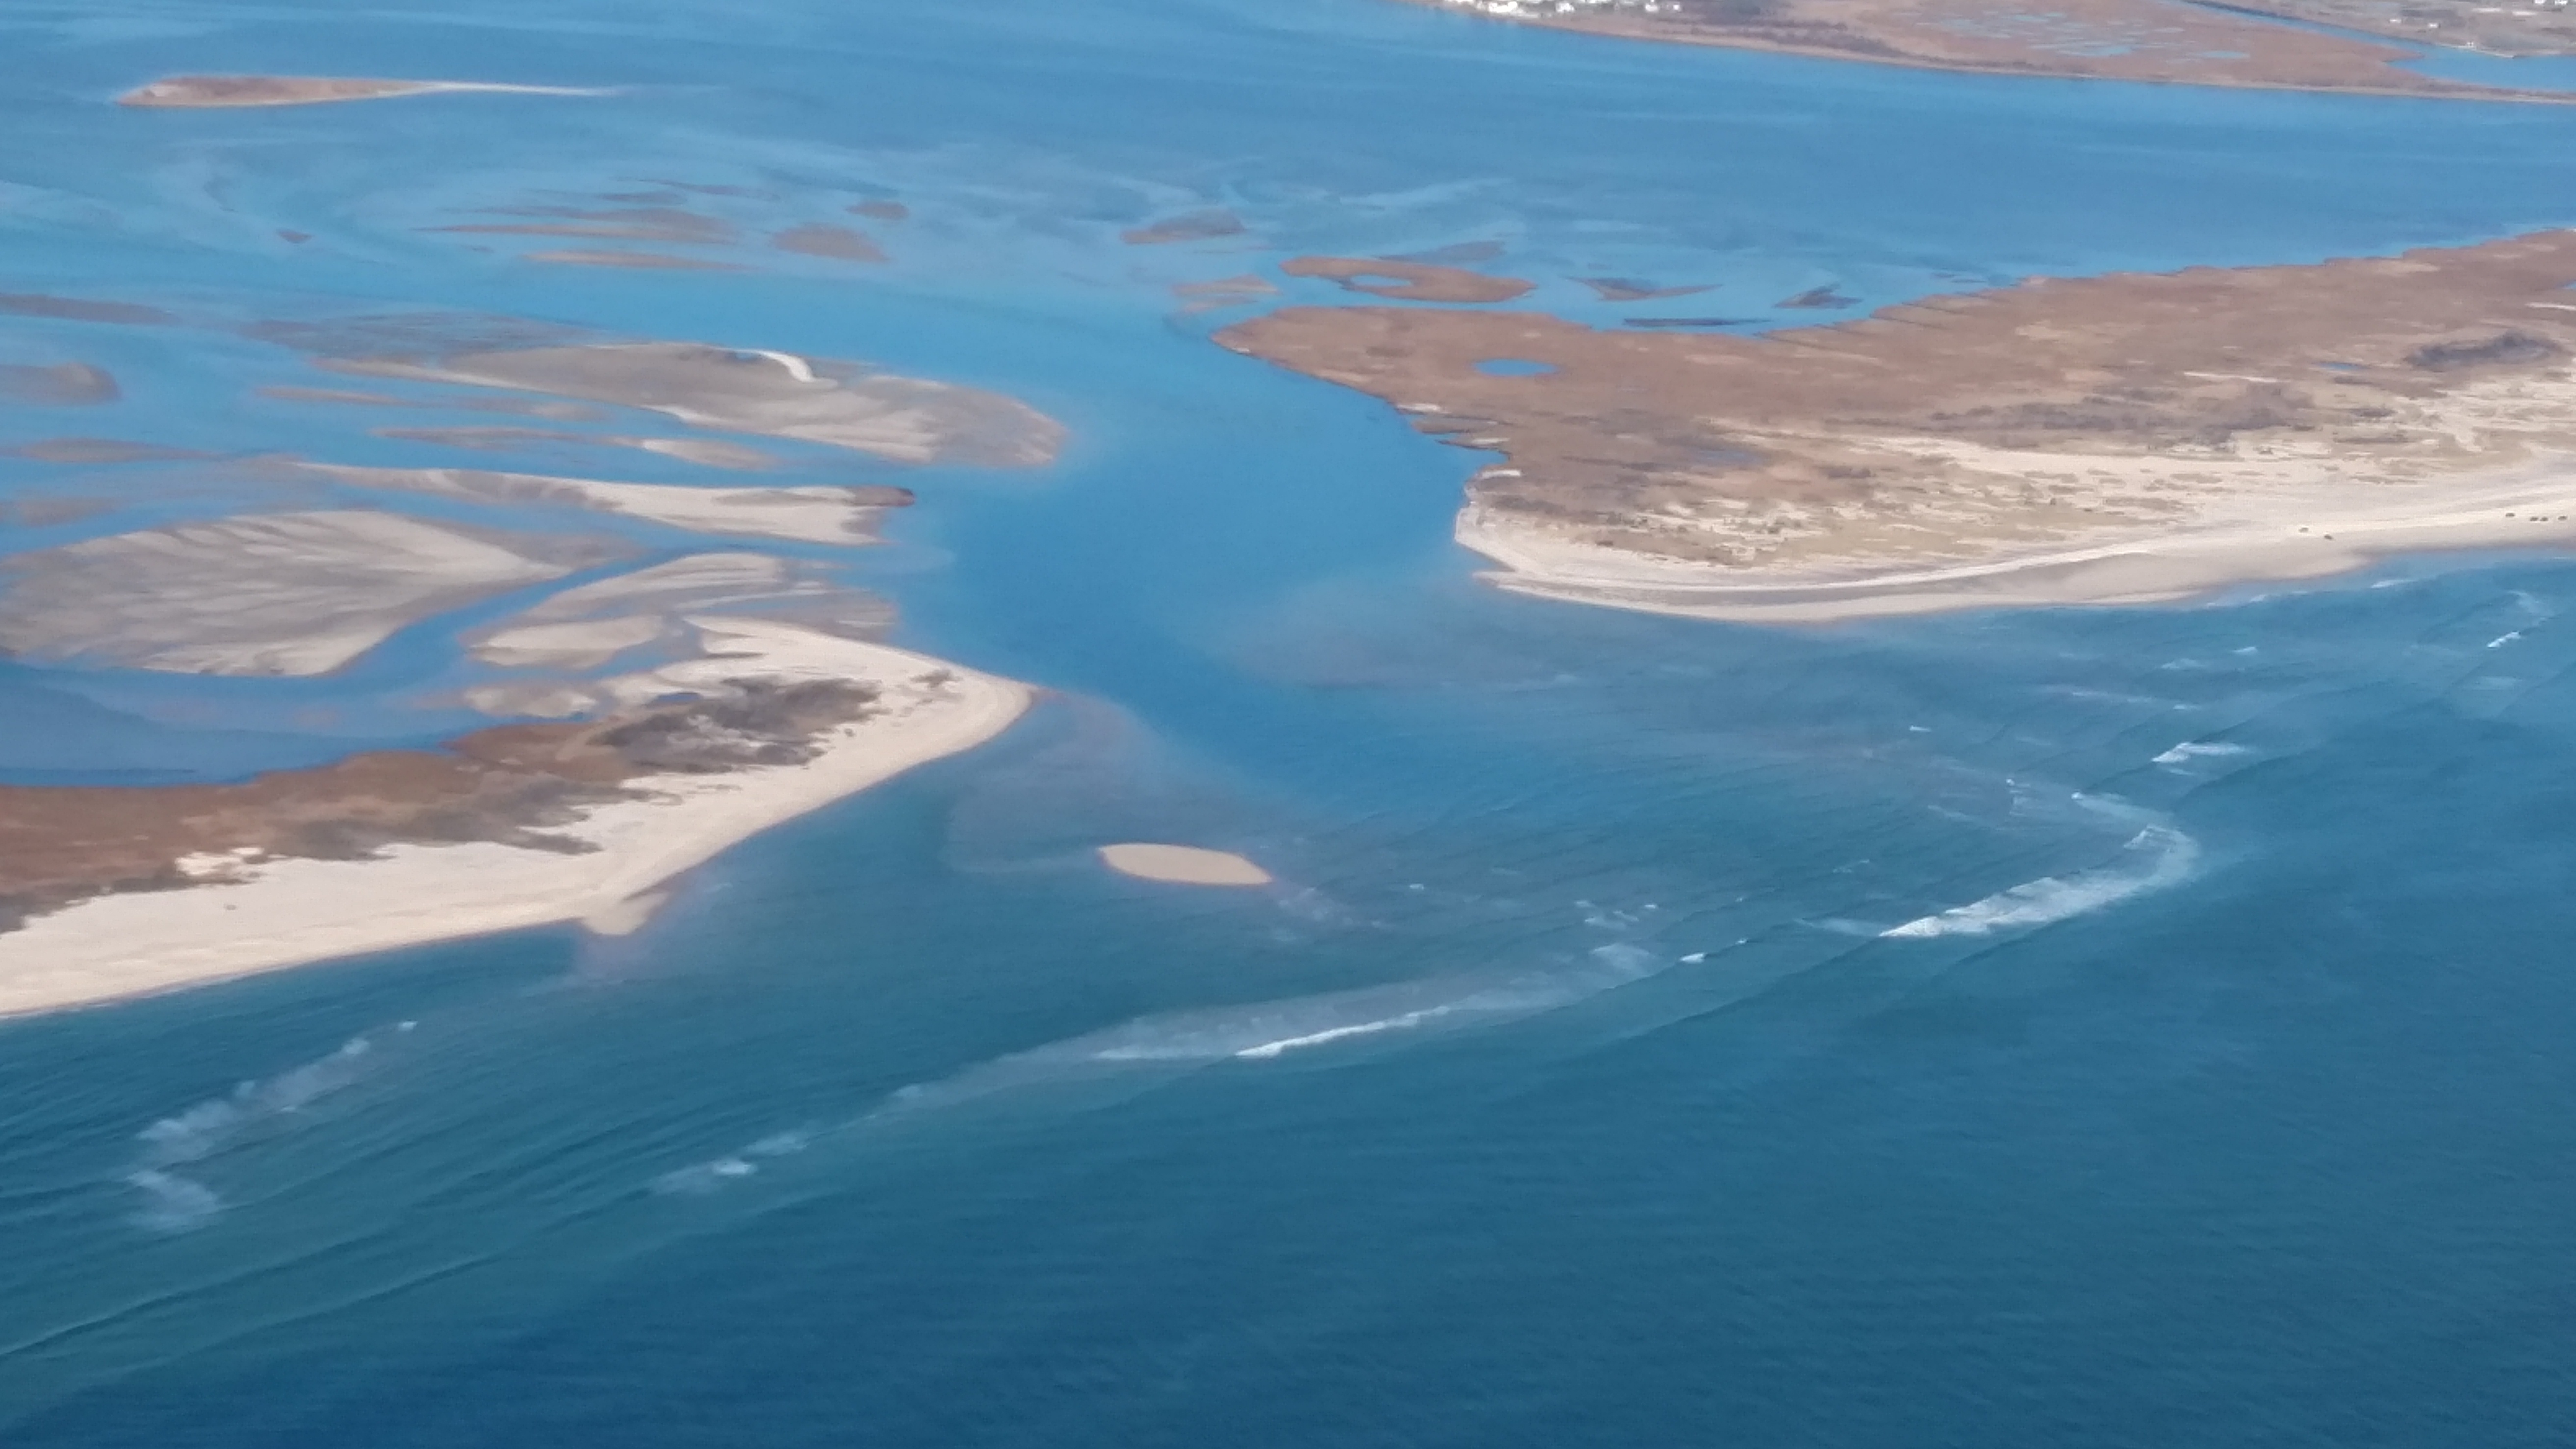 |
Dec 5, 2015 (RG&CF)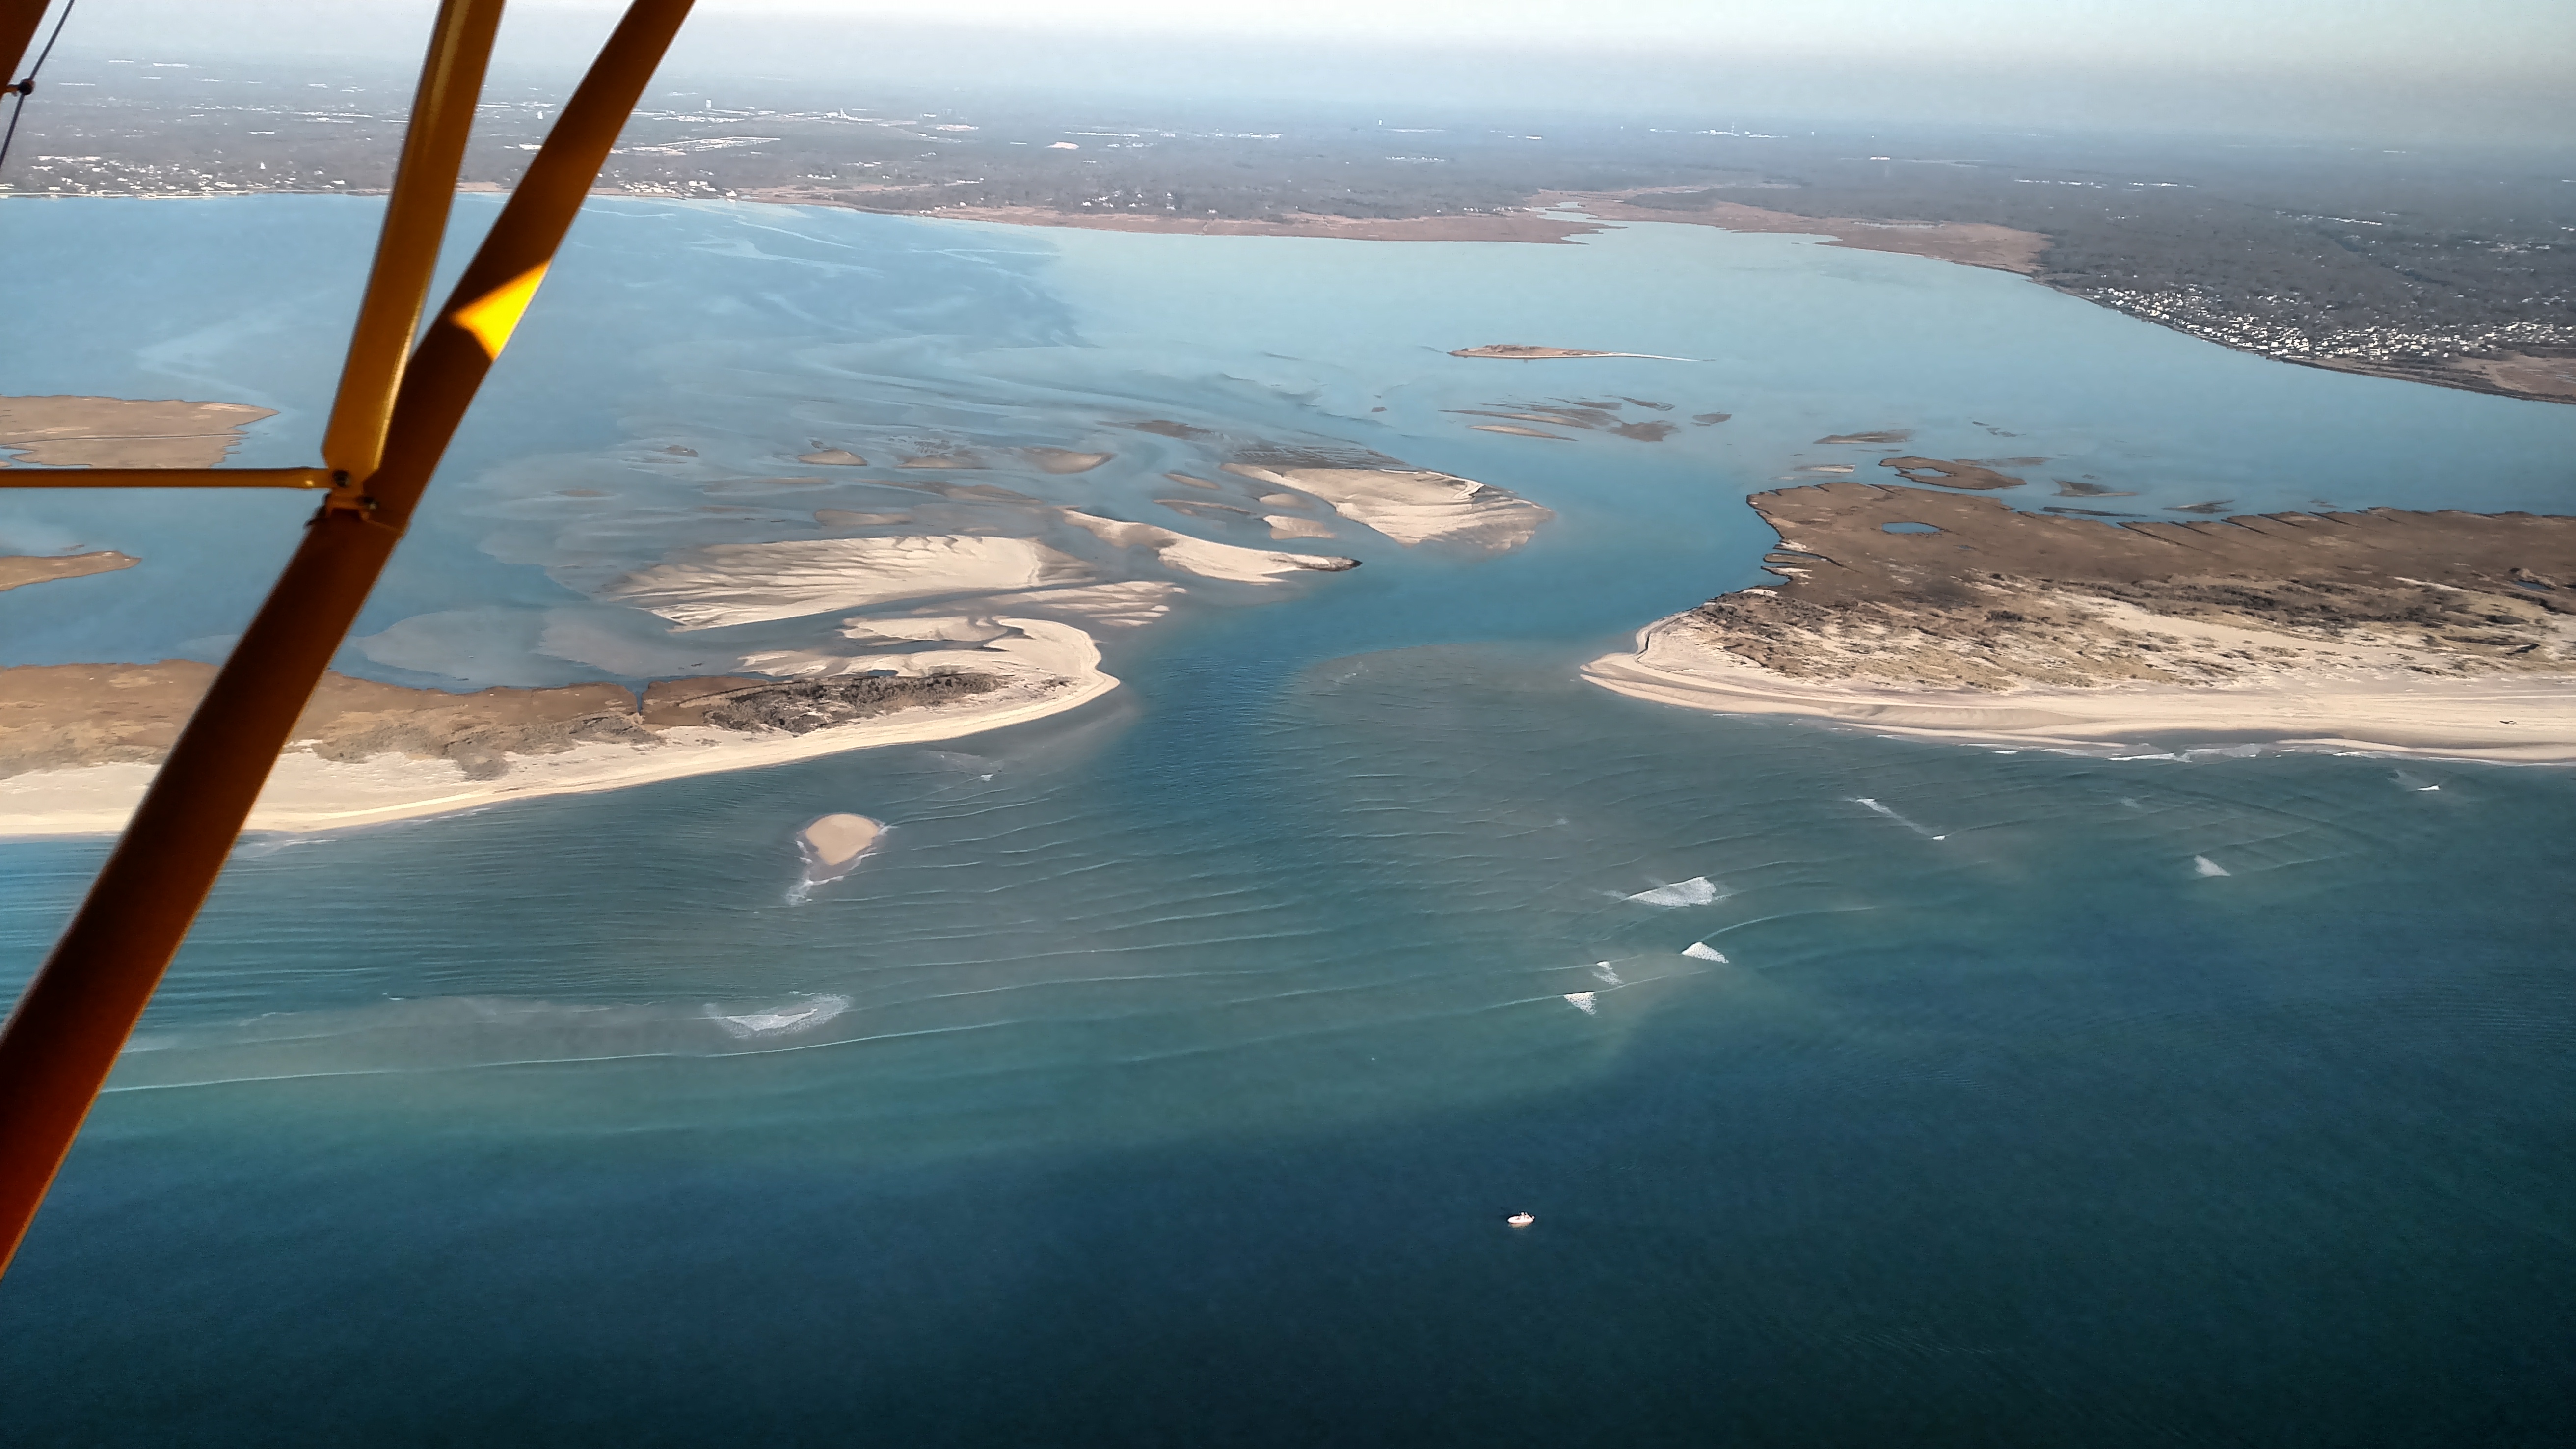 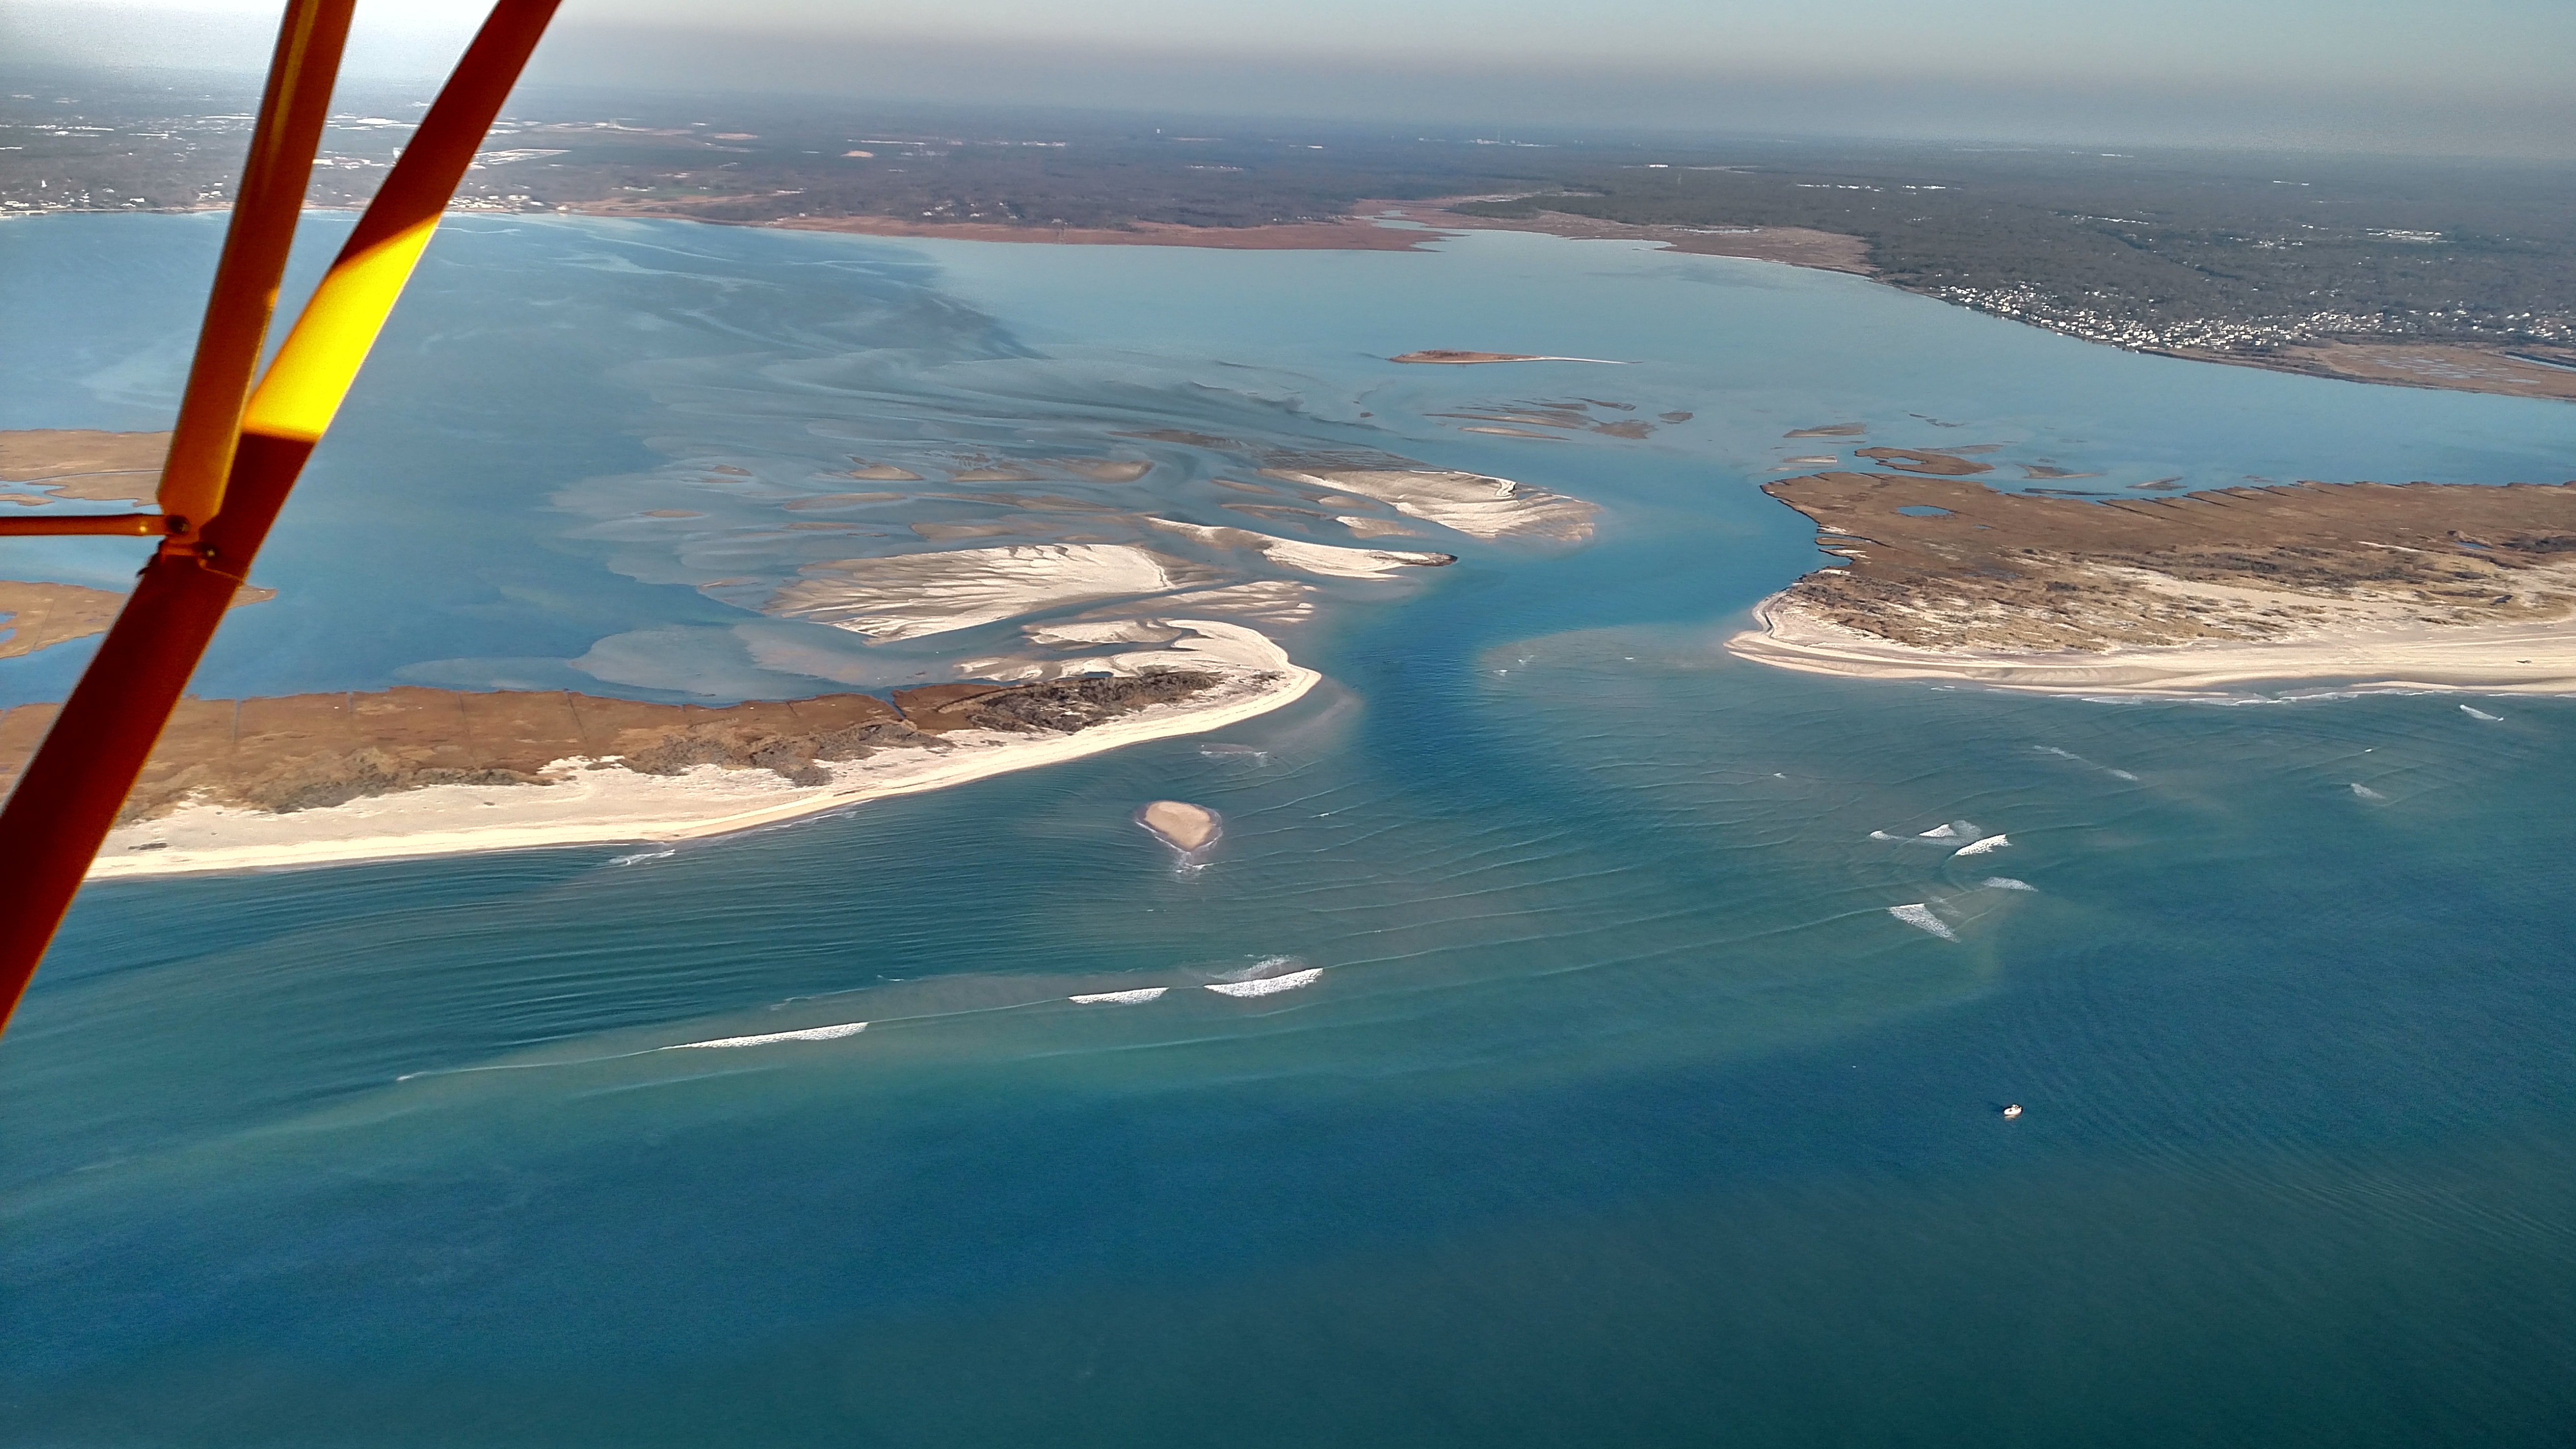 |
Jan 6, 2016 (RG&CF)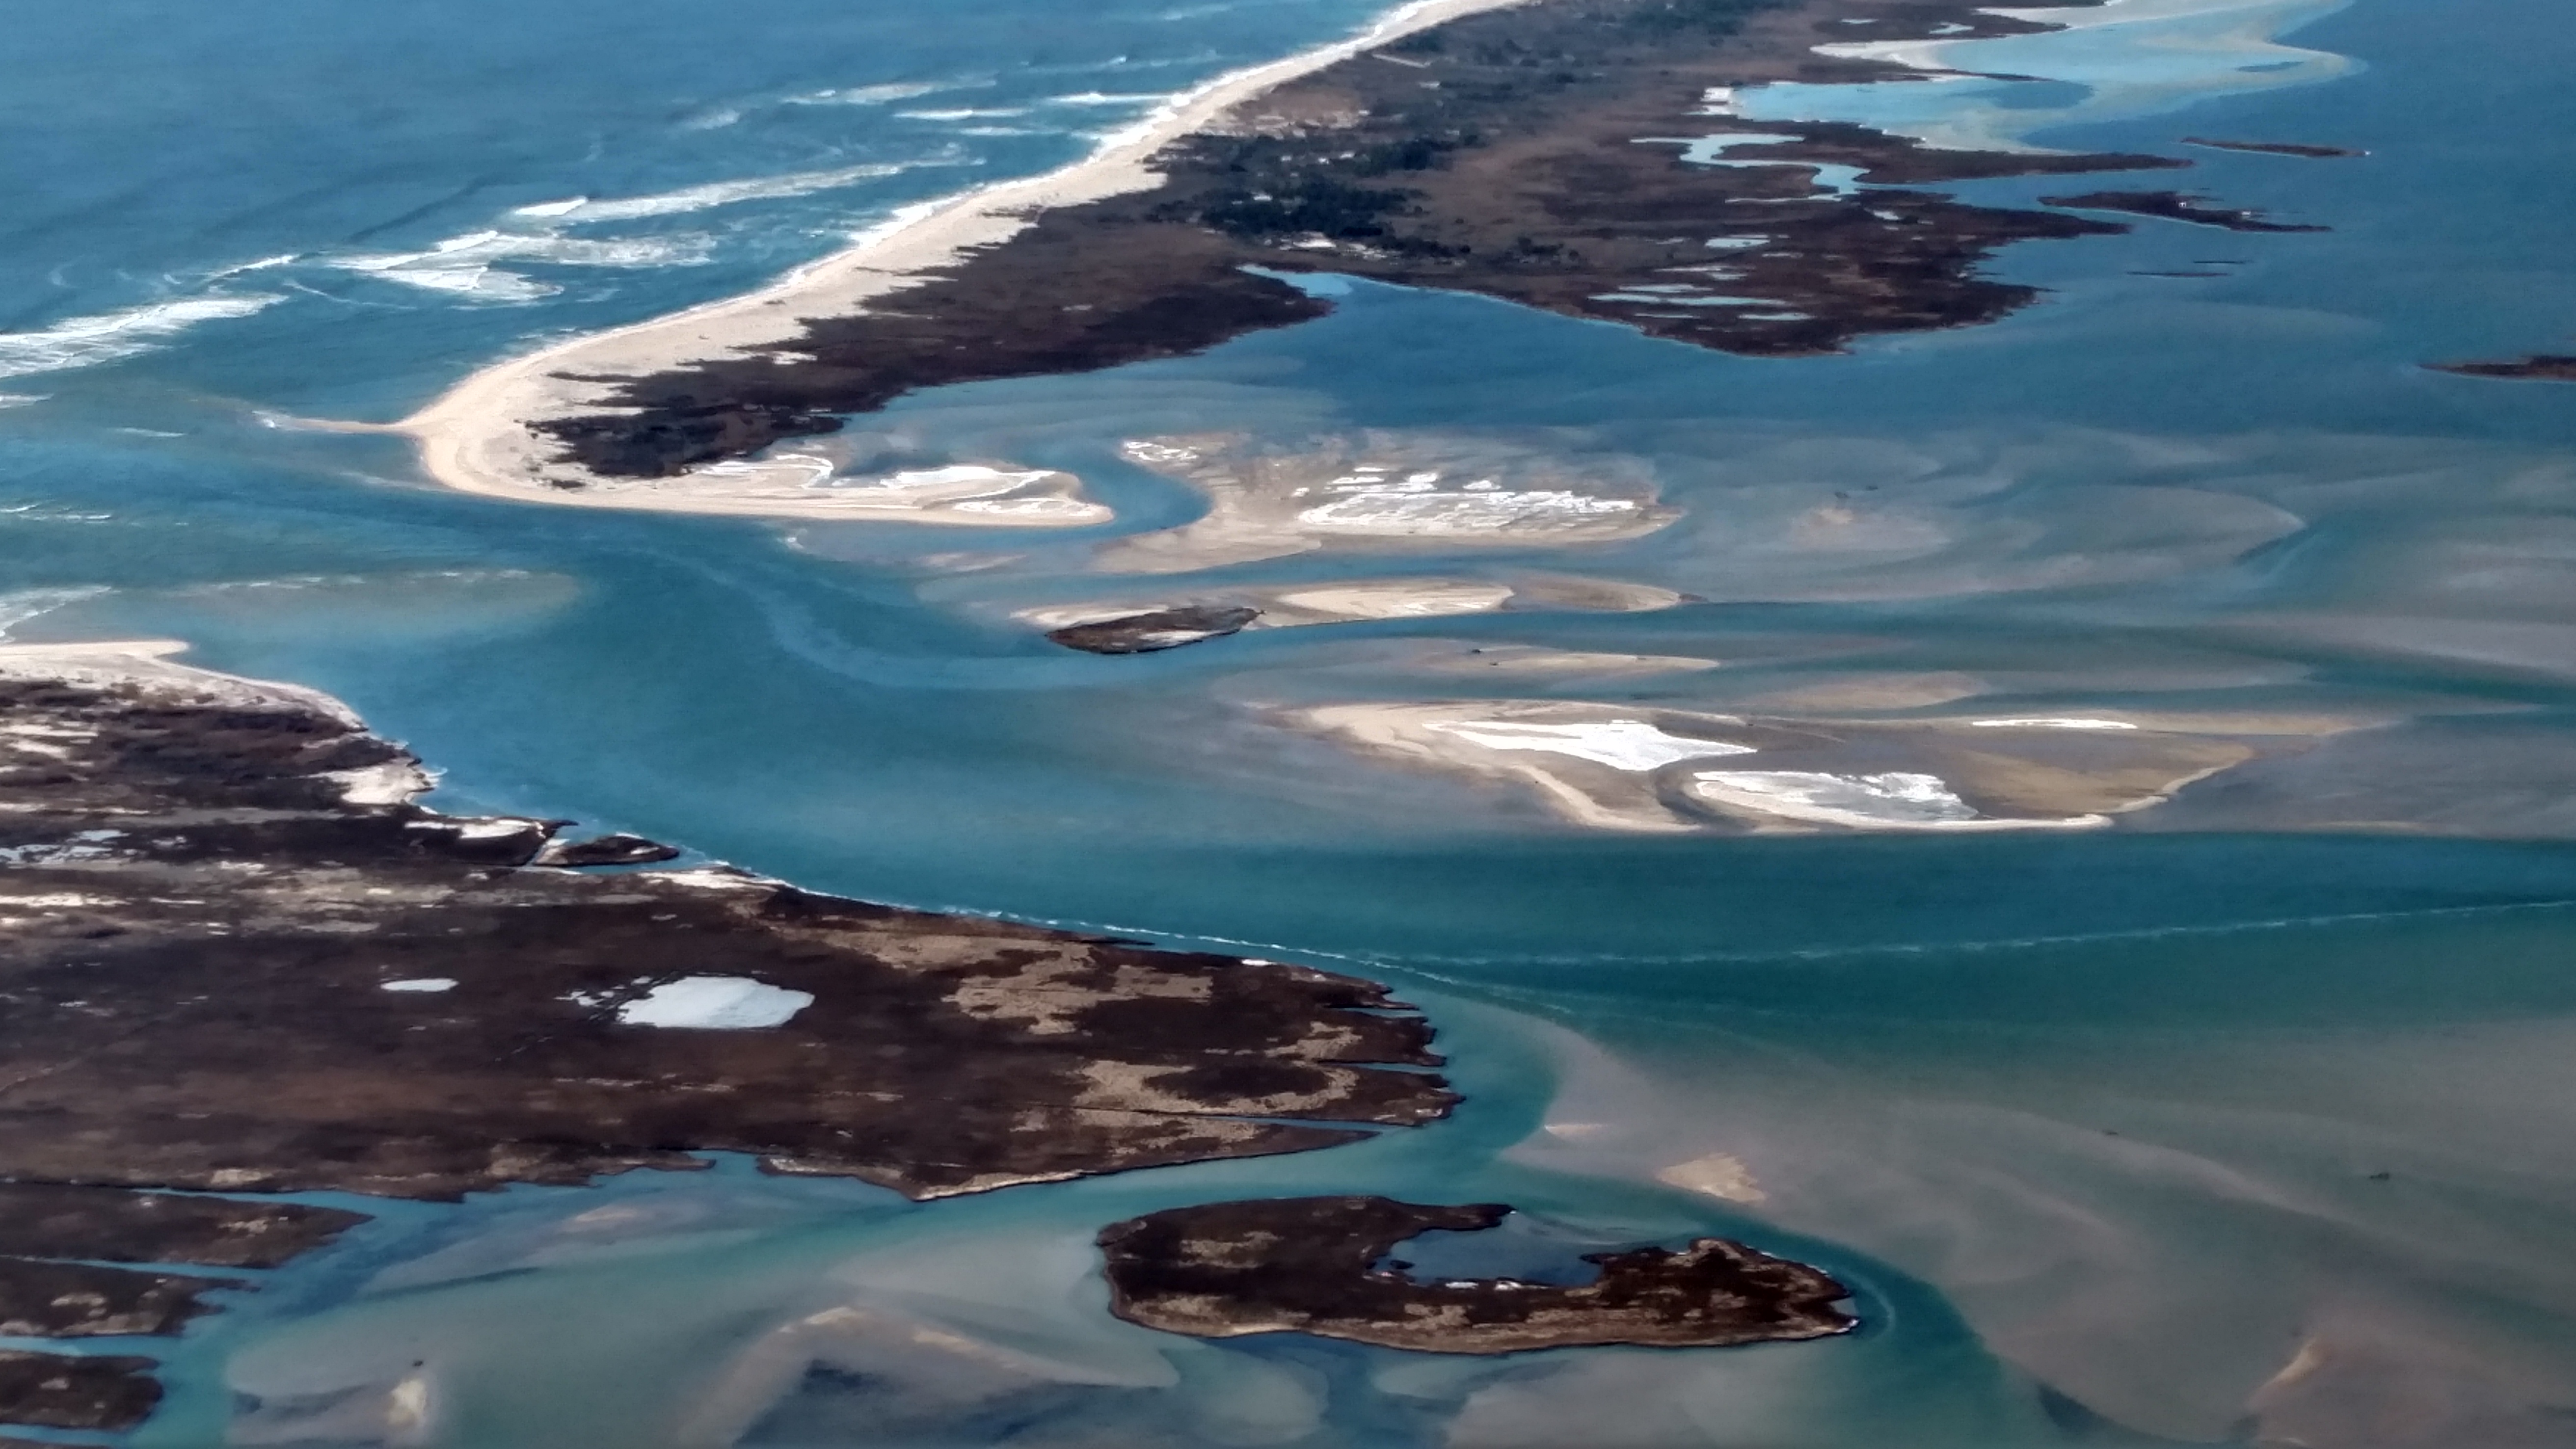 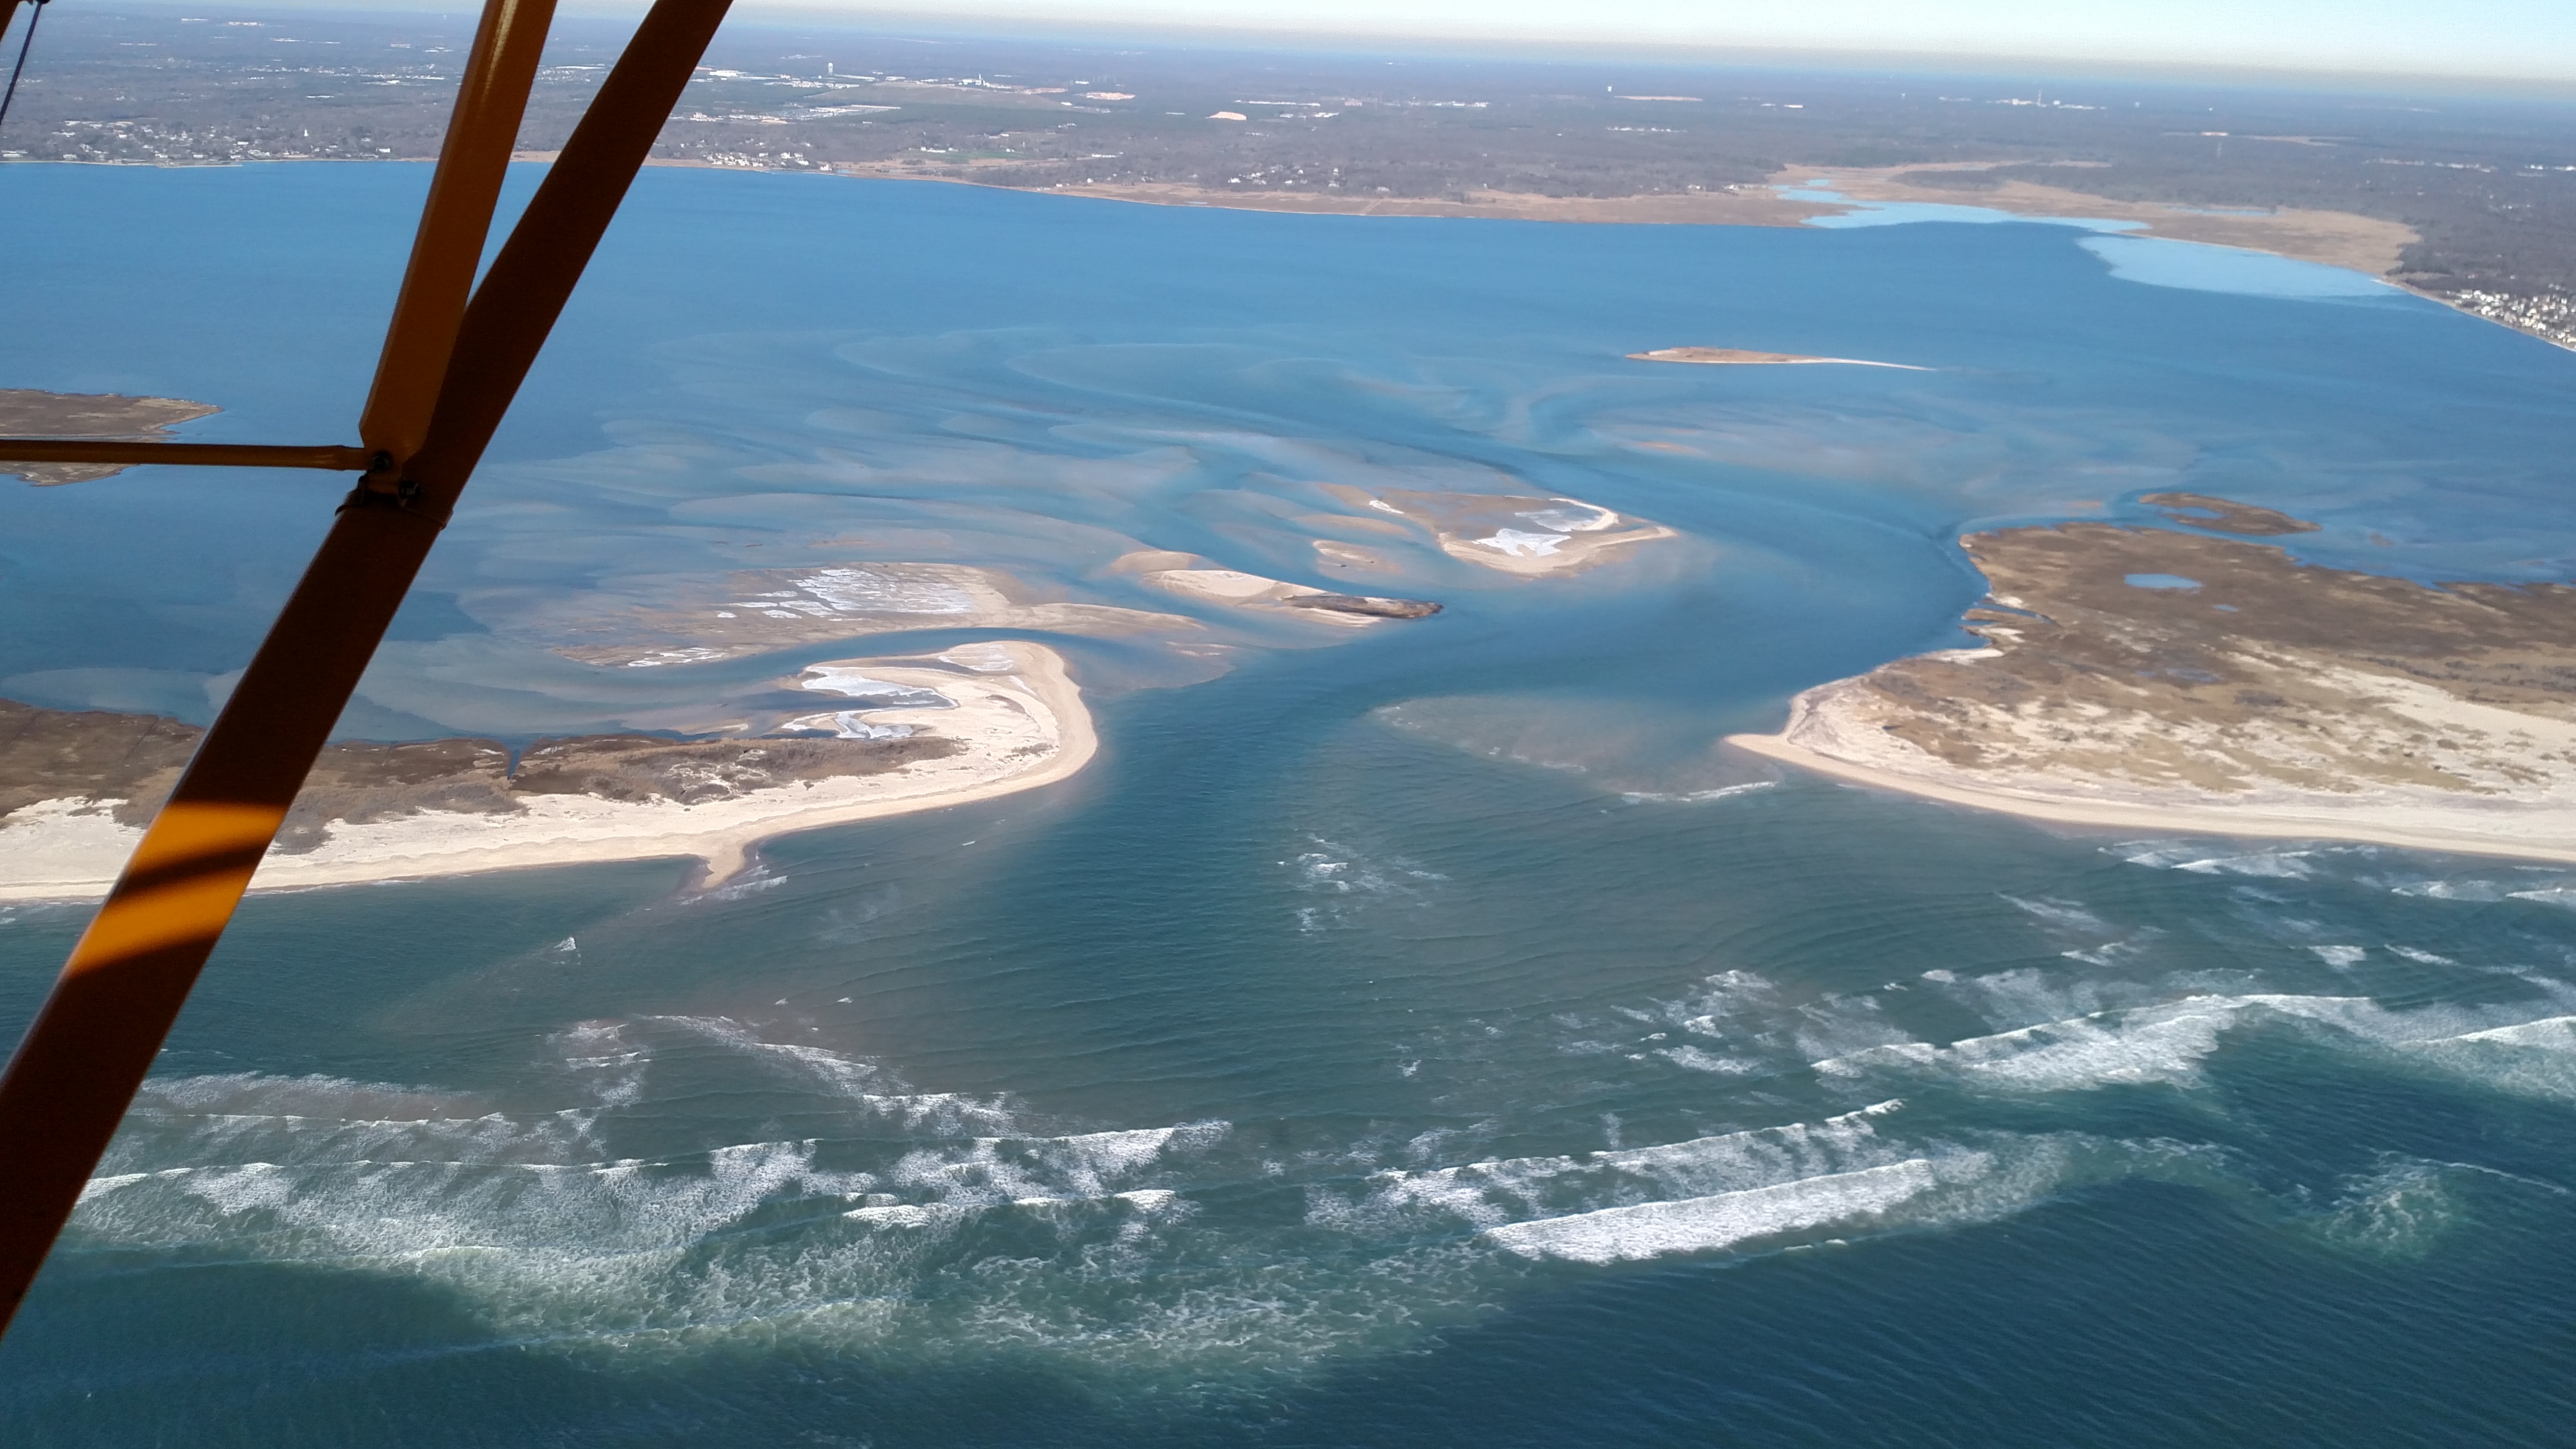 |
||||
Jan 31, 2016 (RG&CF)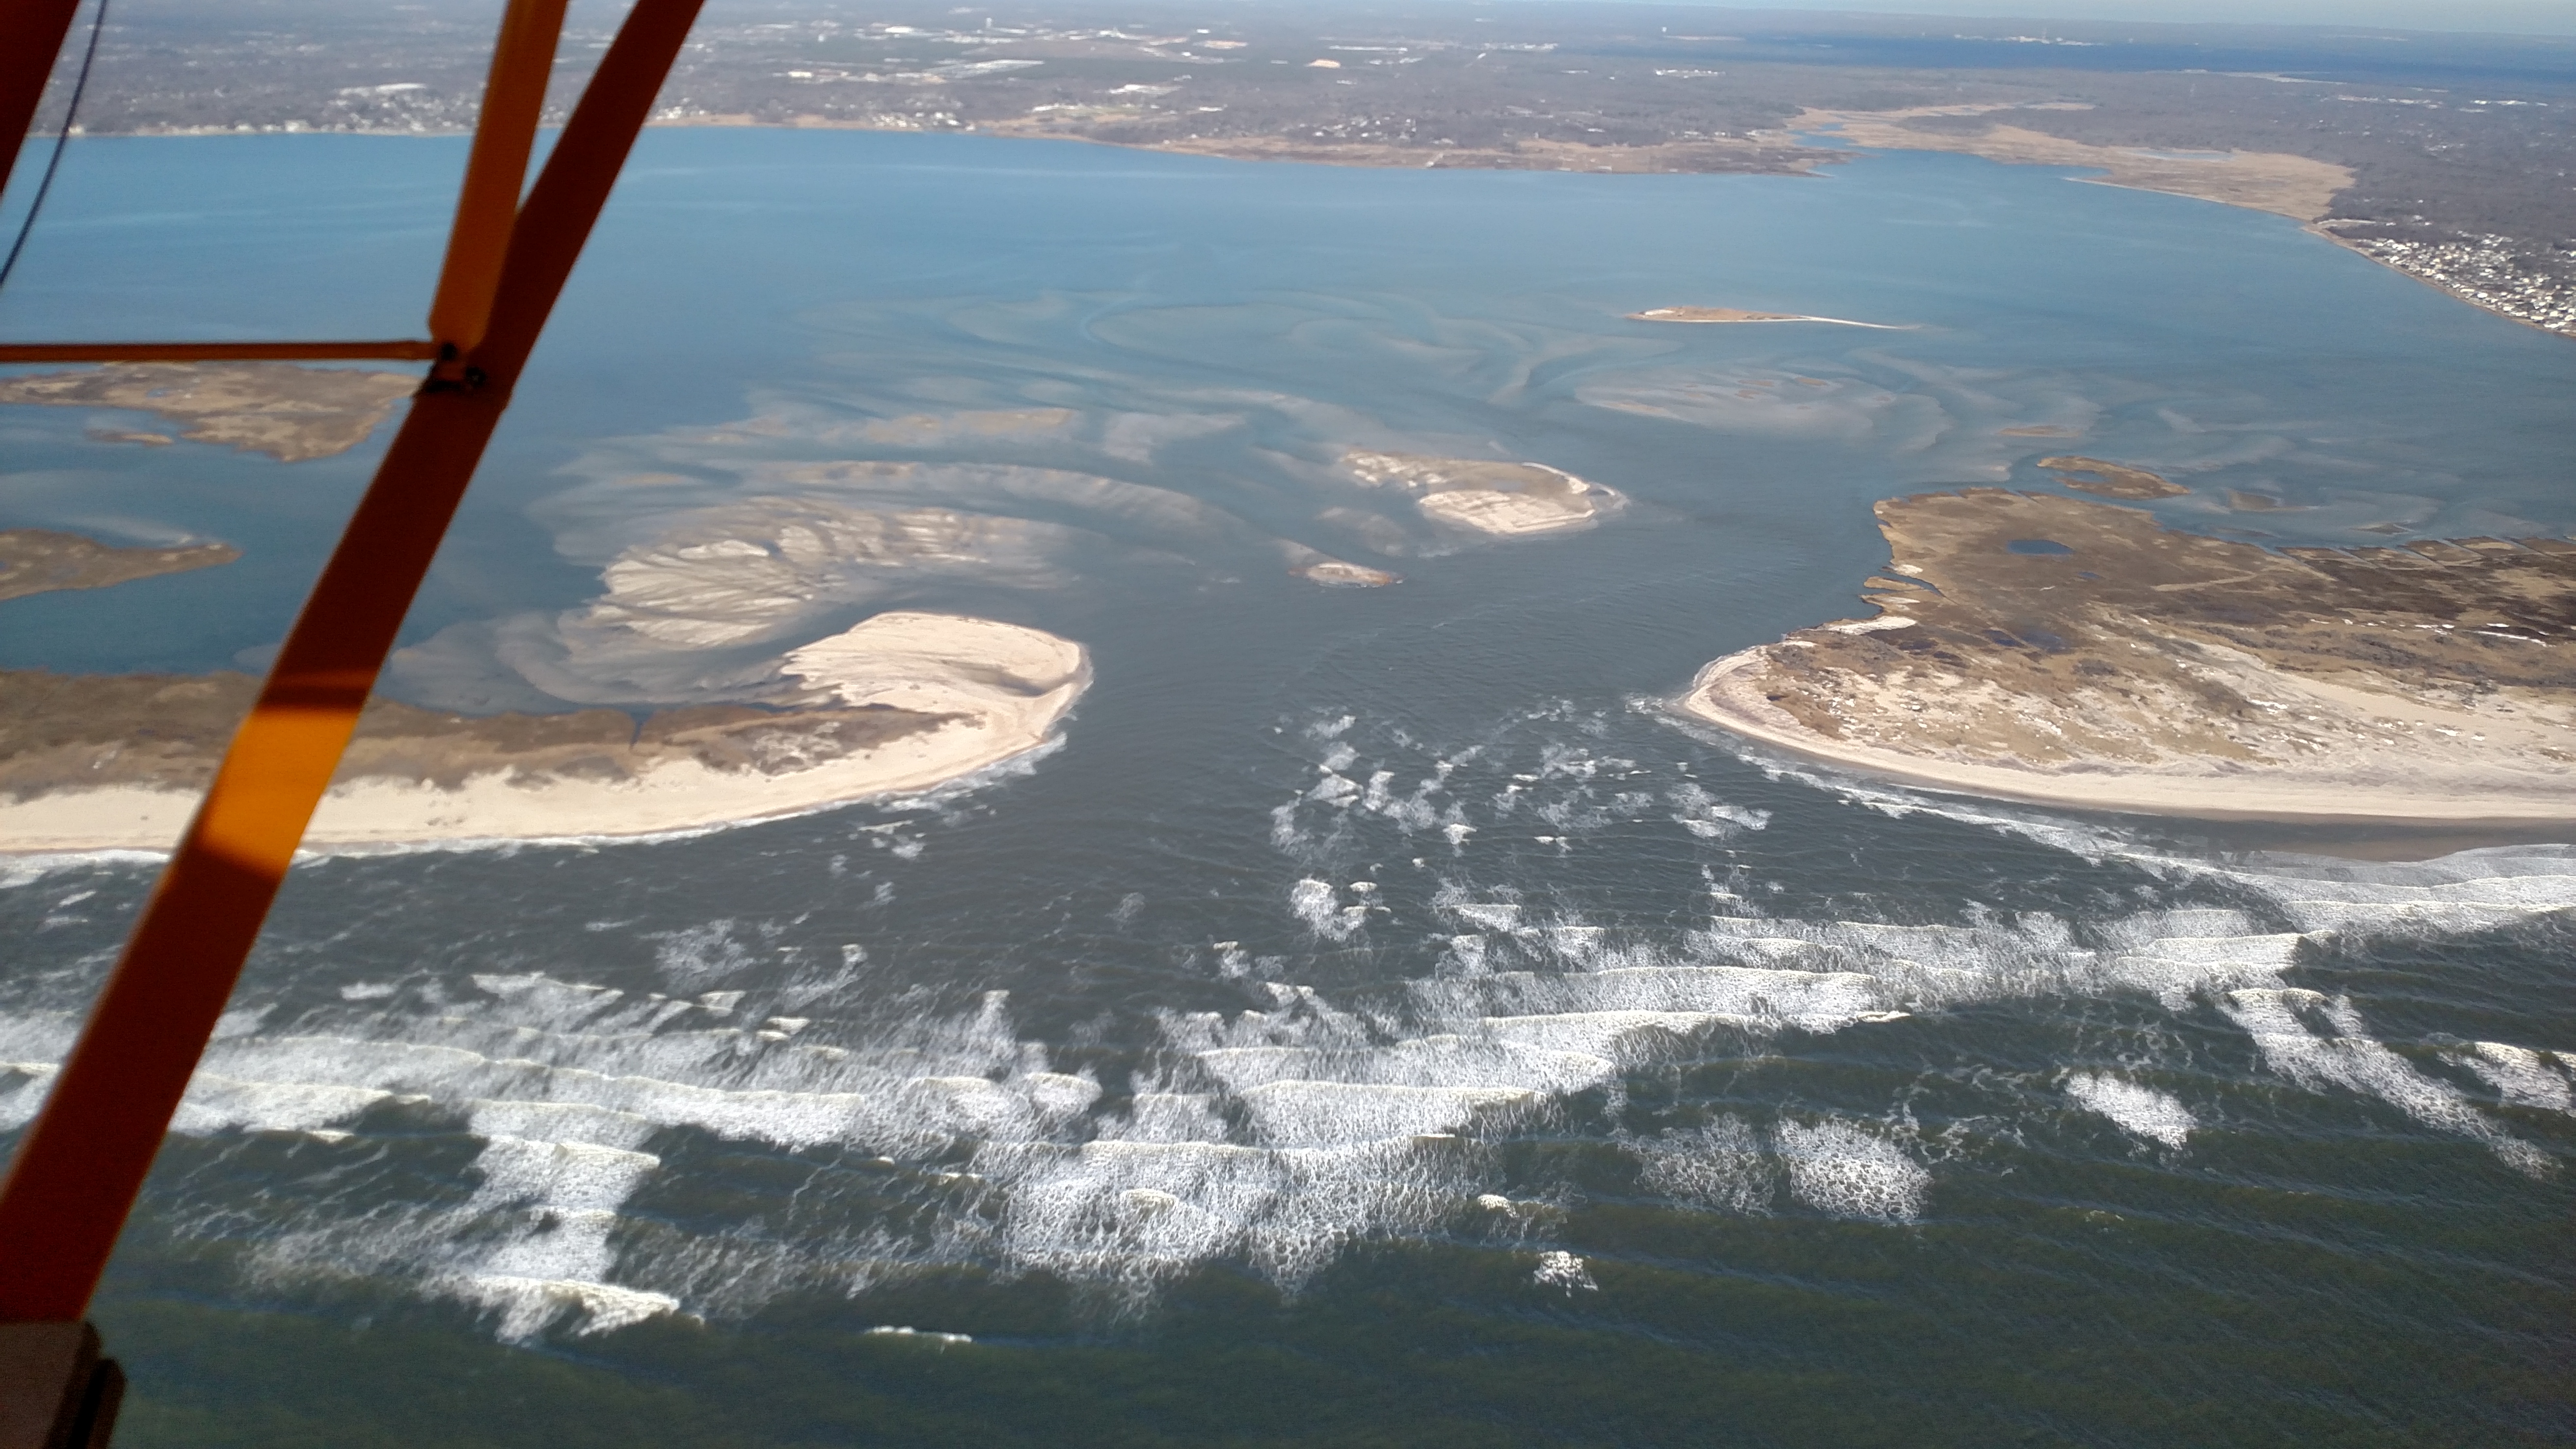 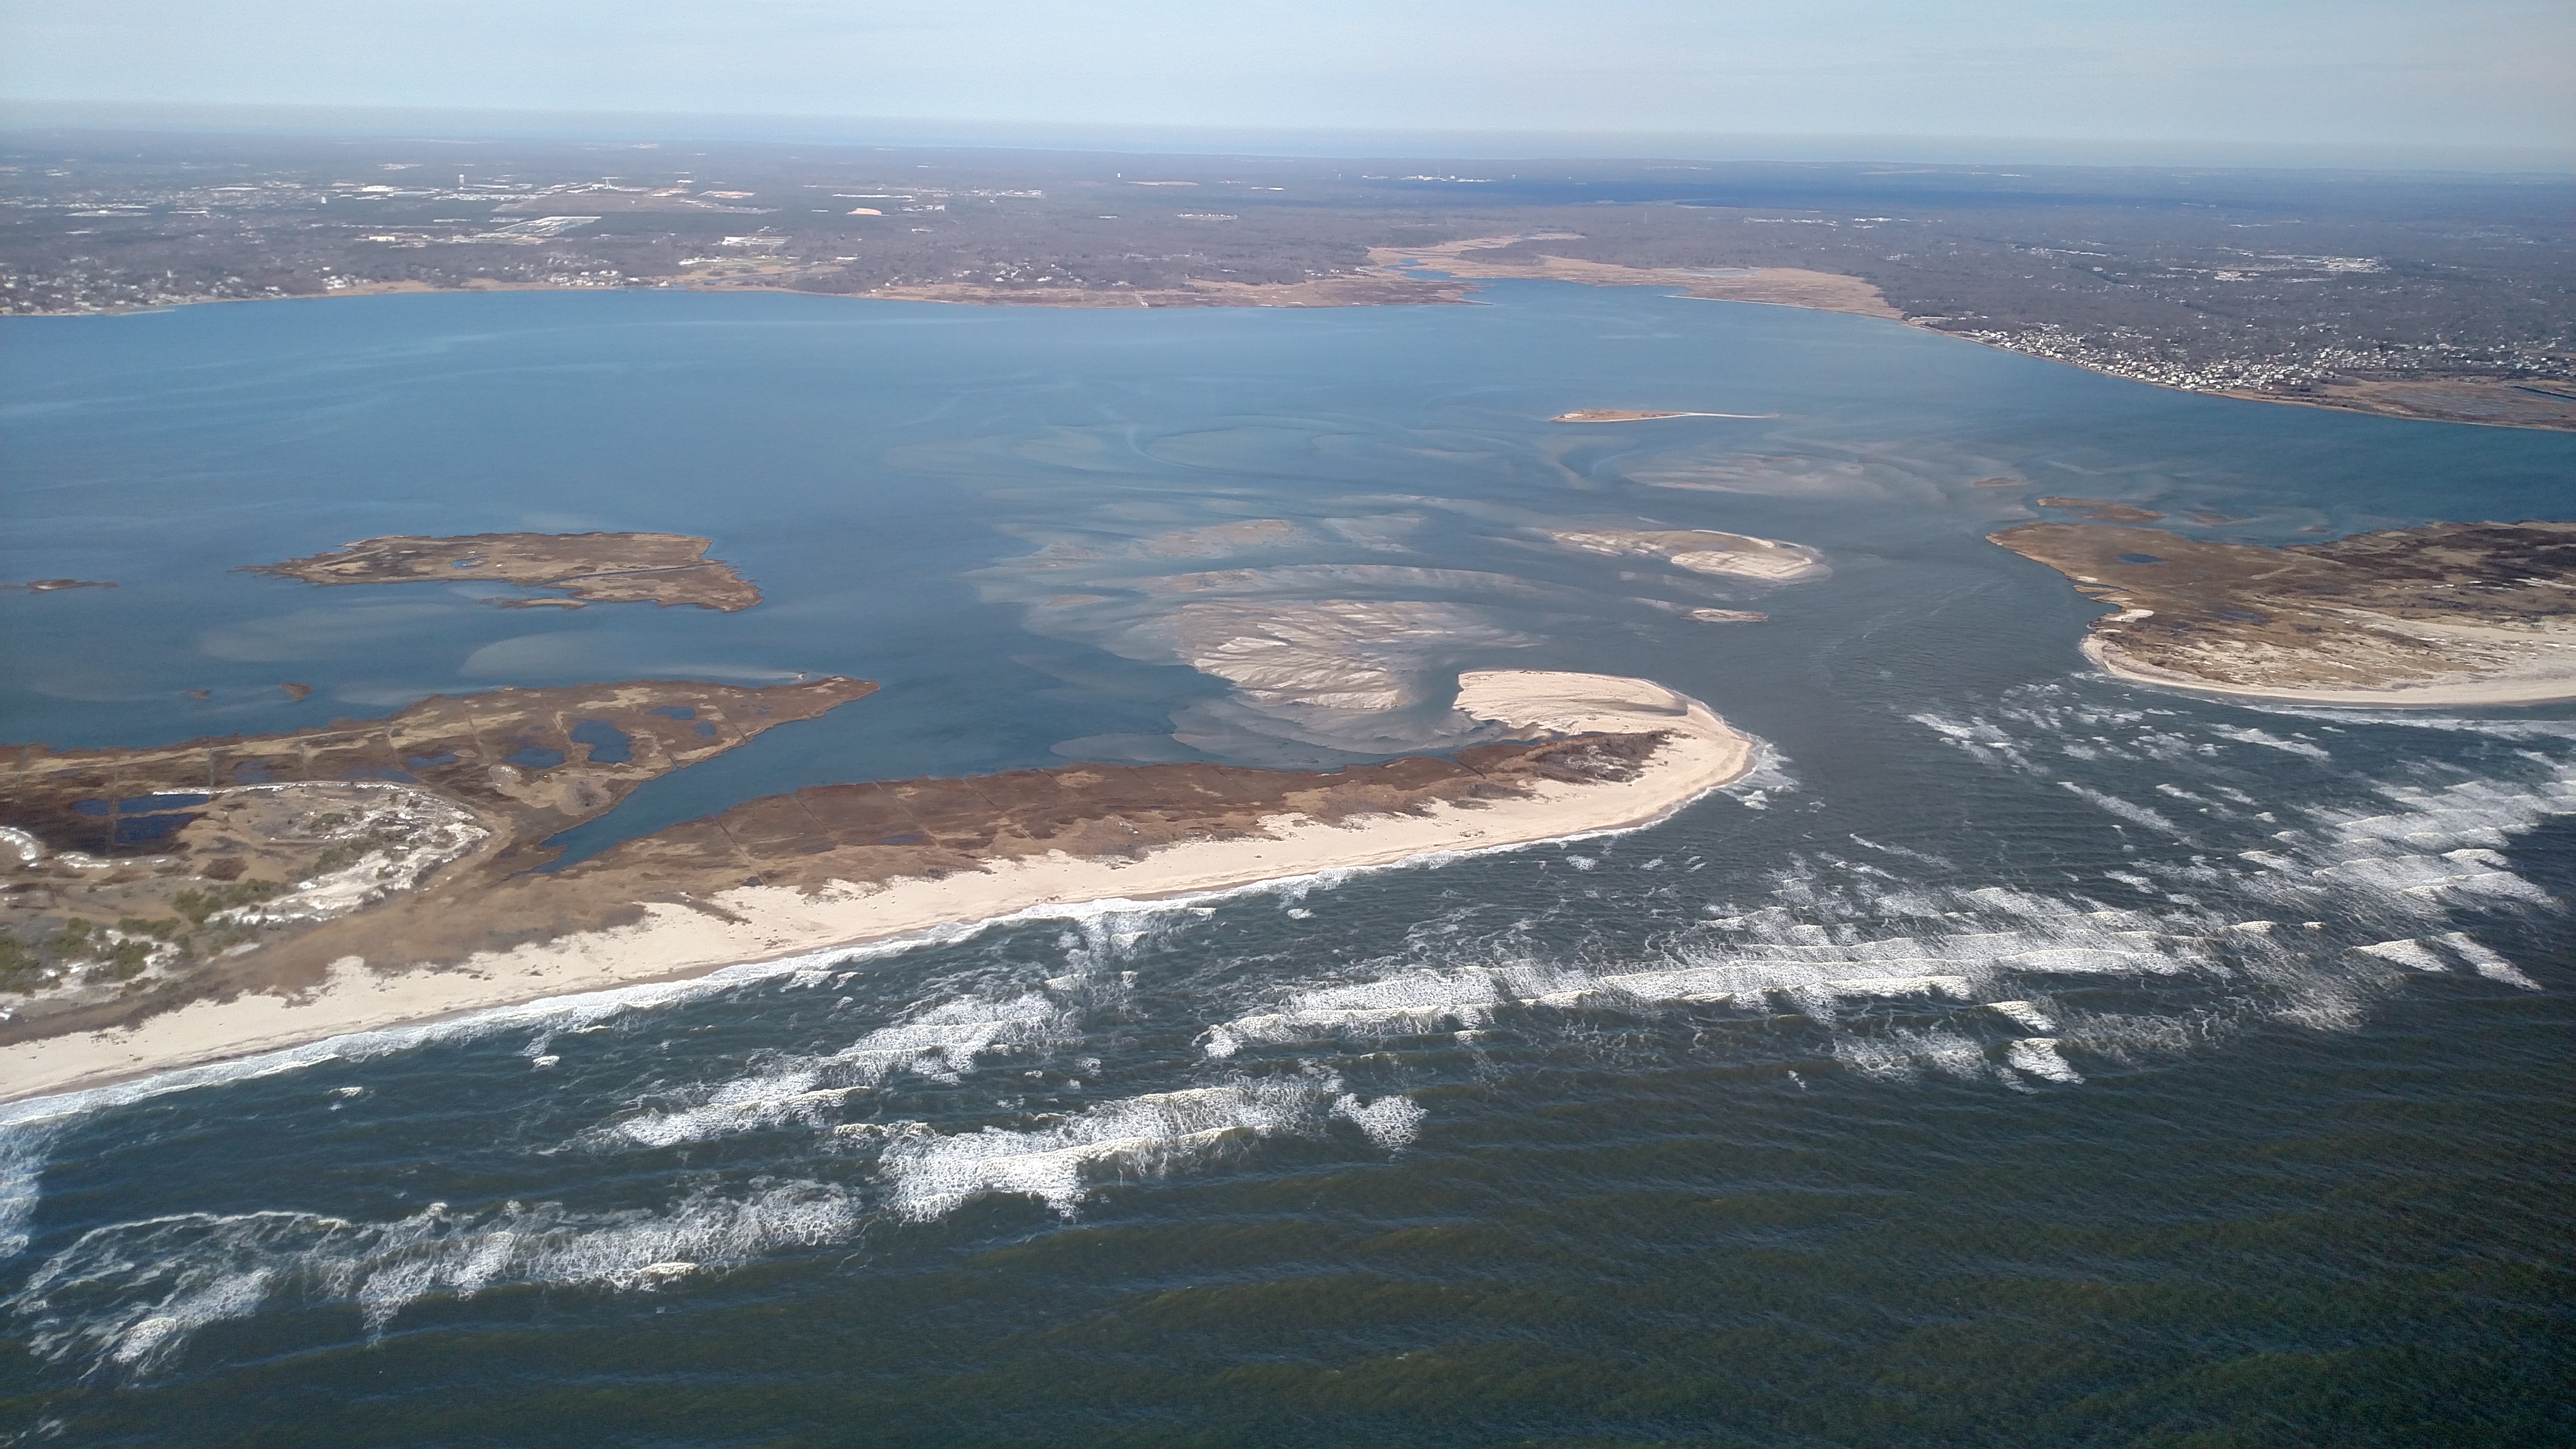 |
Mar 1, 2016 (JV)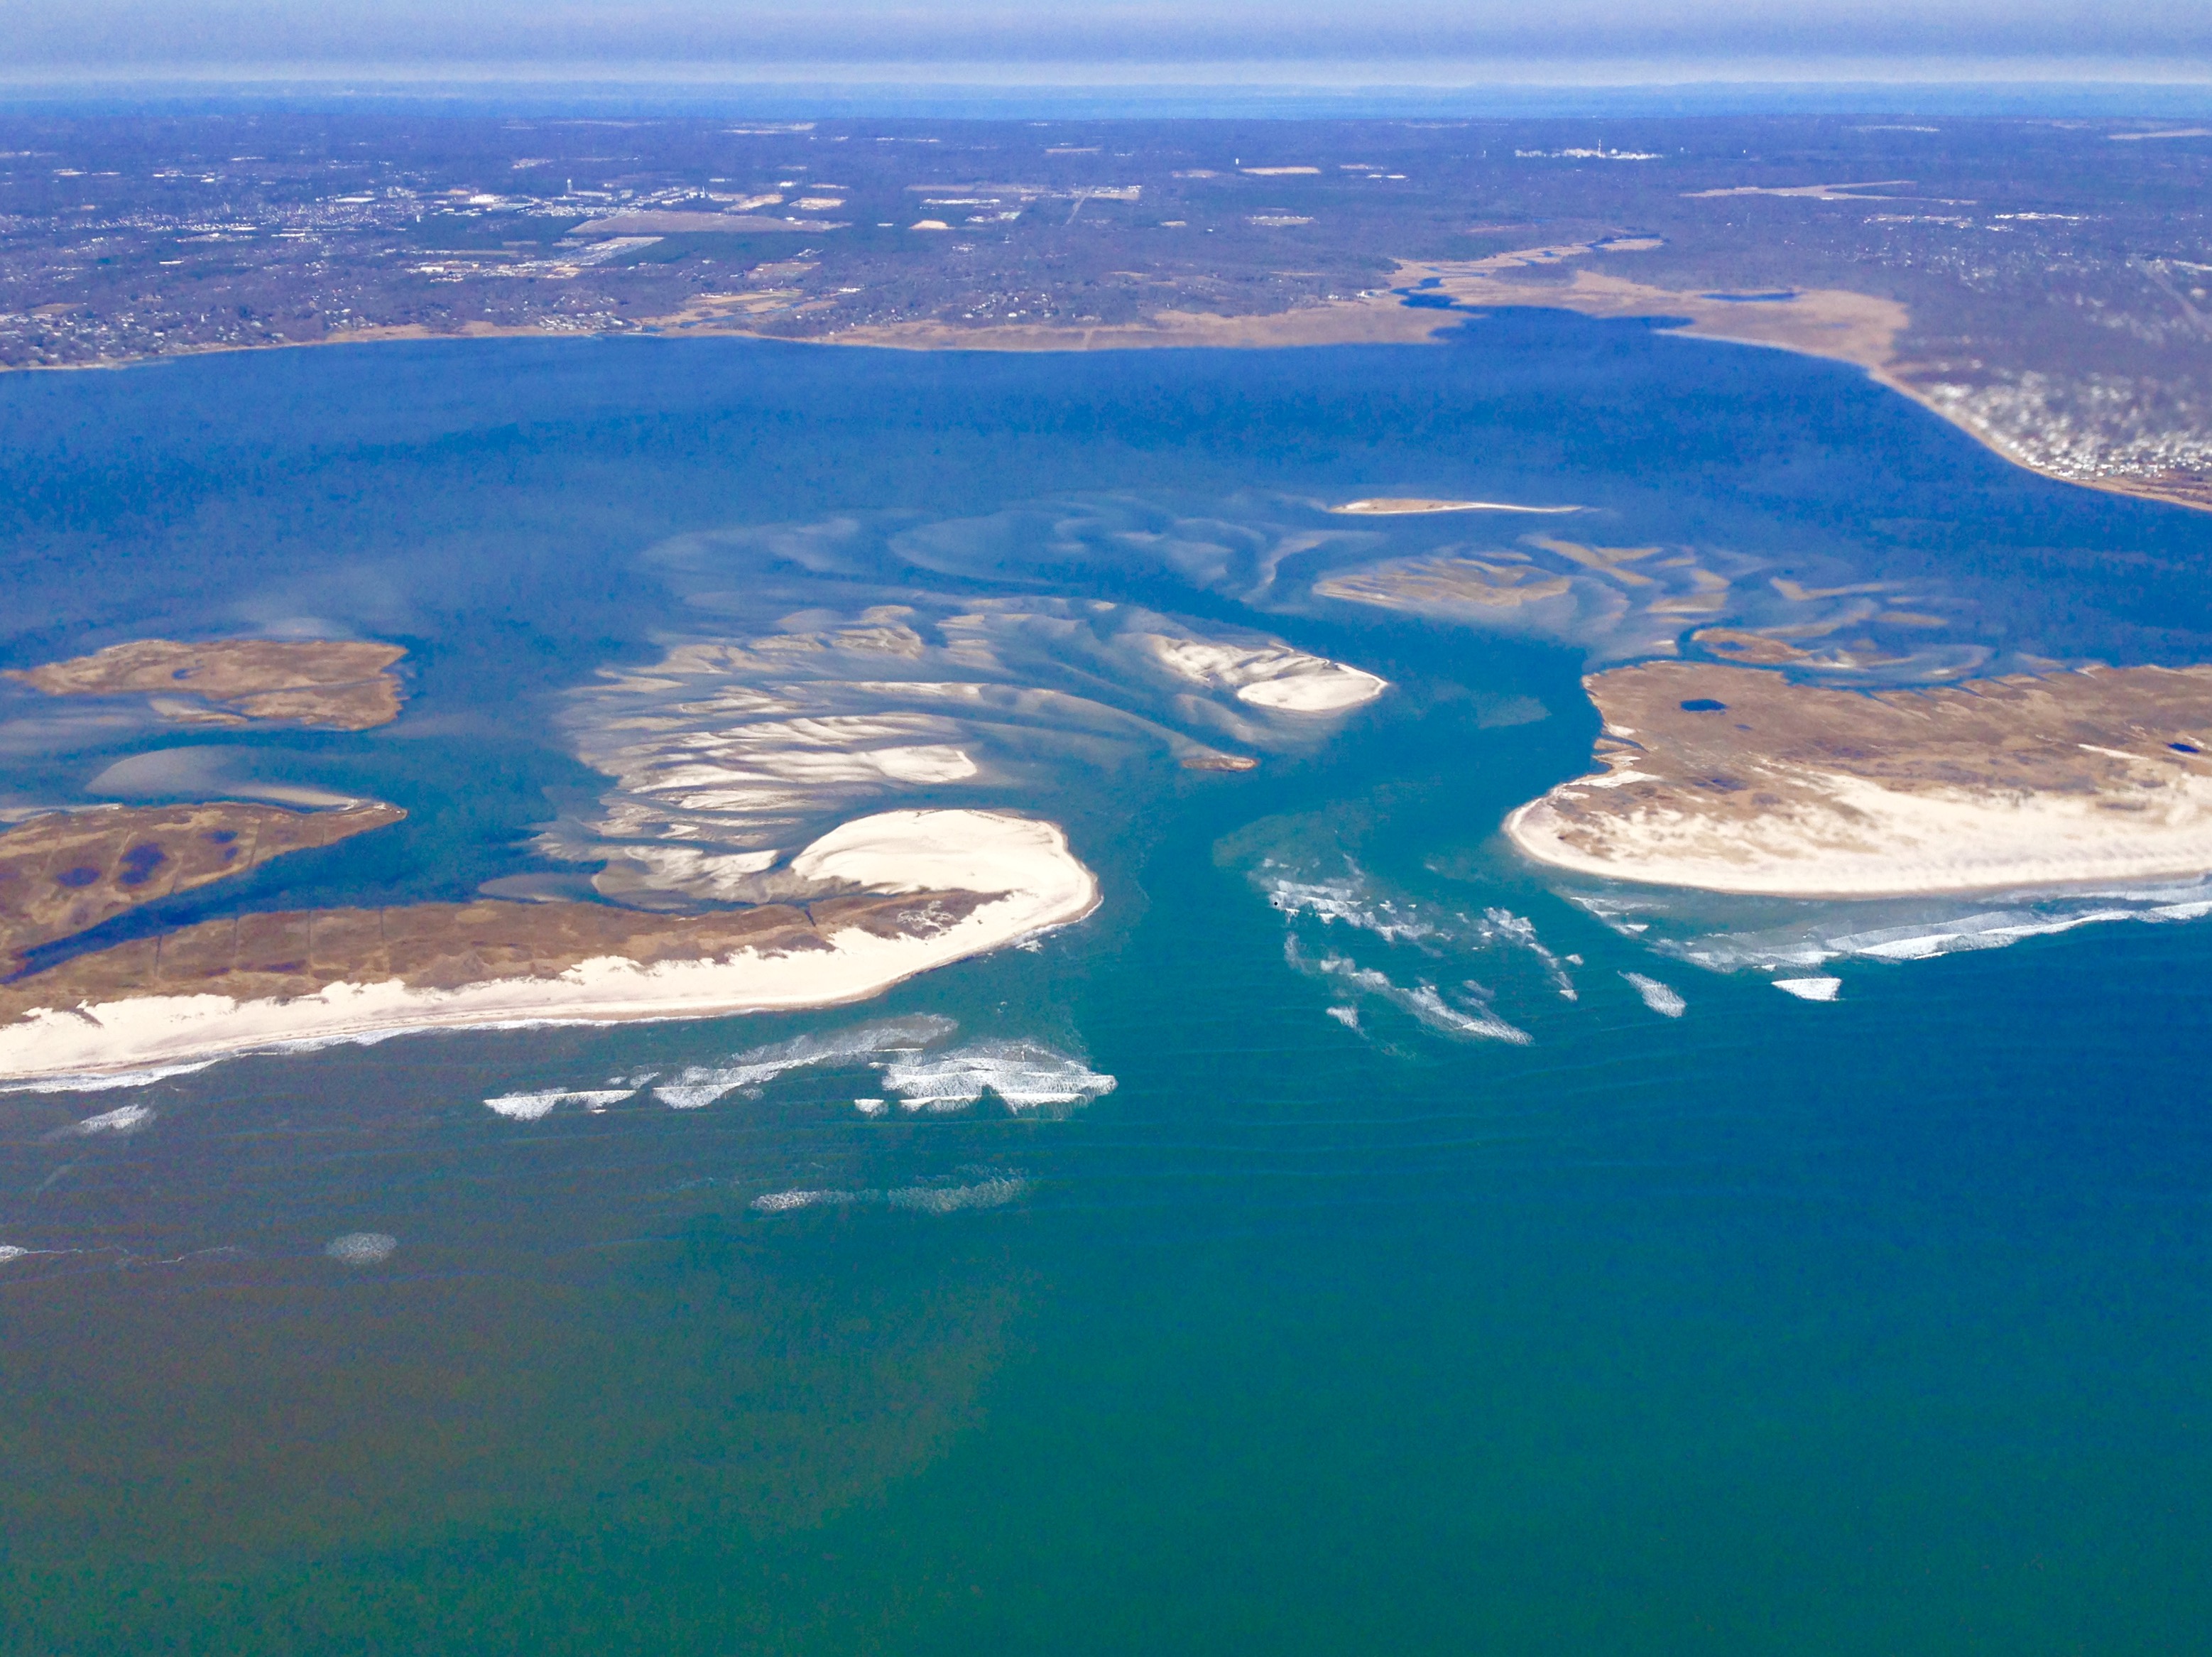 |
Mar 8, 2016 (RG&CF)  |
Apr 13, 2016 (CF)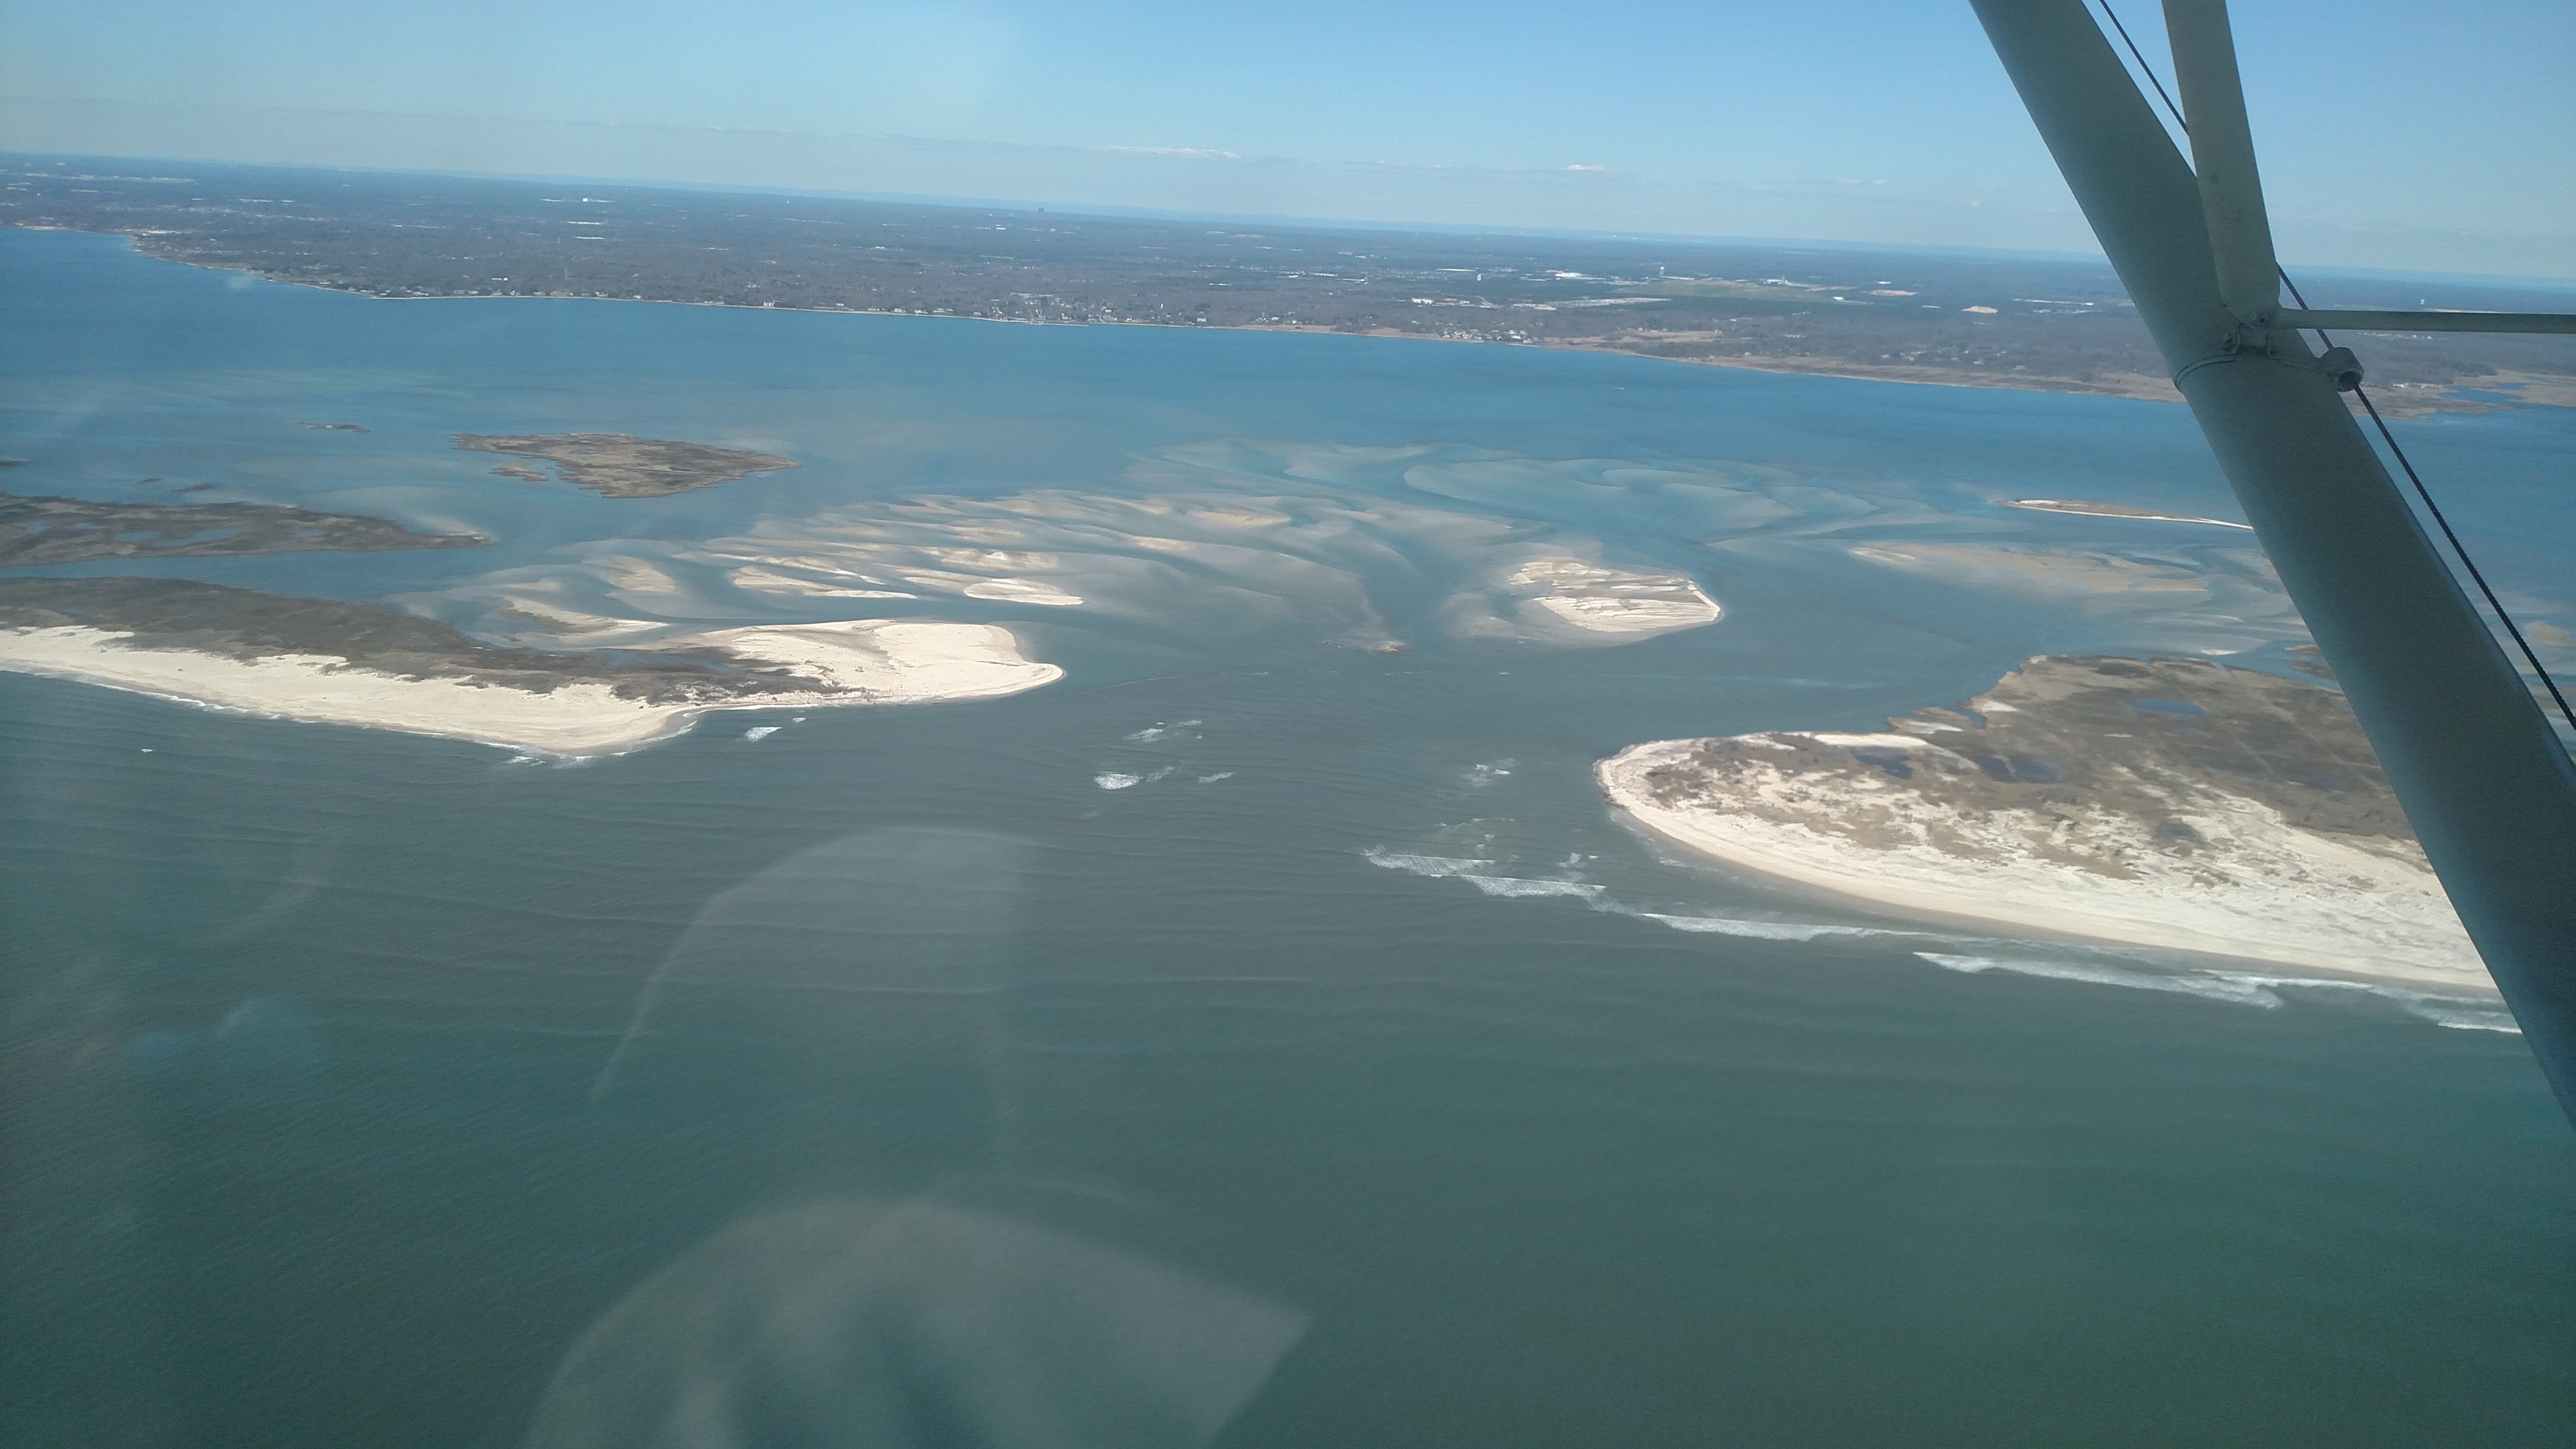  |
||||
May 11, 2016 (CF)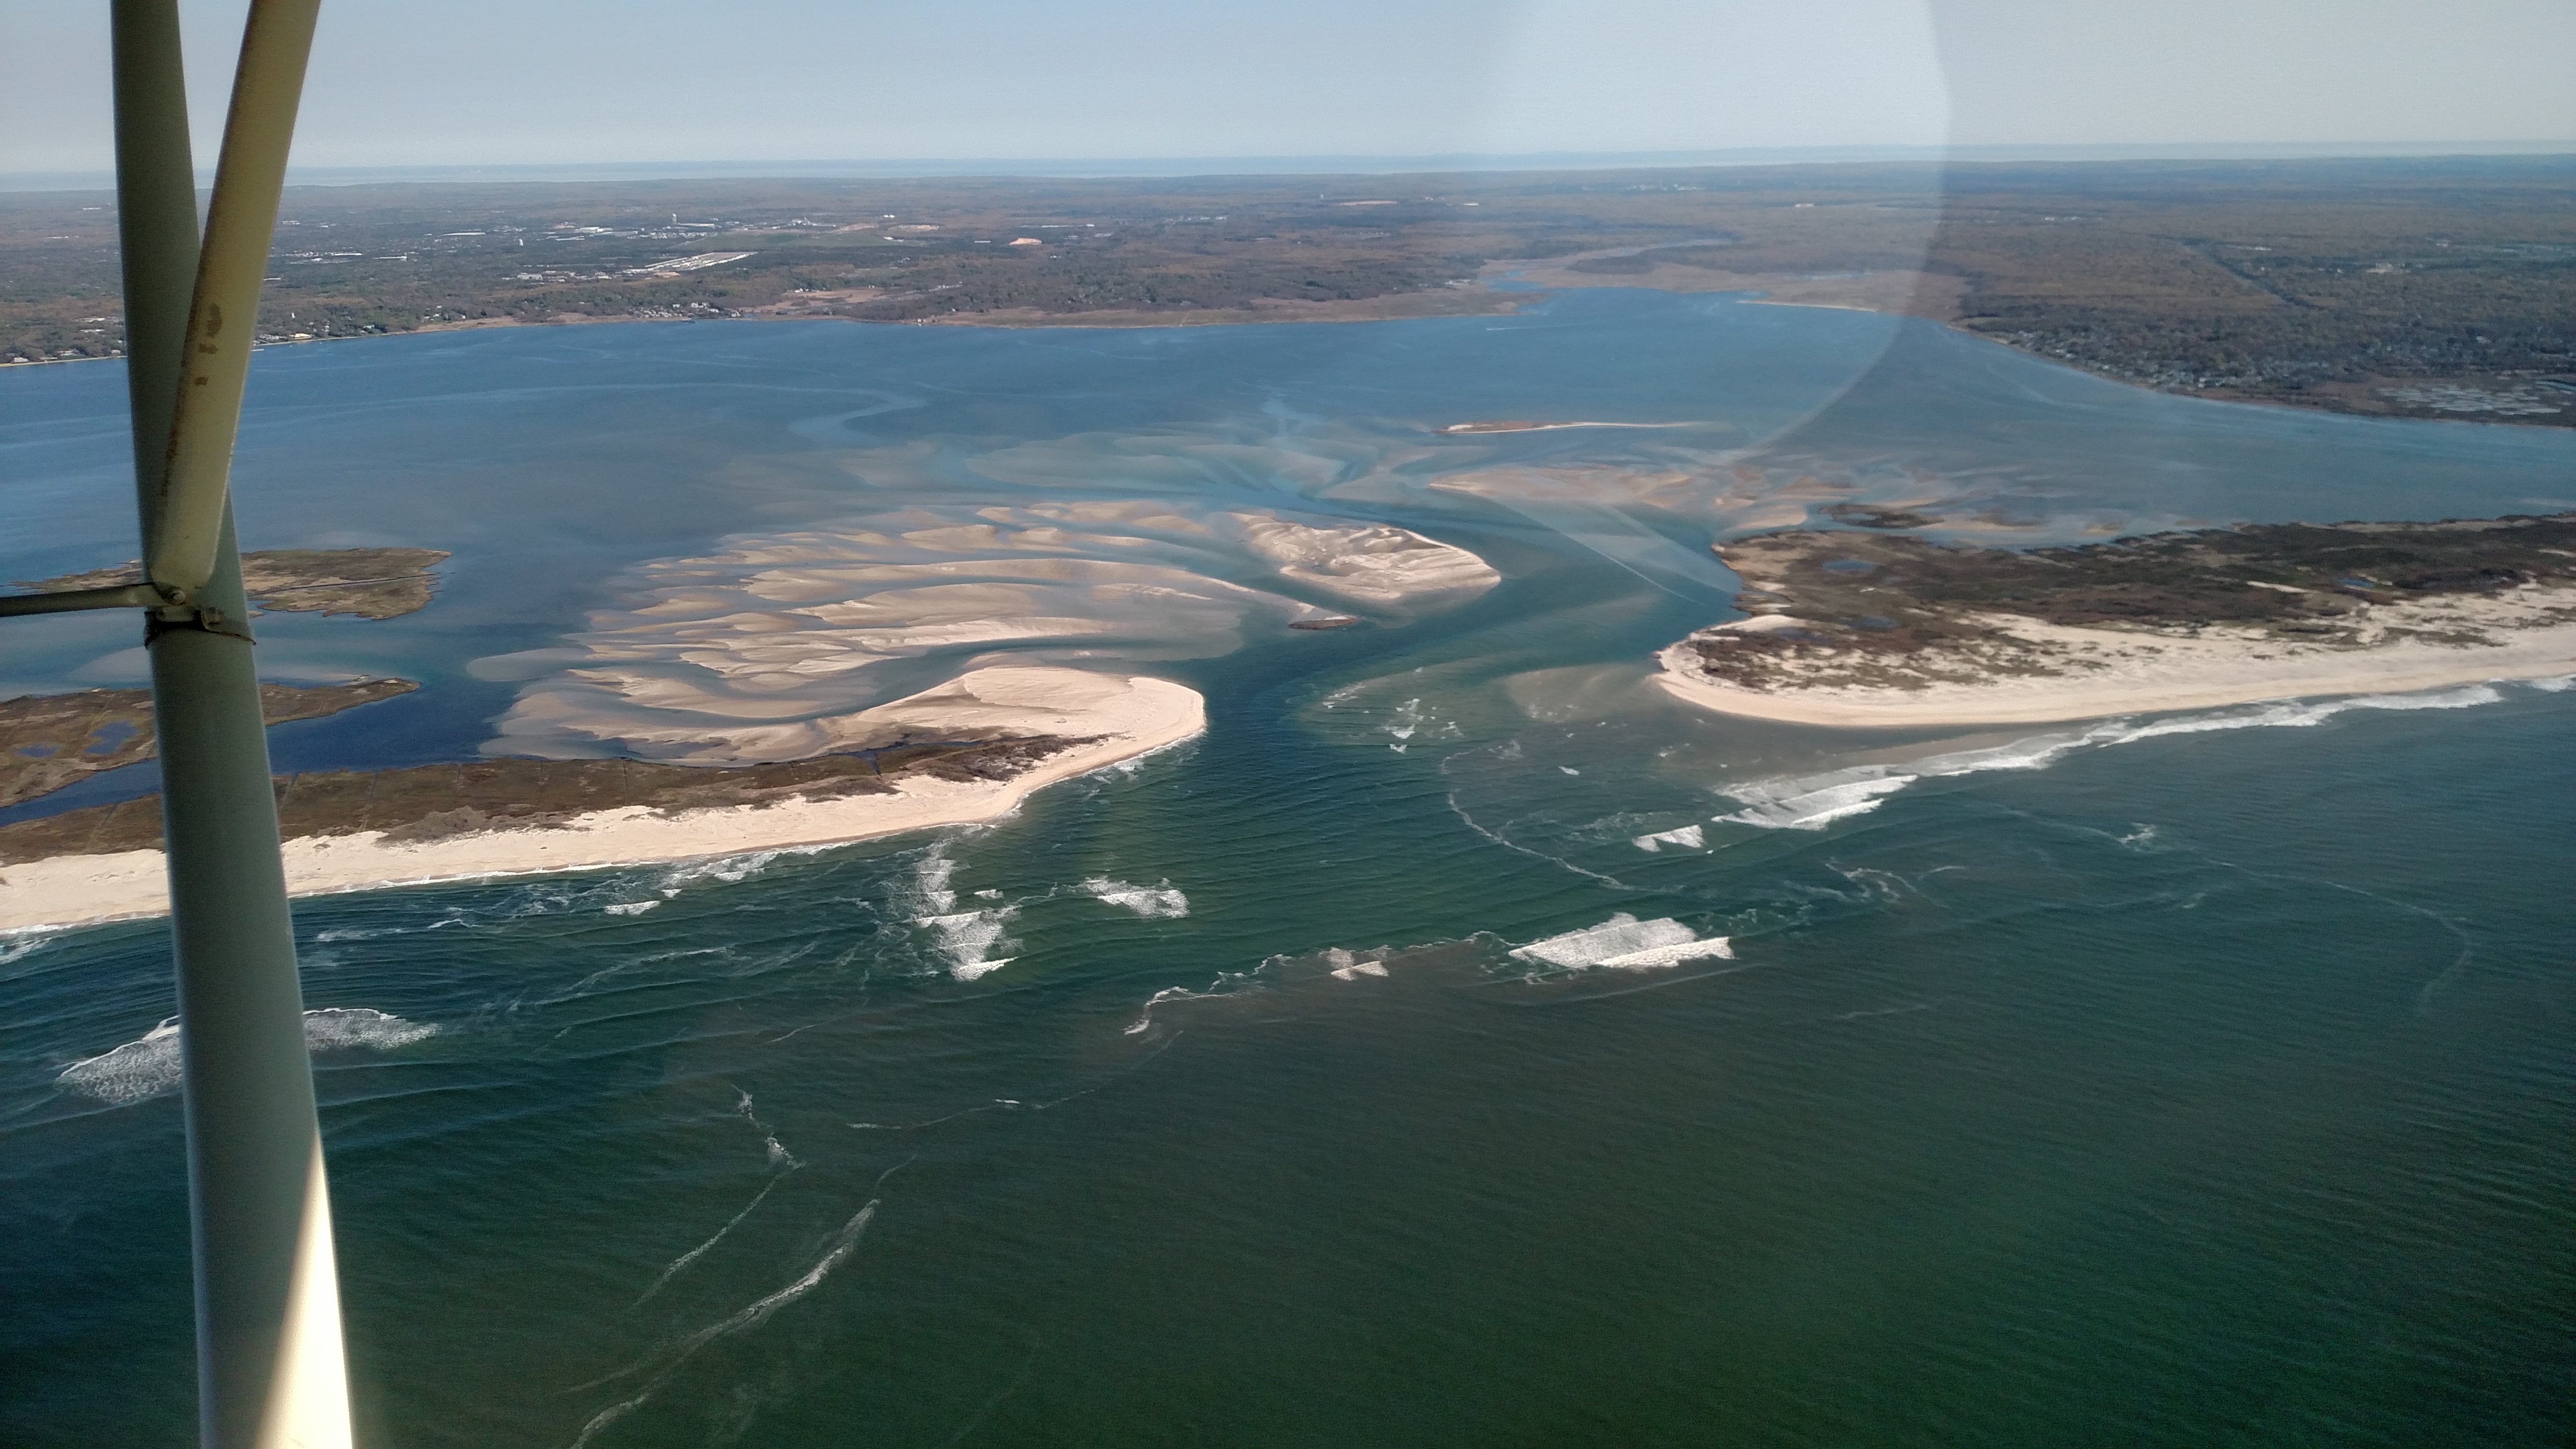  |
June 1, 2016 (CF)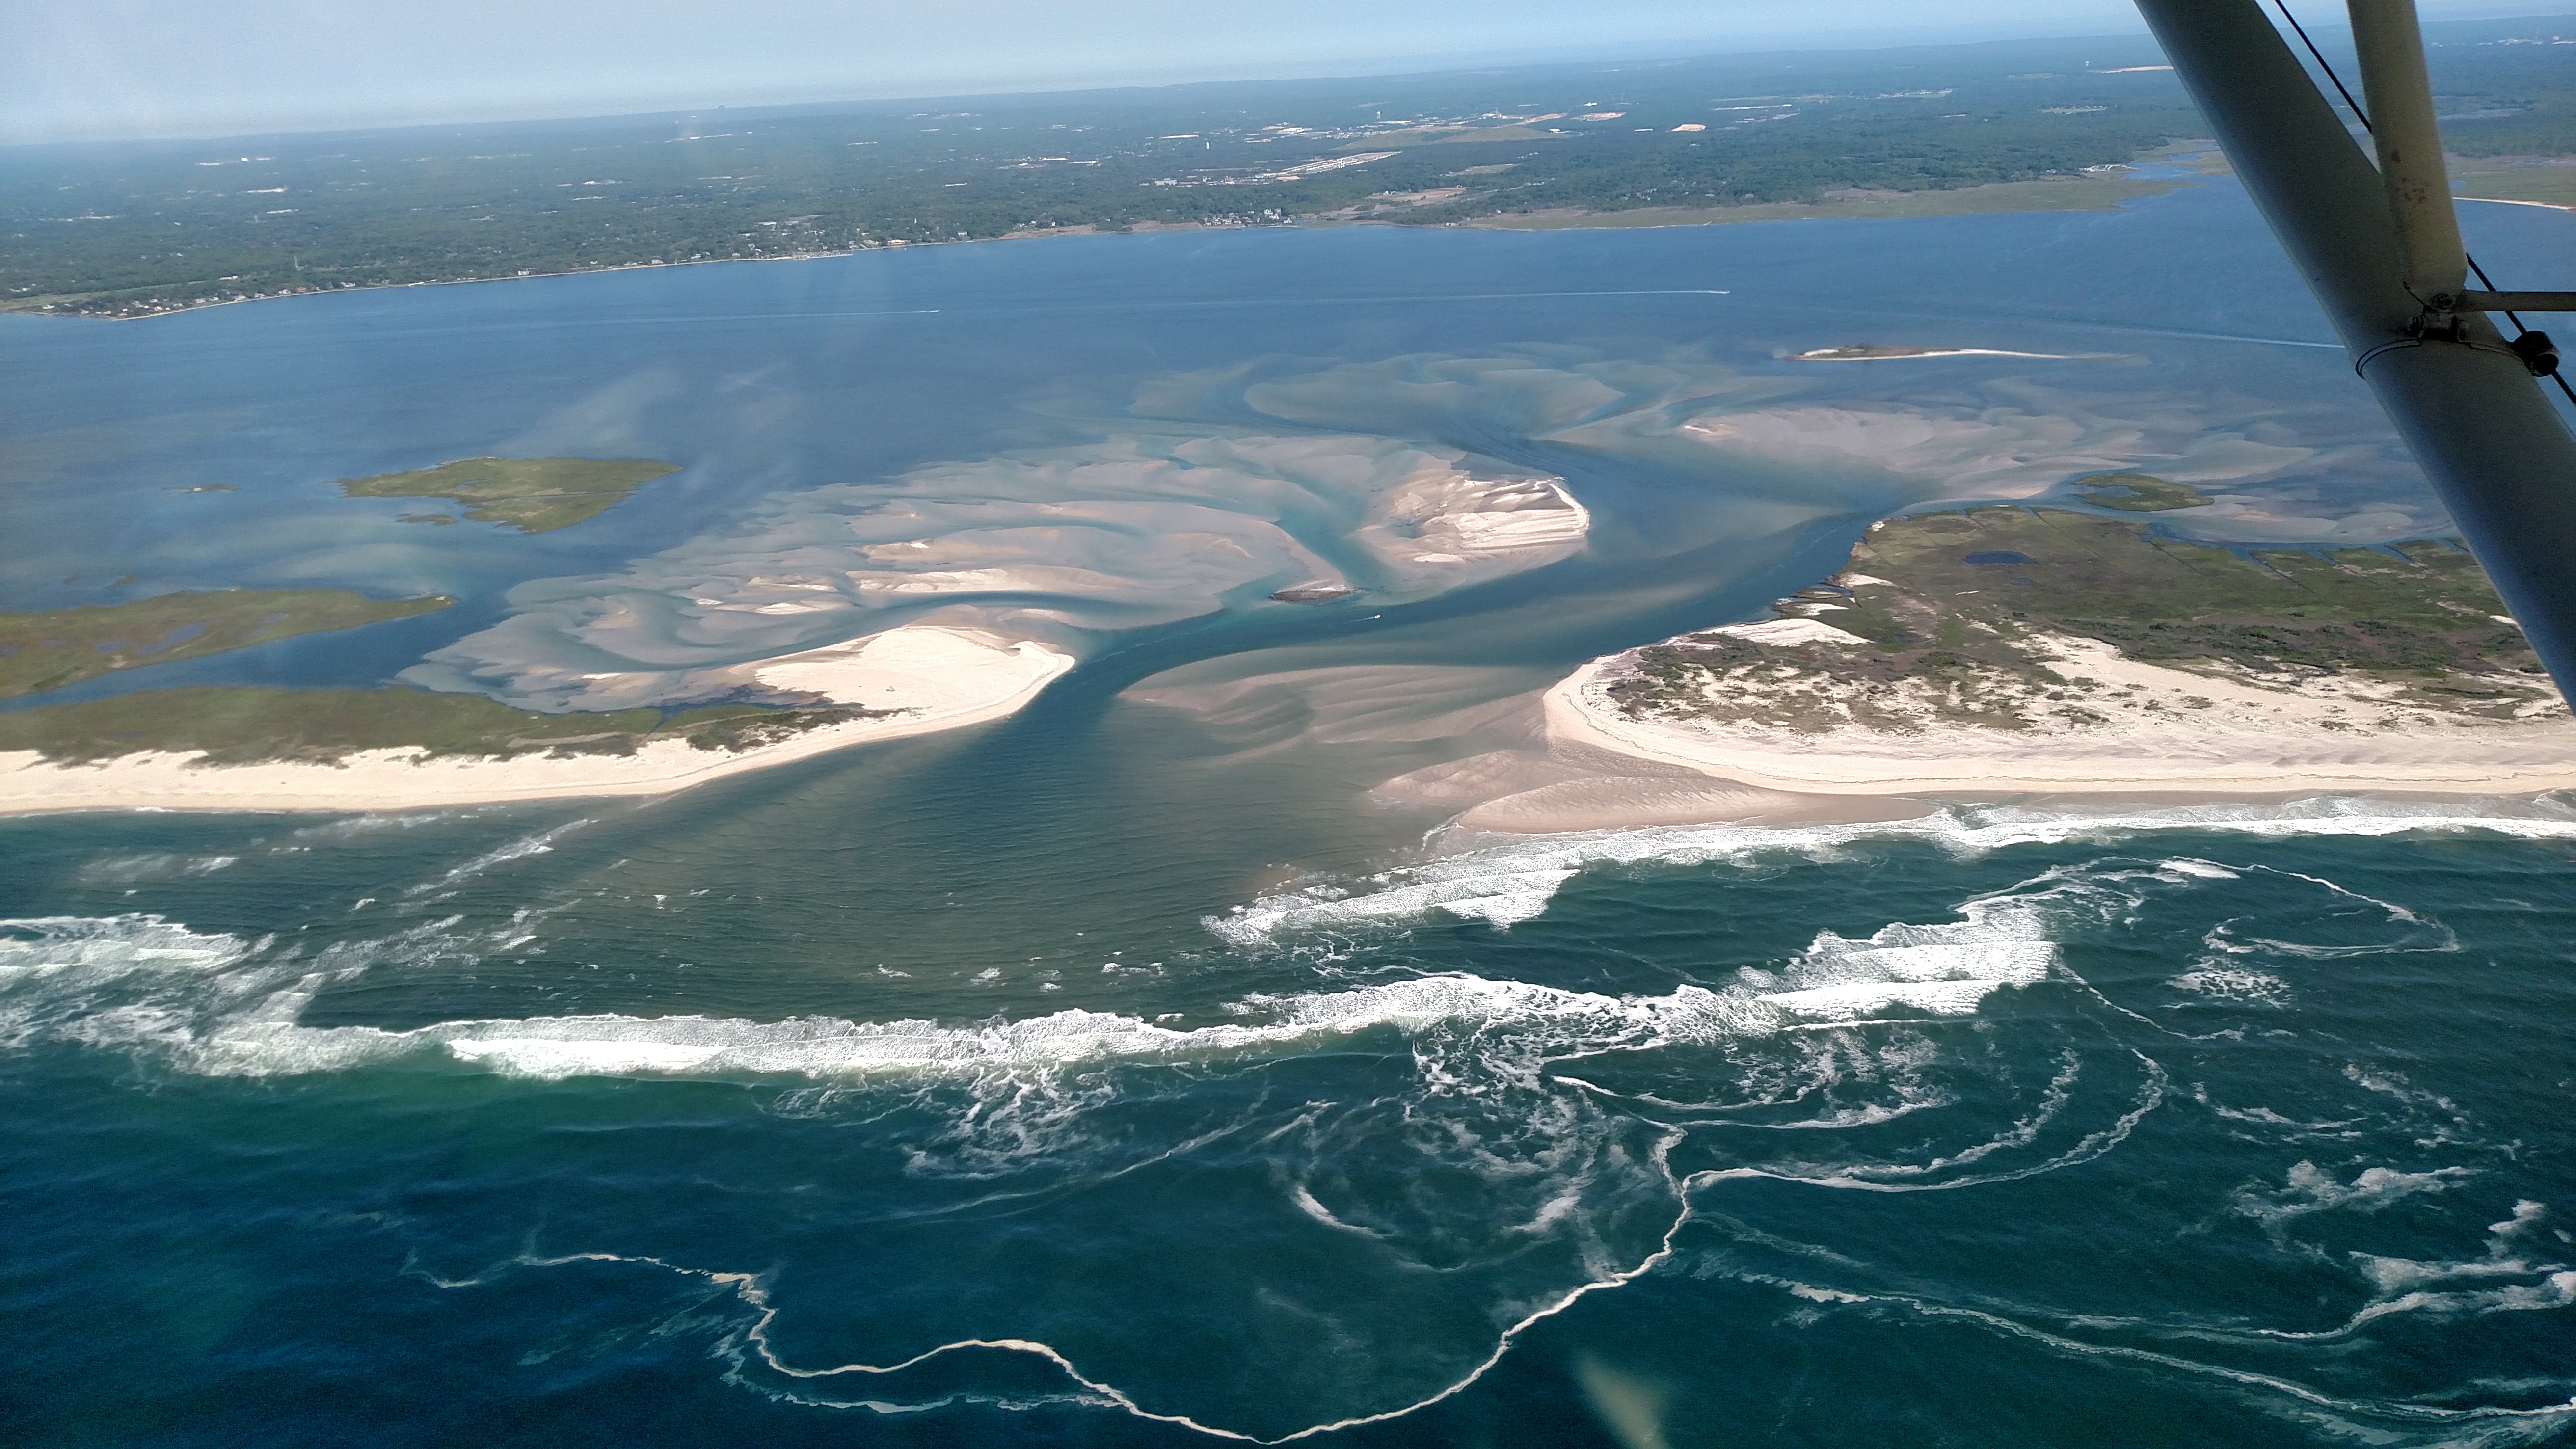 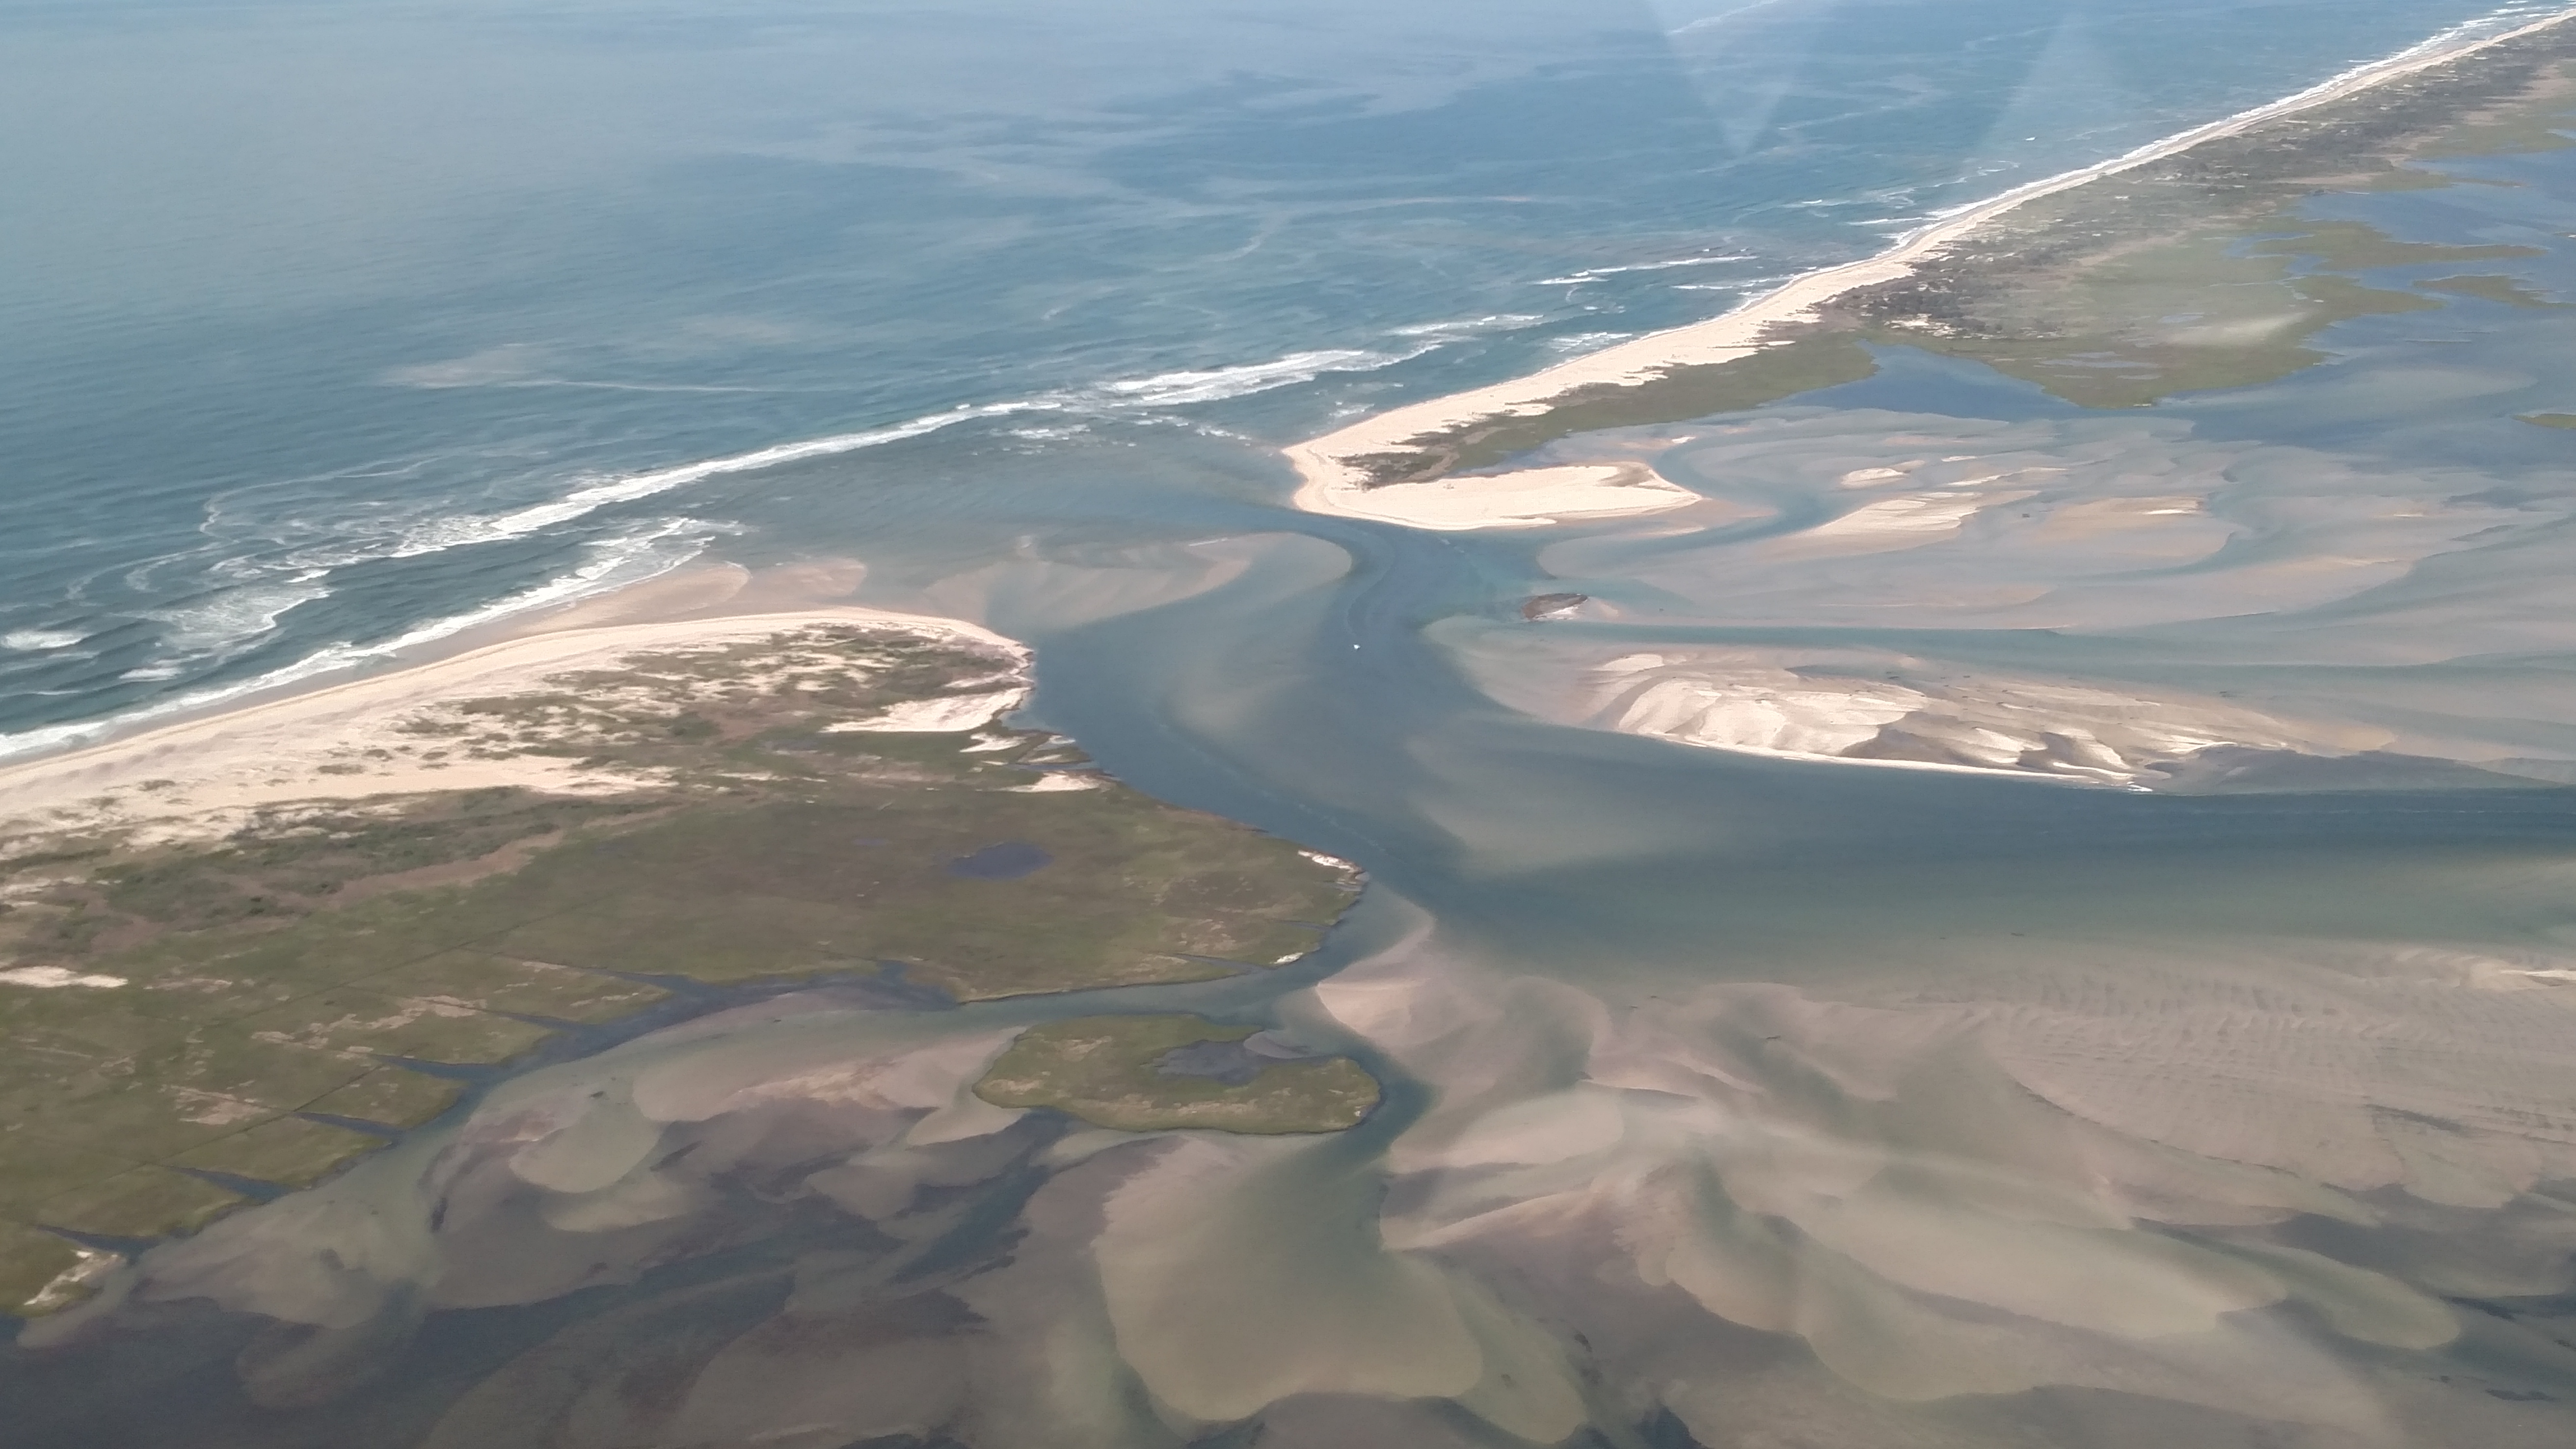 |
June 30, 2016 (CF)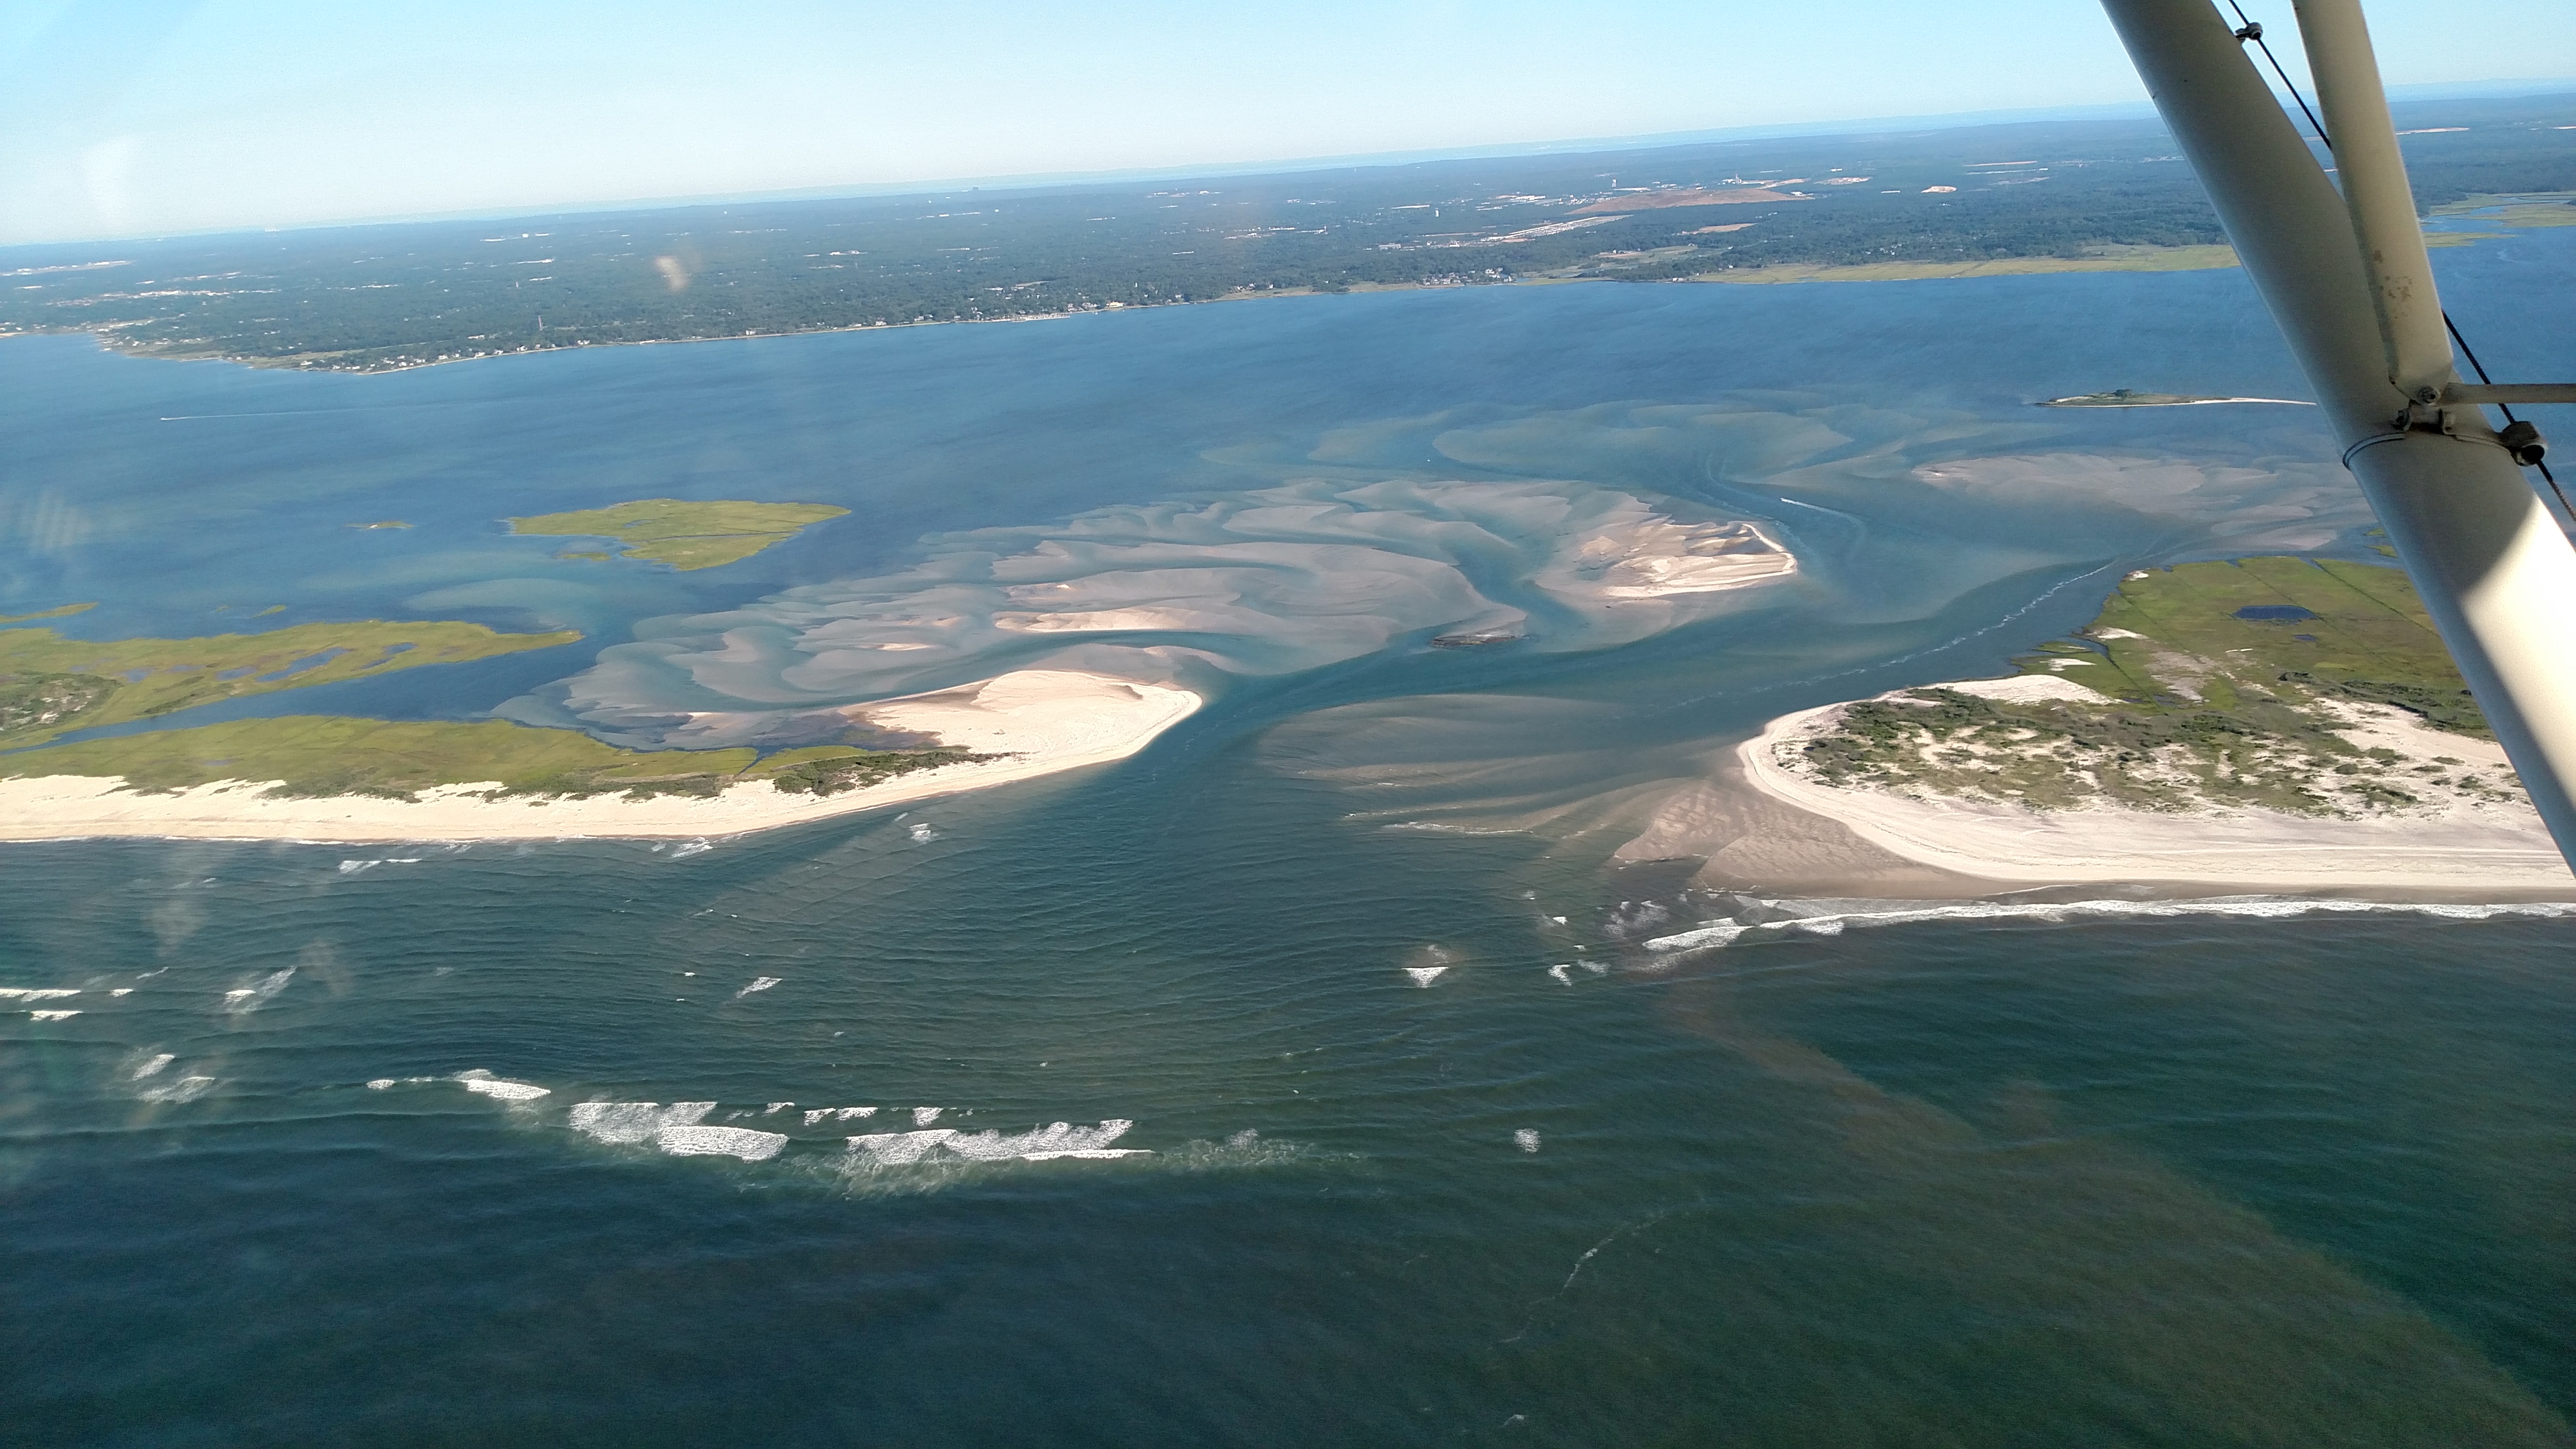  |
July 20, 2016 (CF)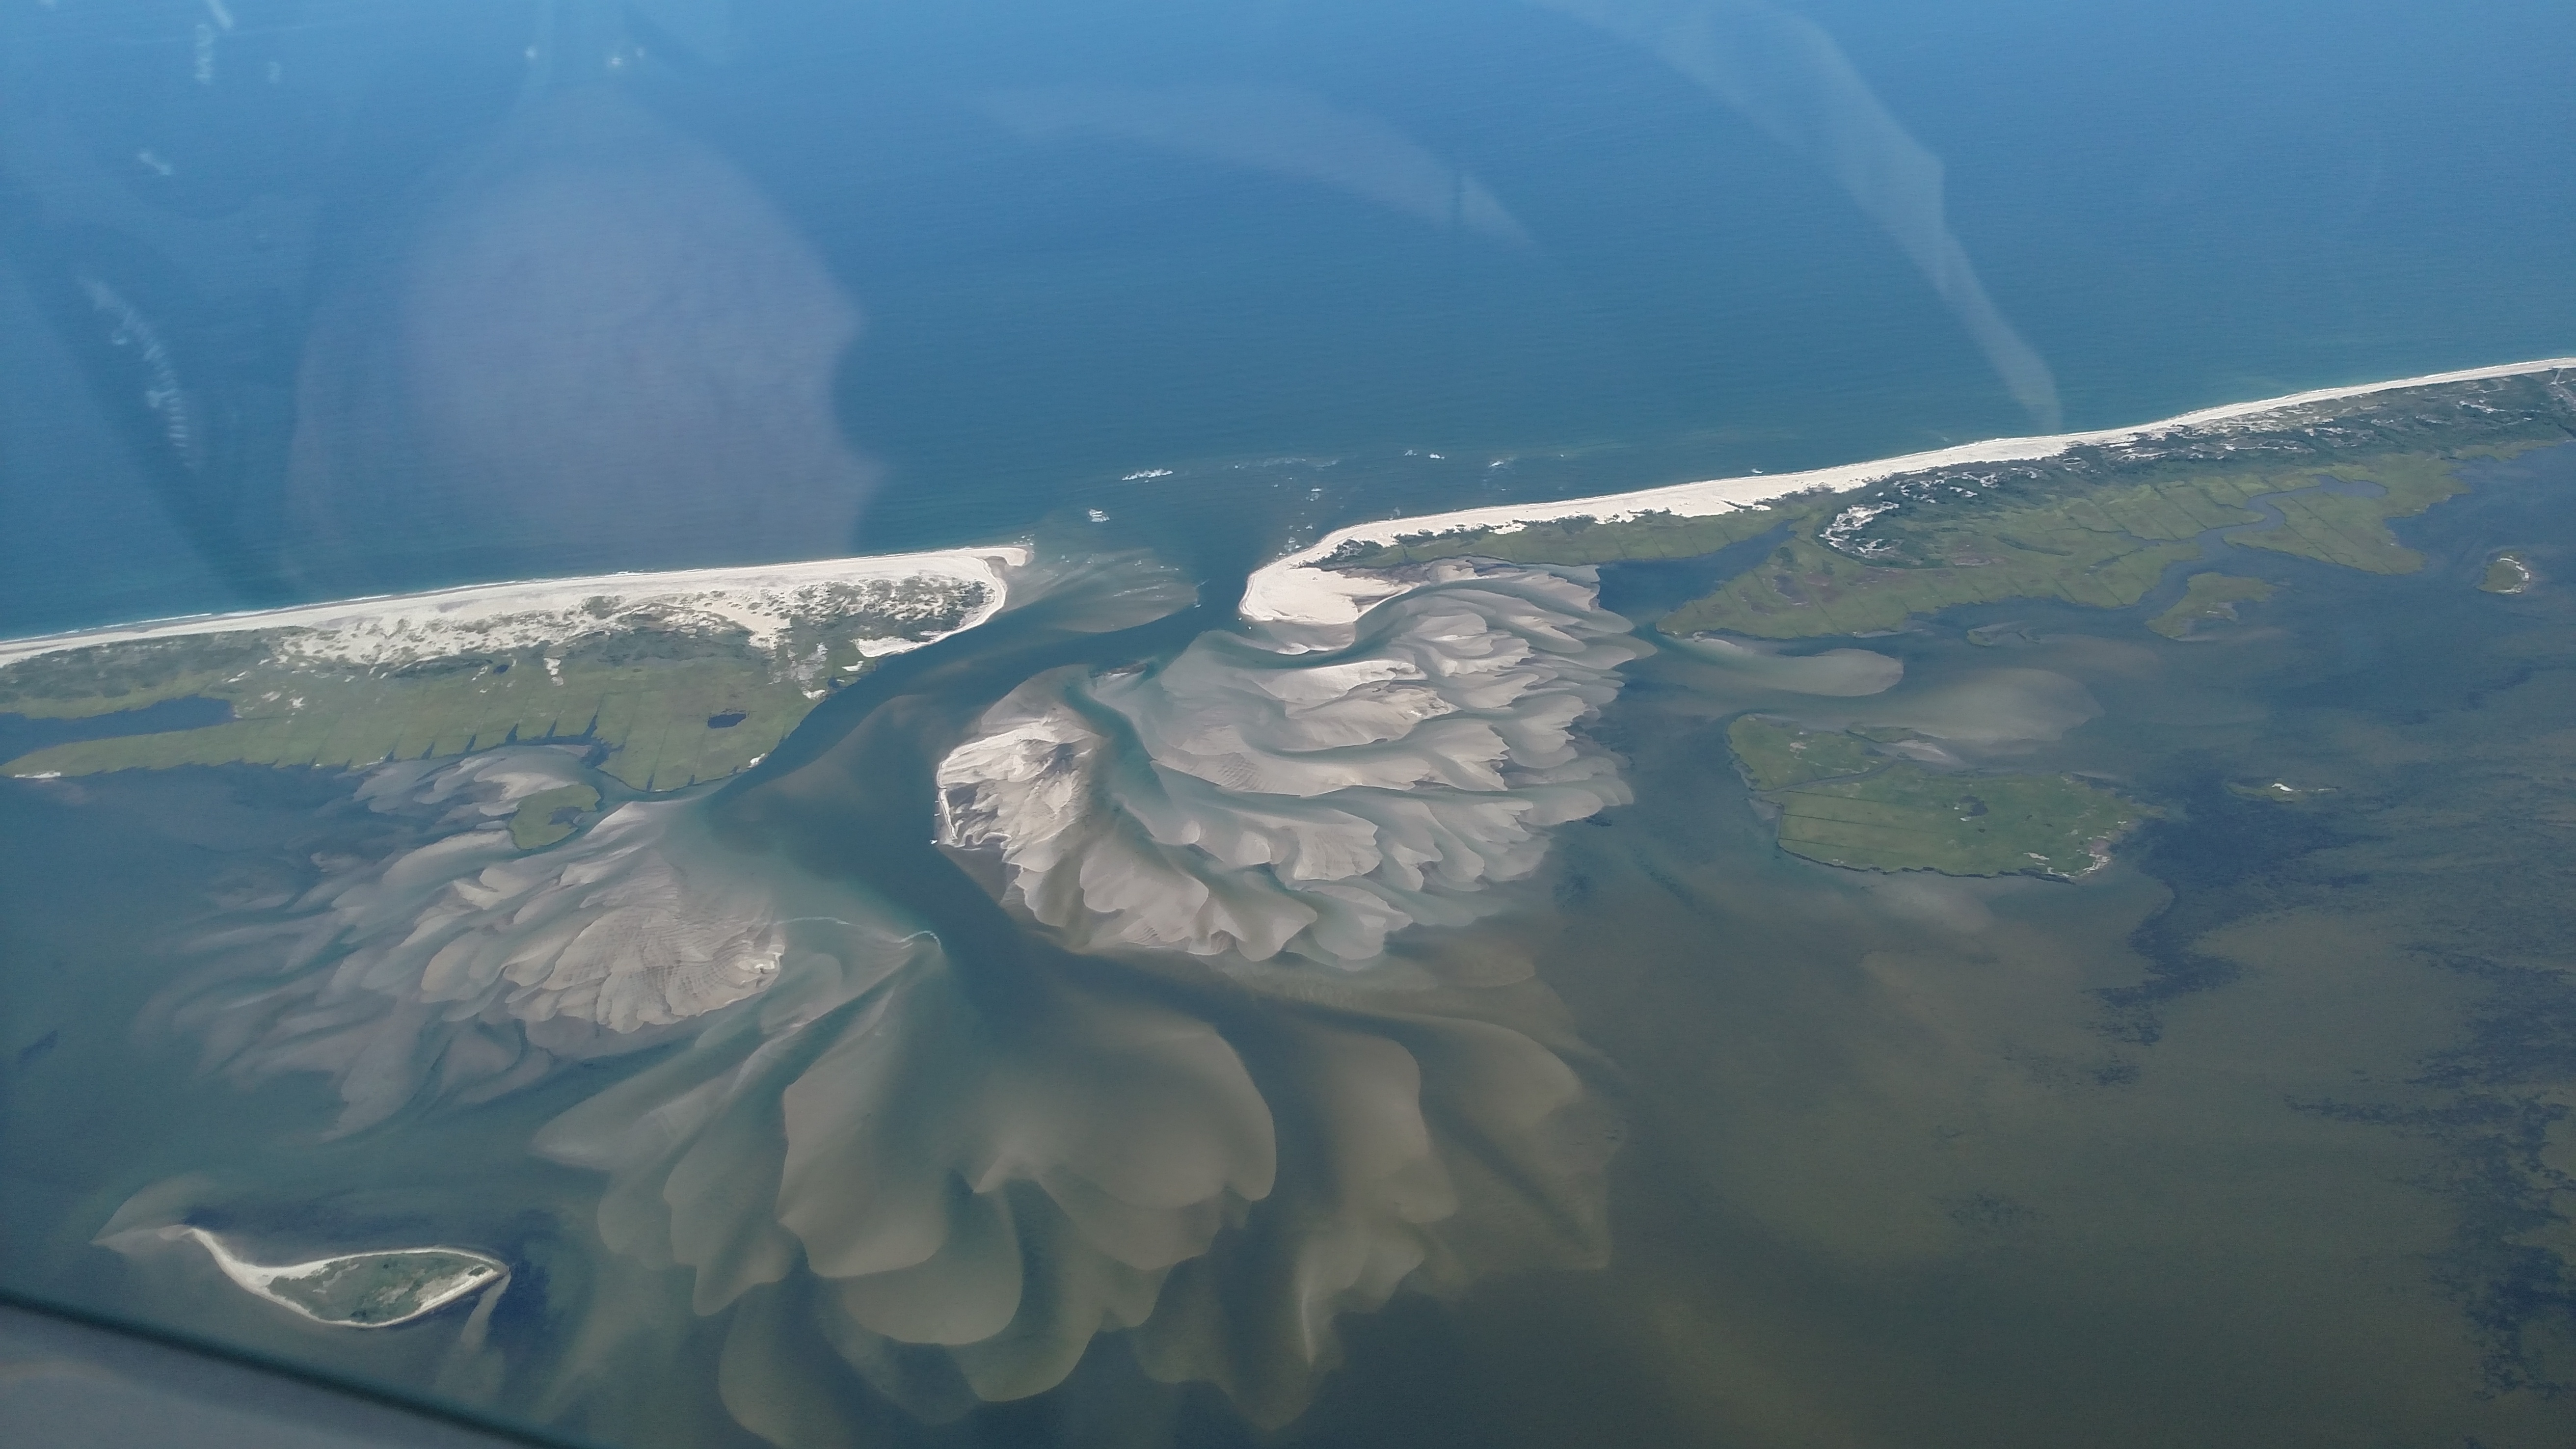 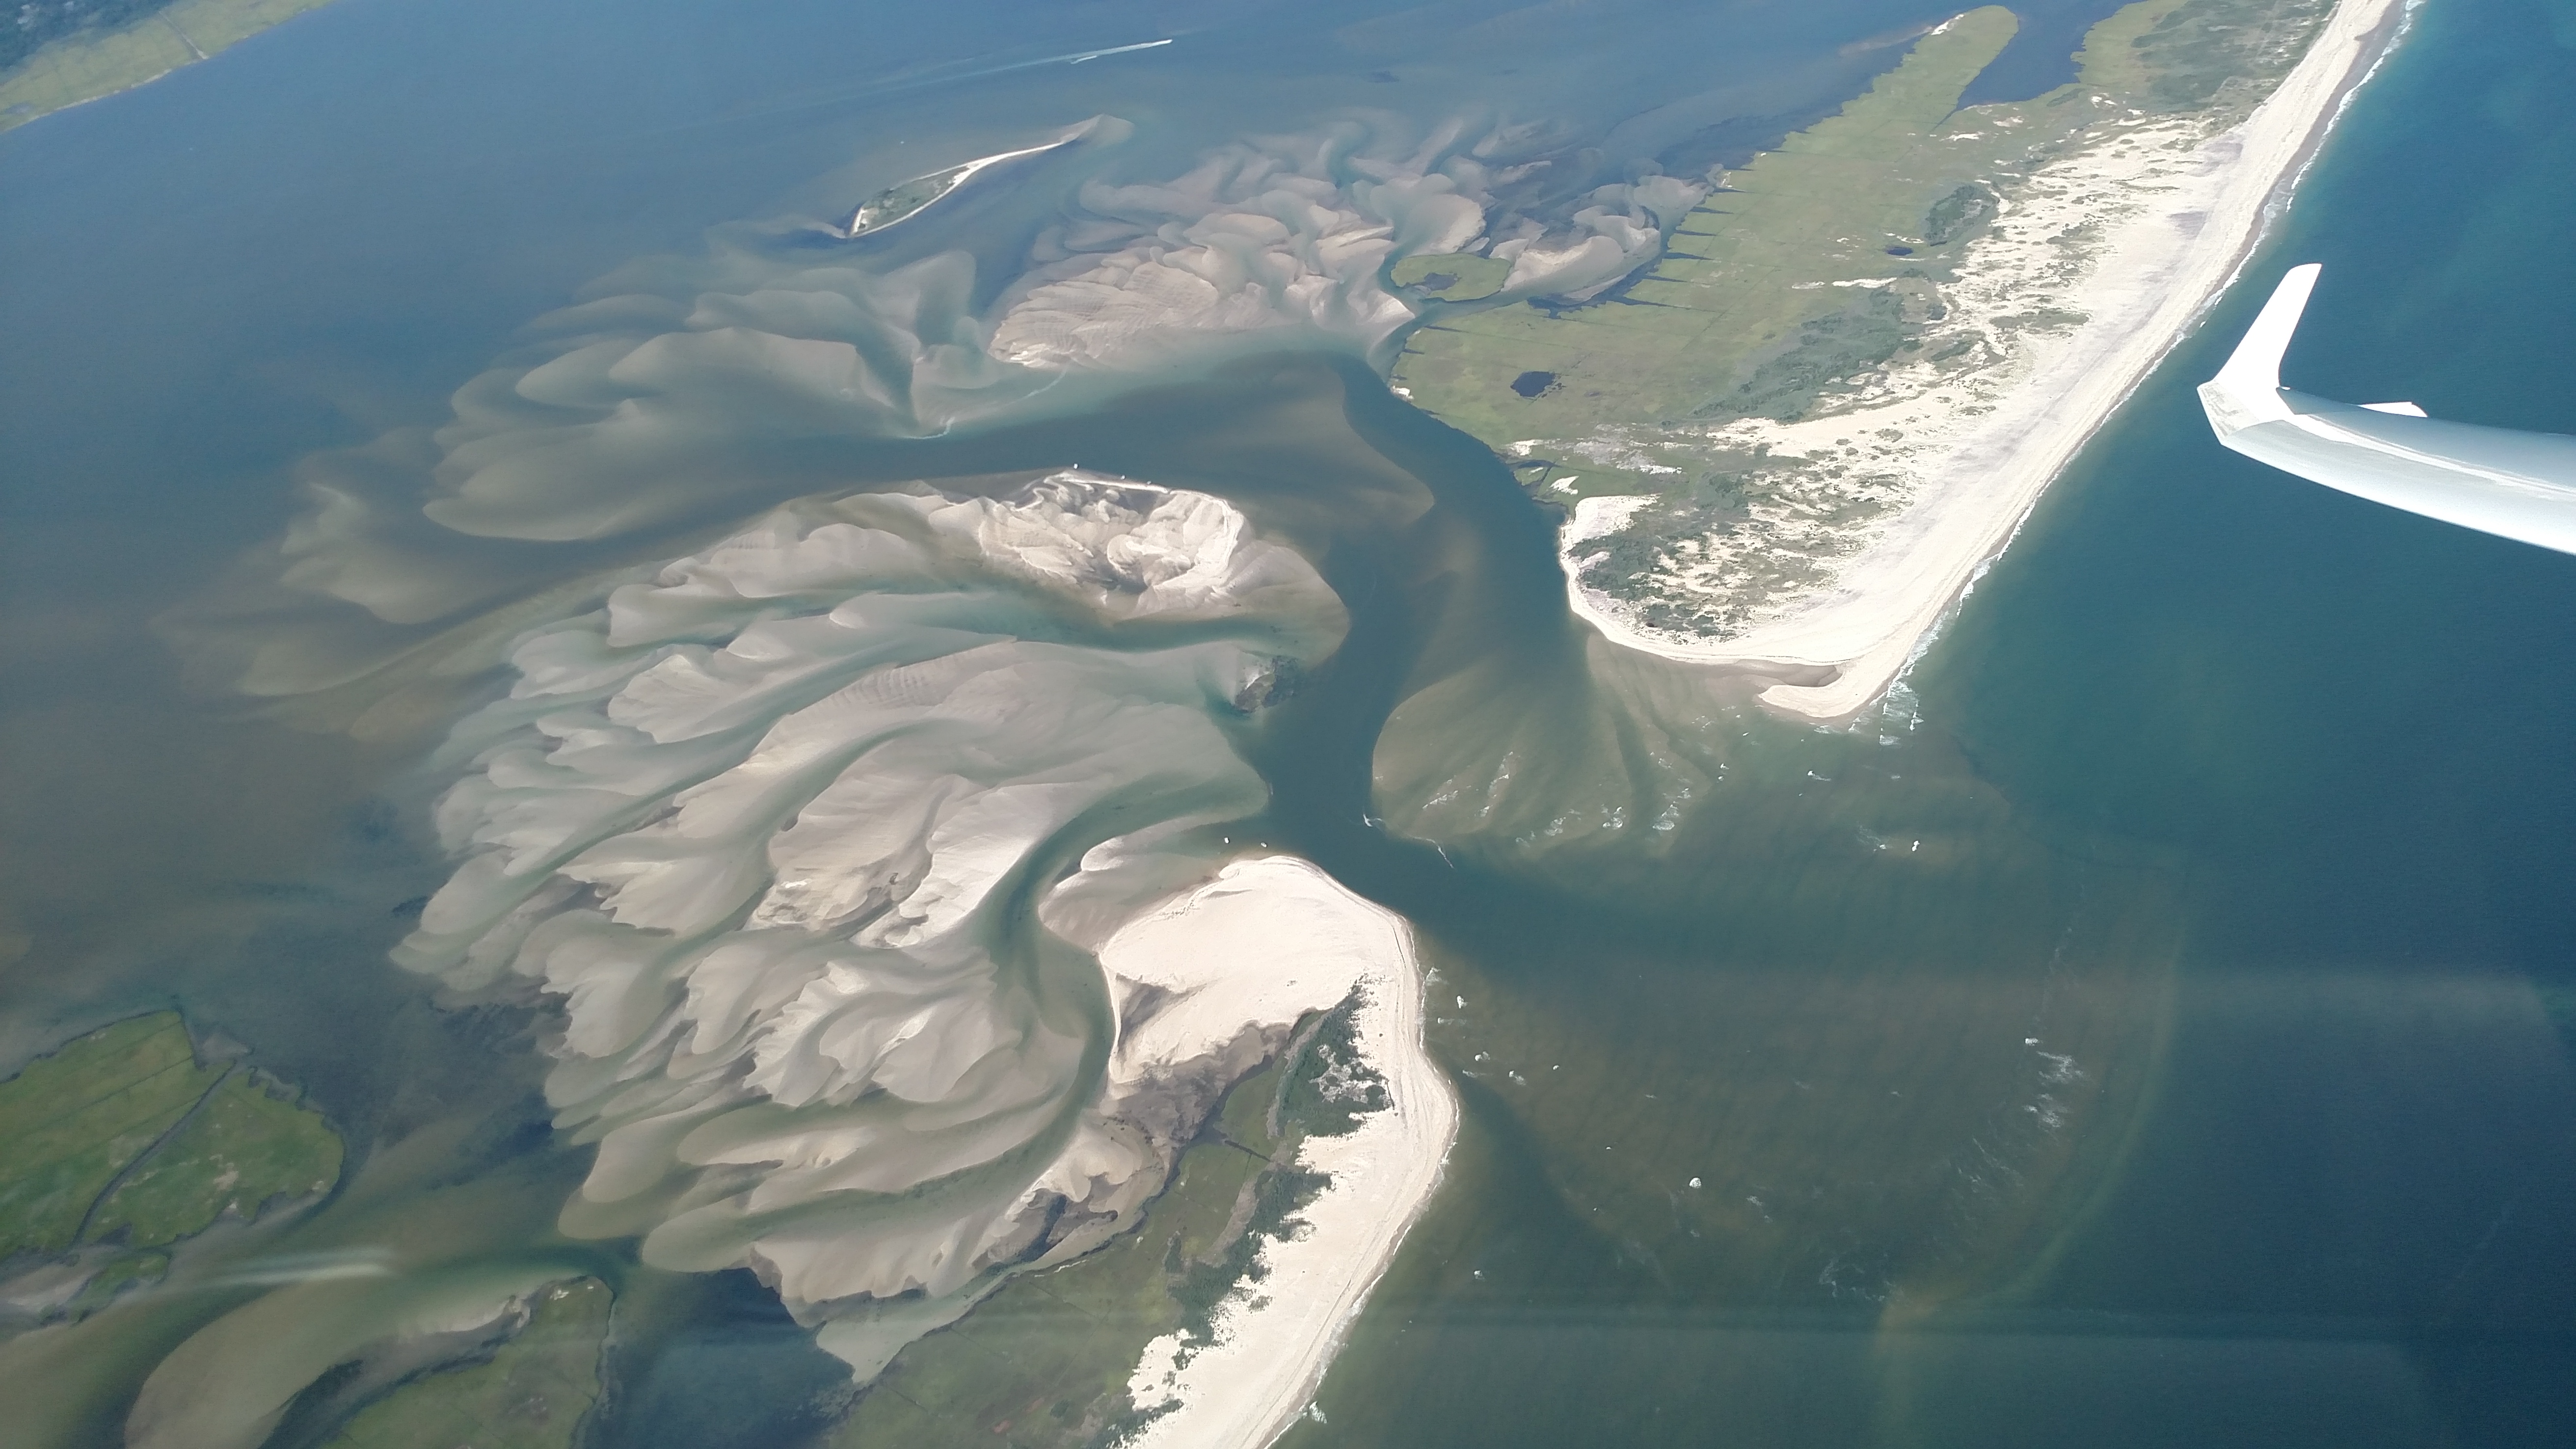 |
||||
Aug 5, 2016 (RG&CF)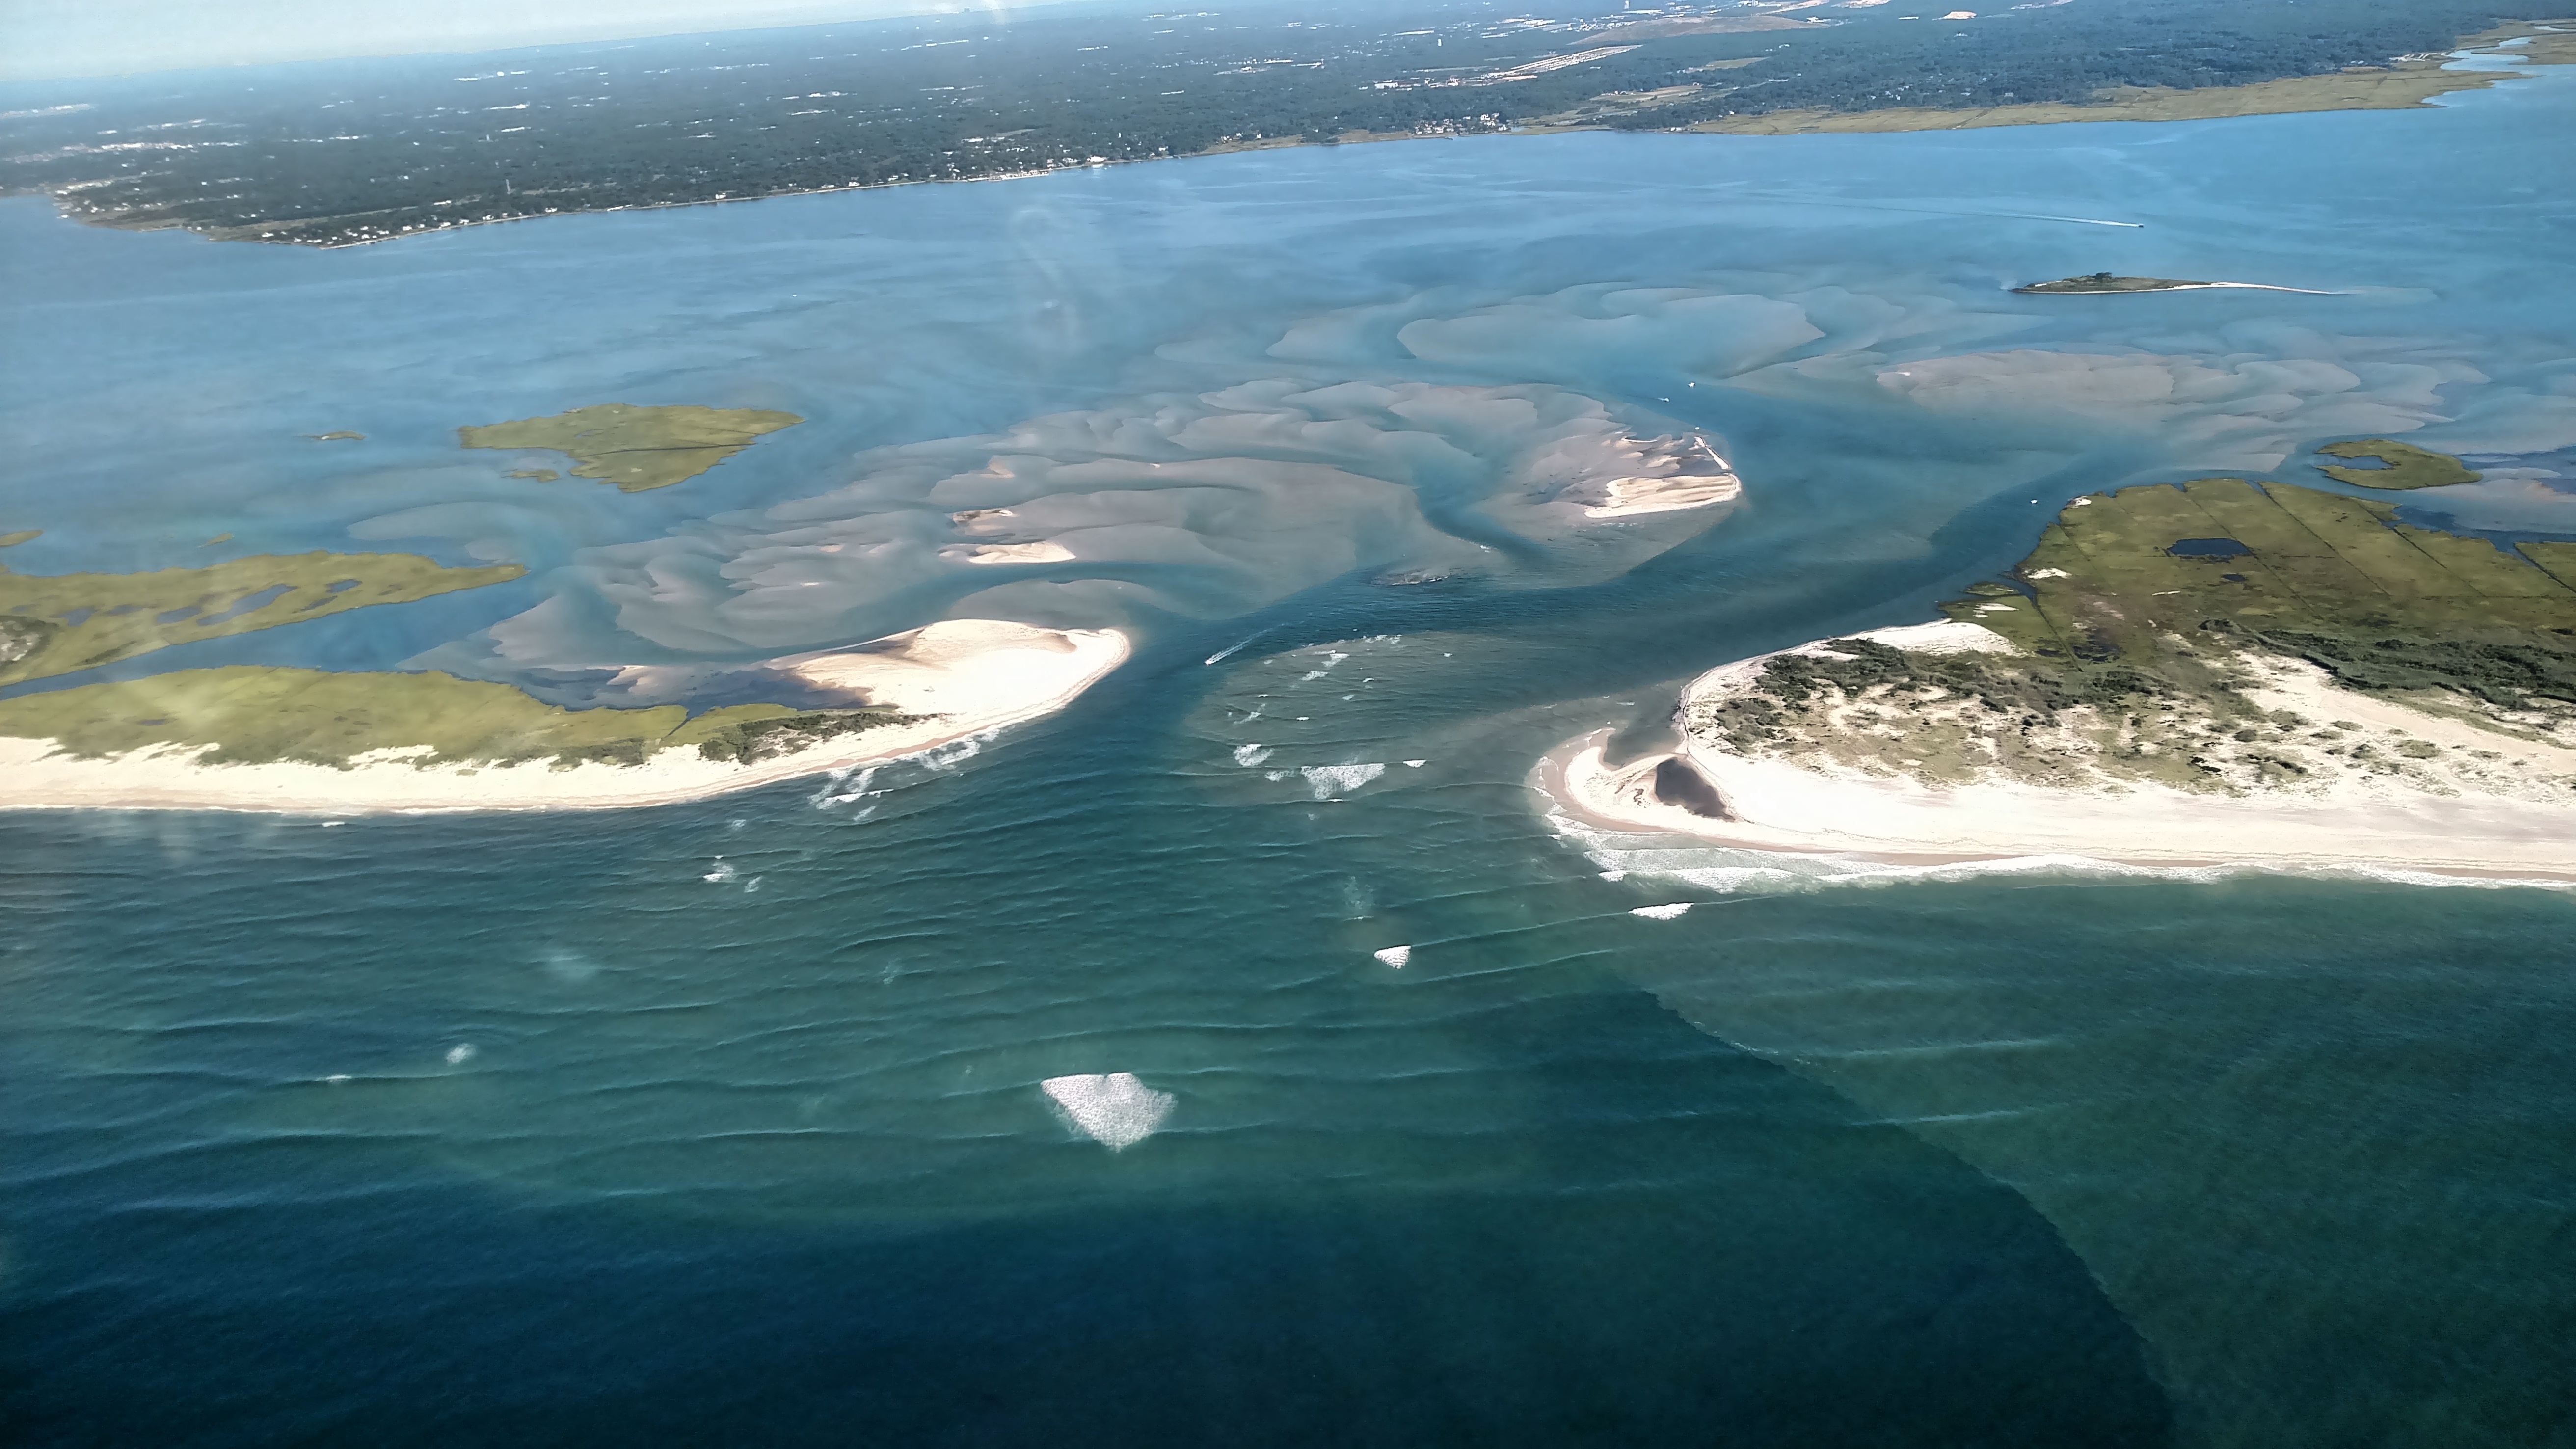 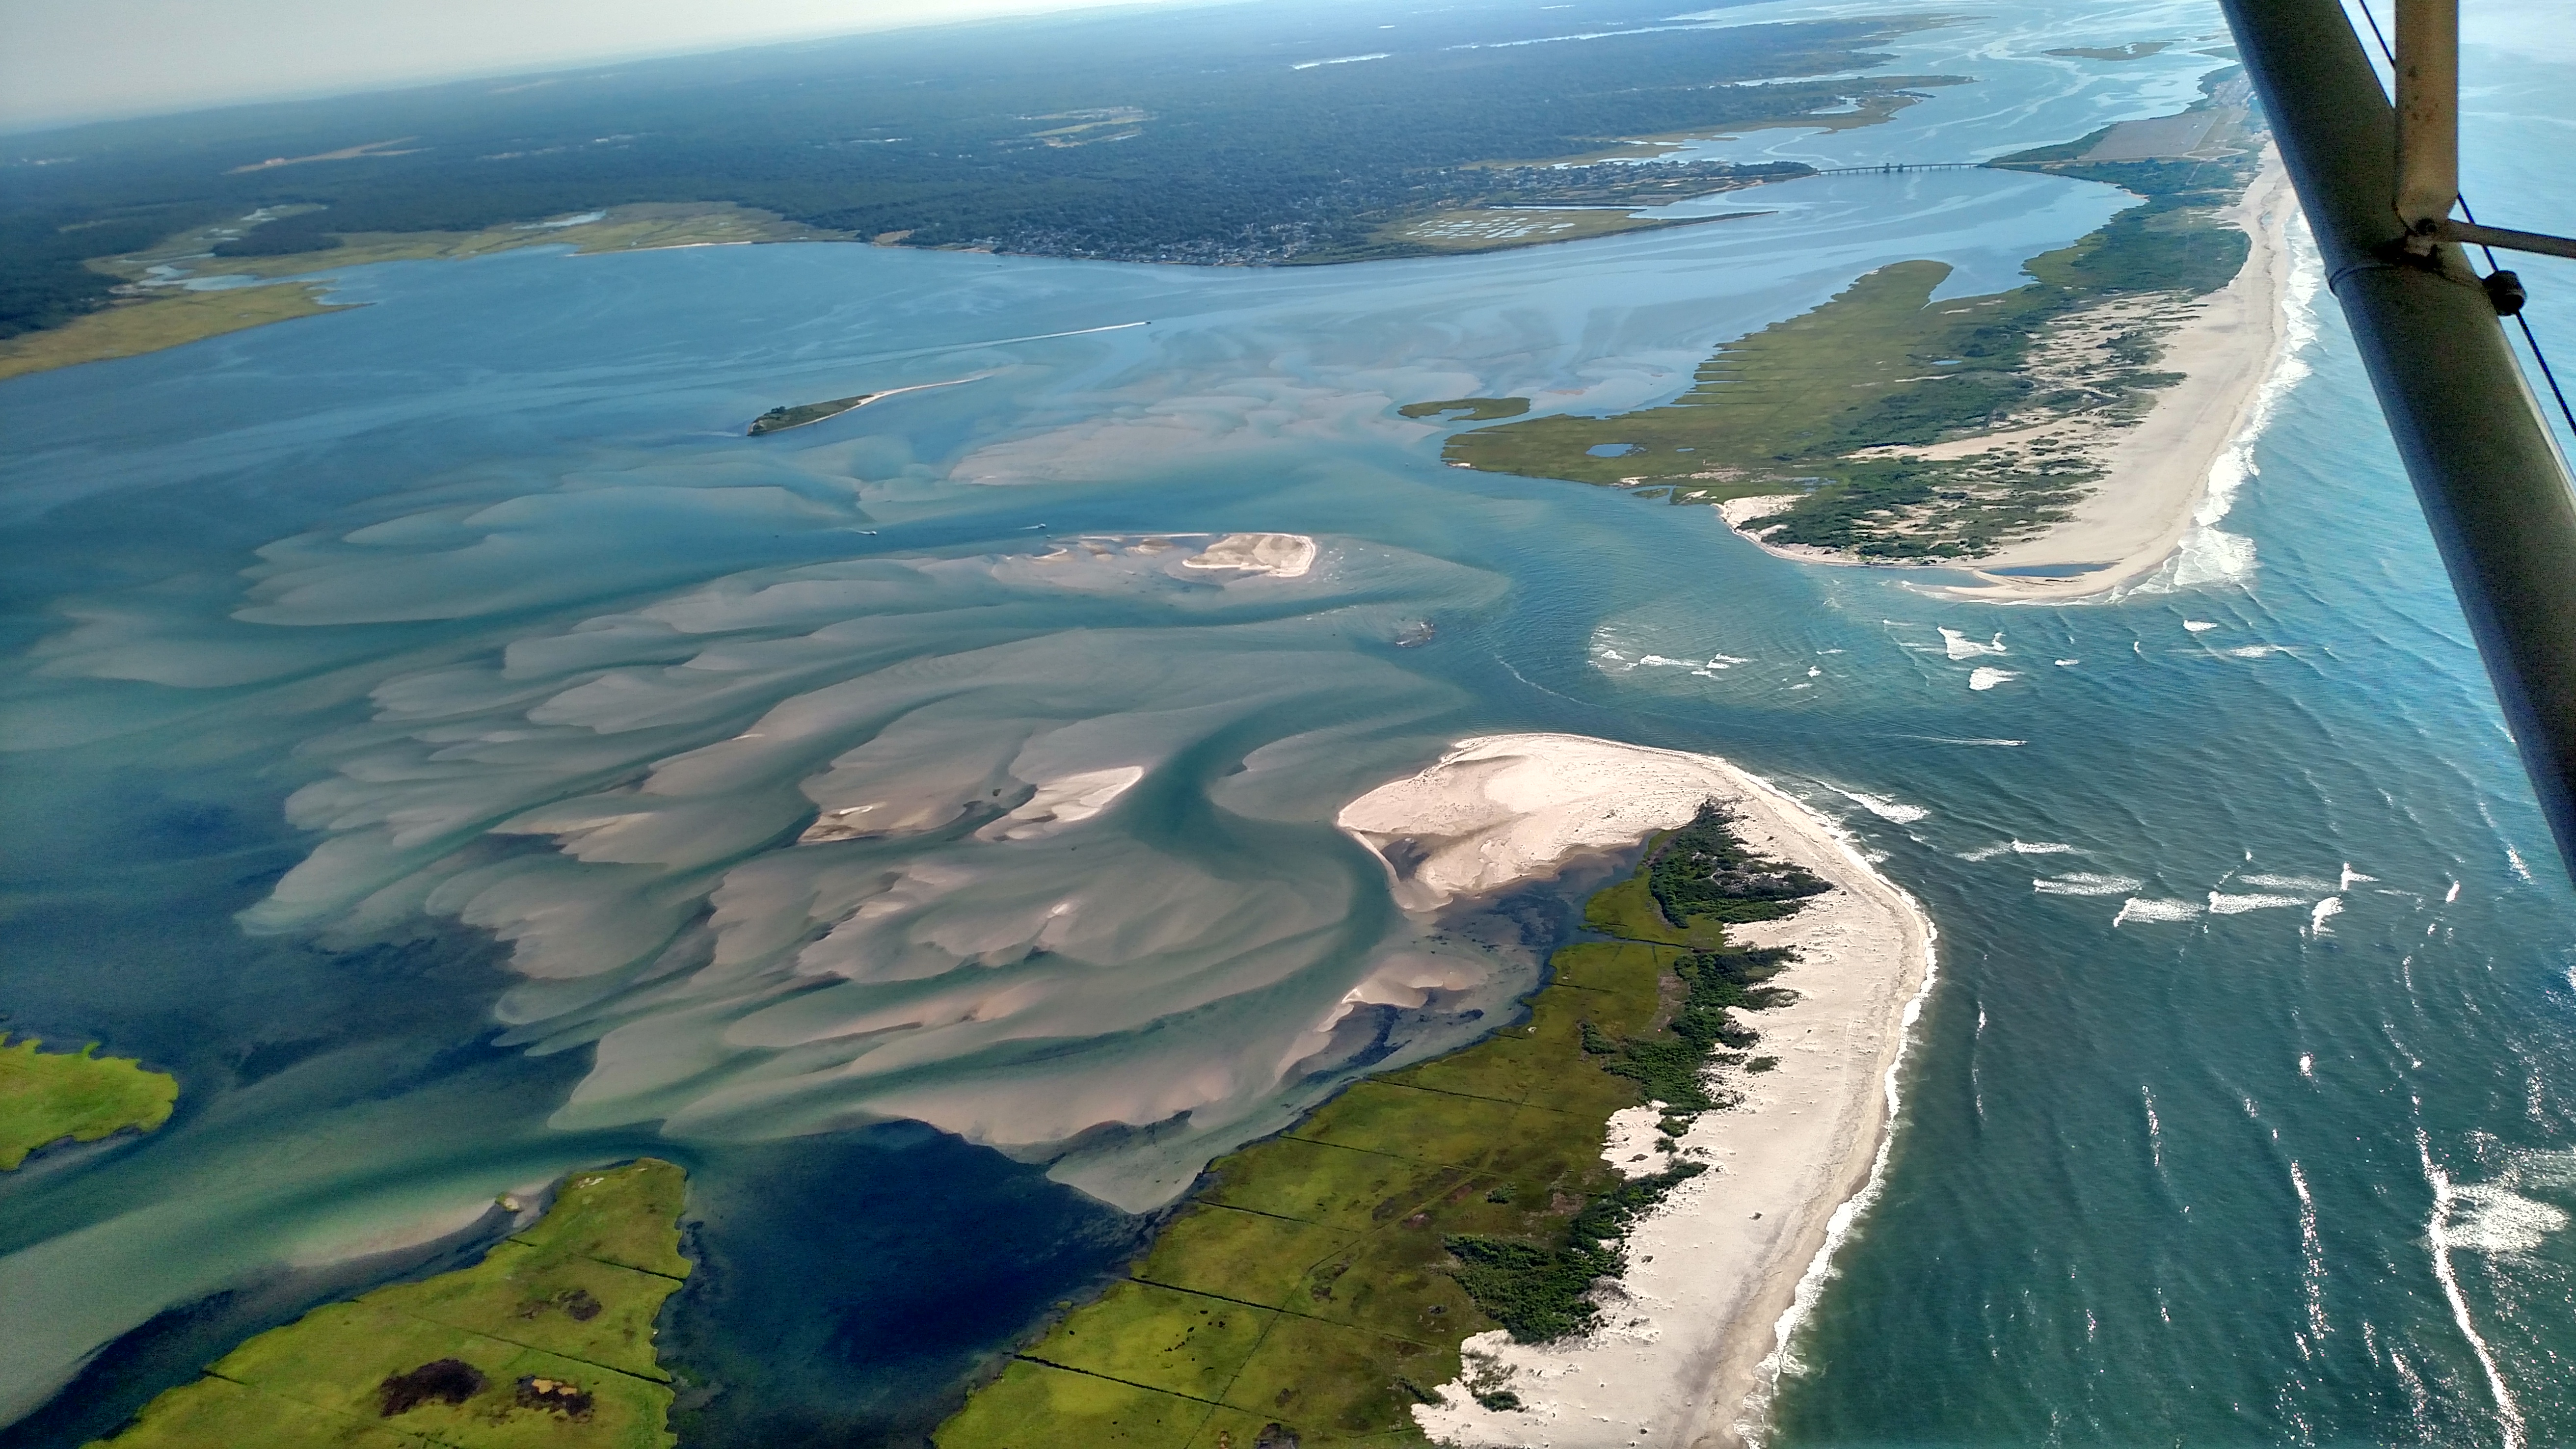 |
Sept 8, 2016 (RG&CF)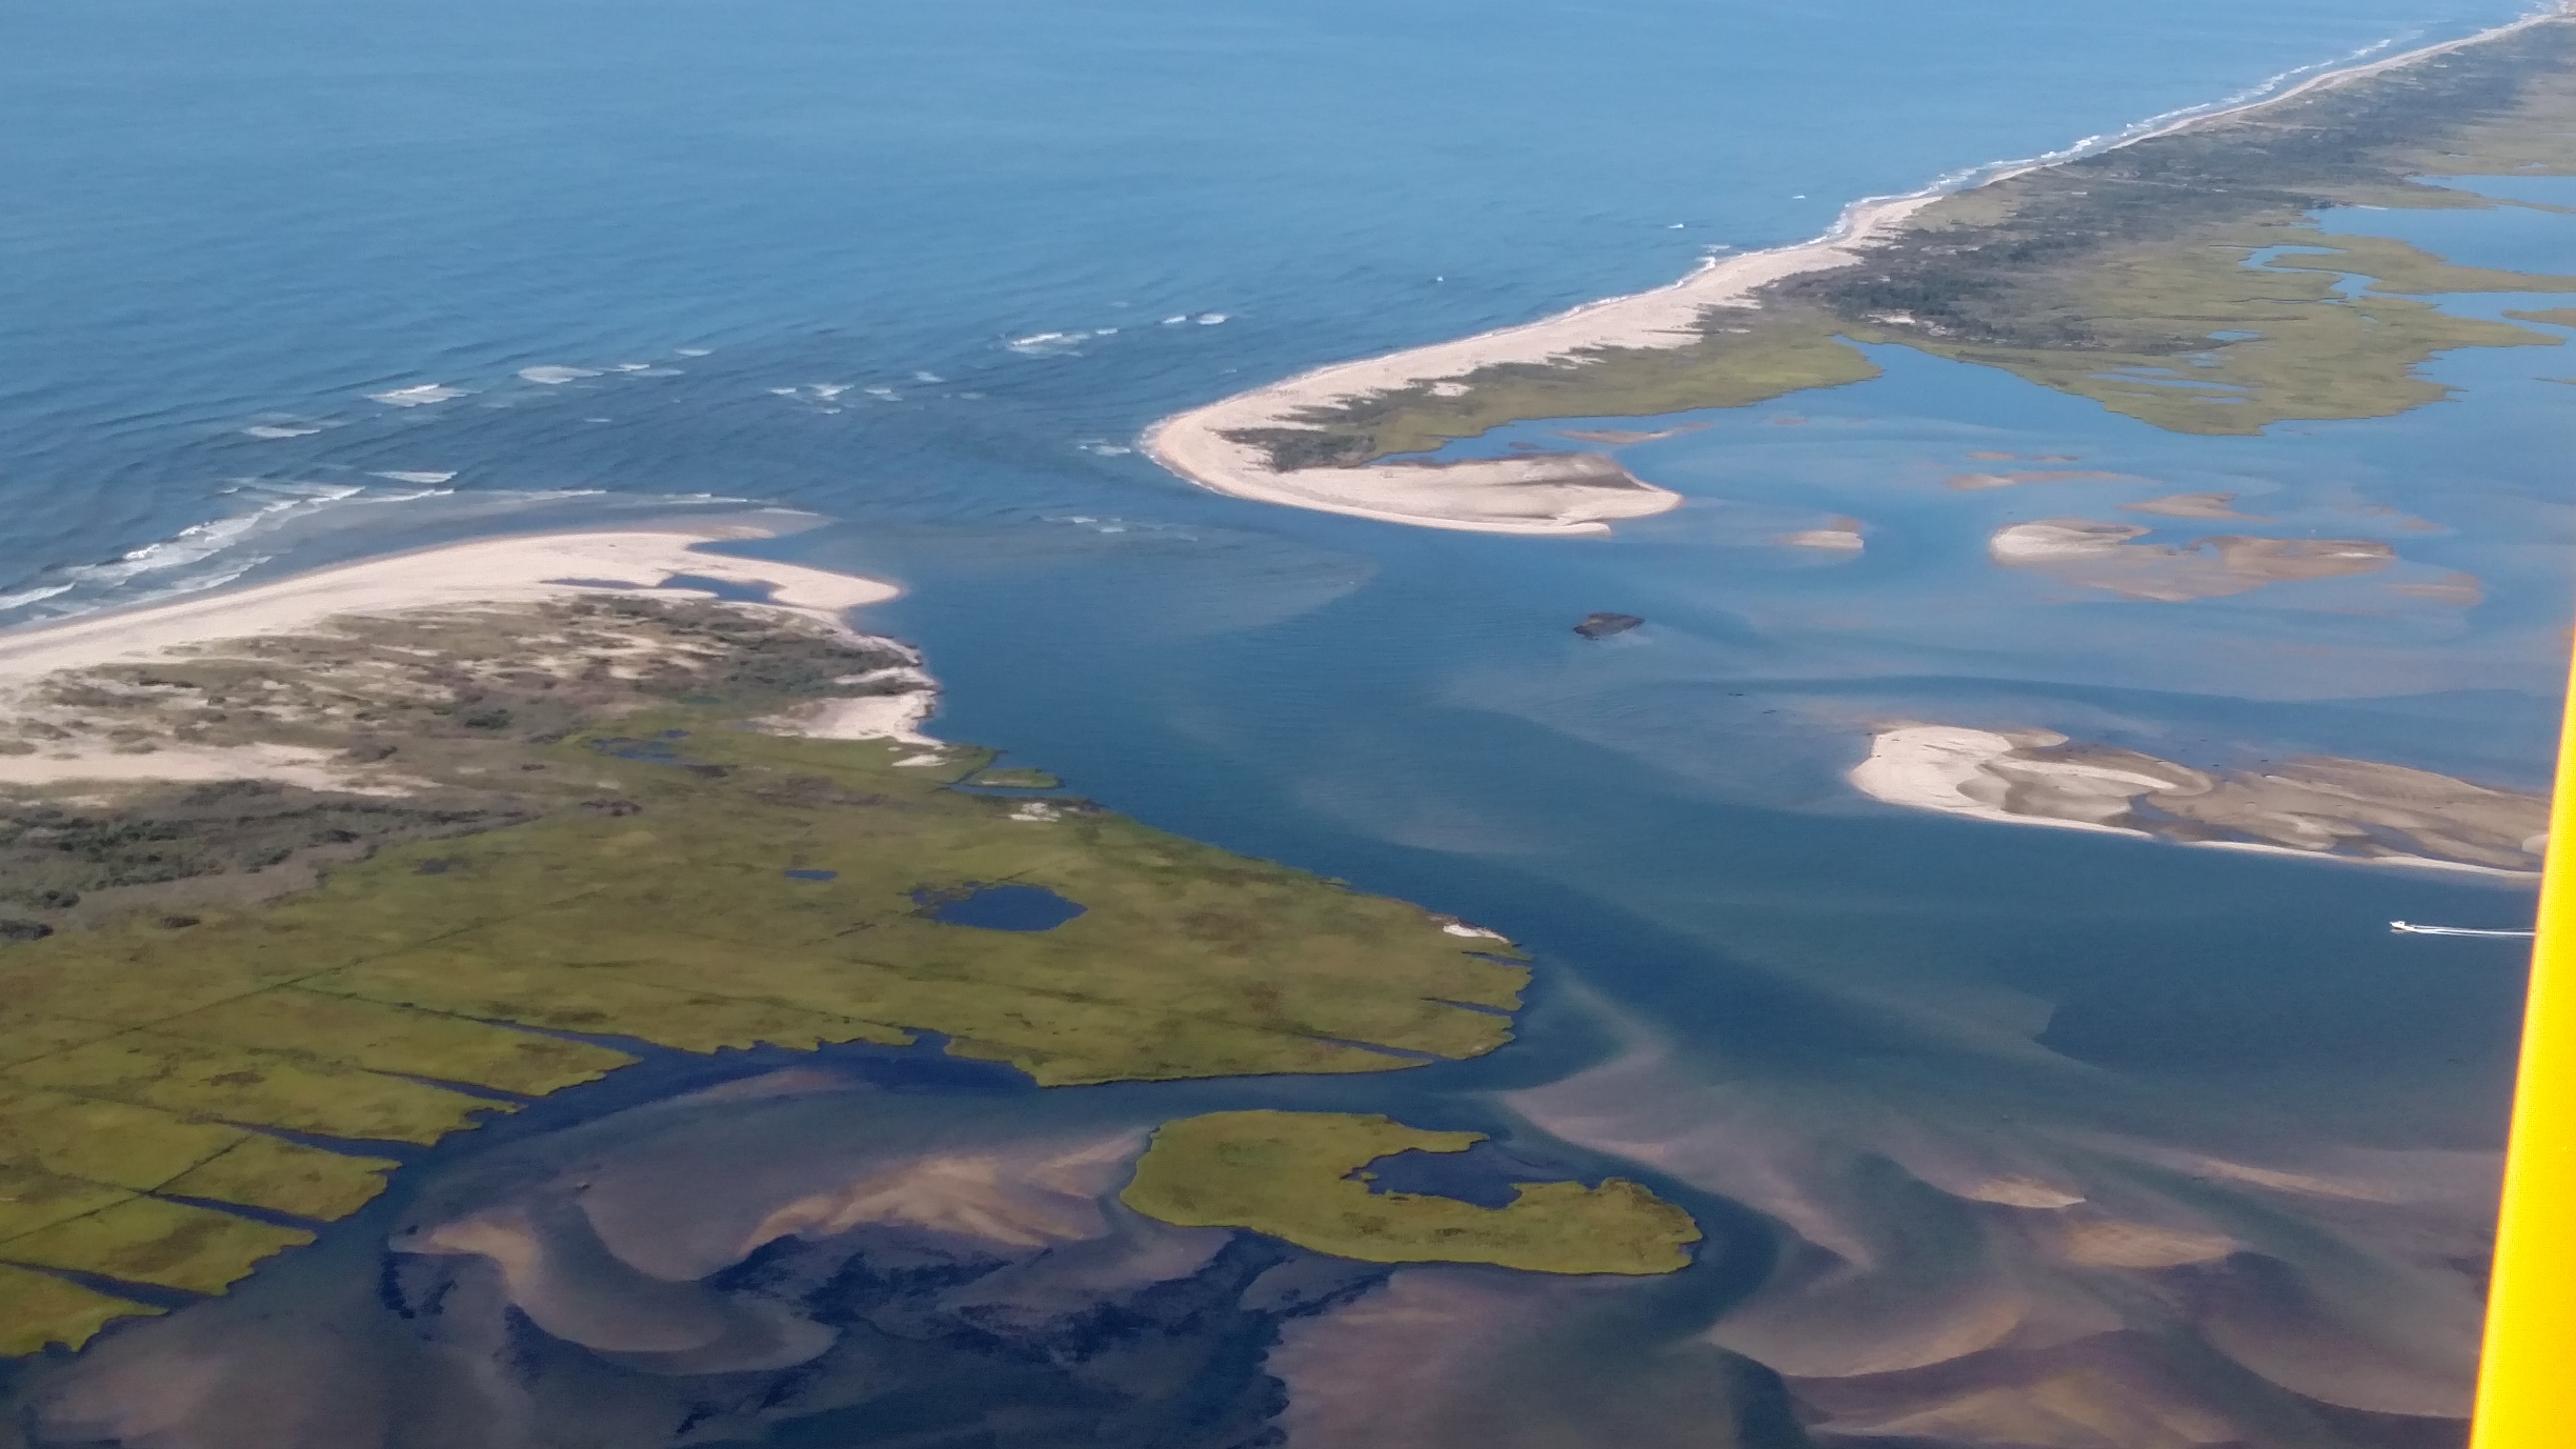 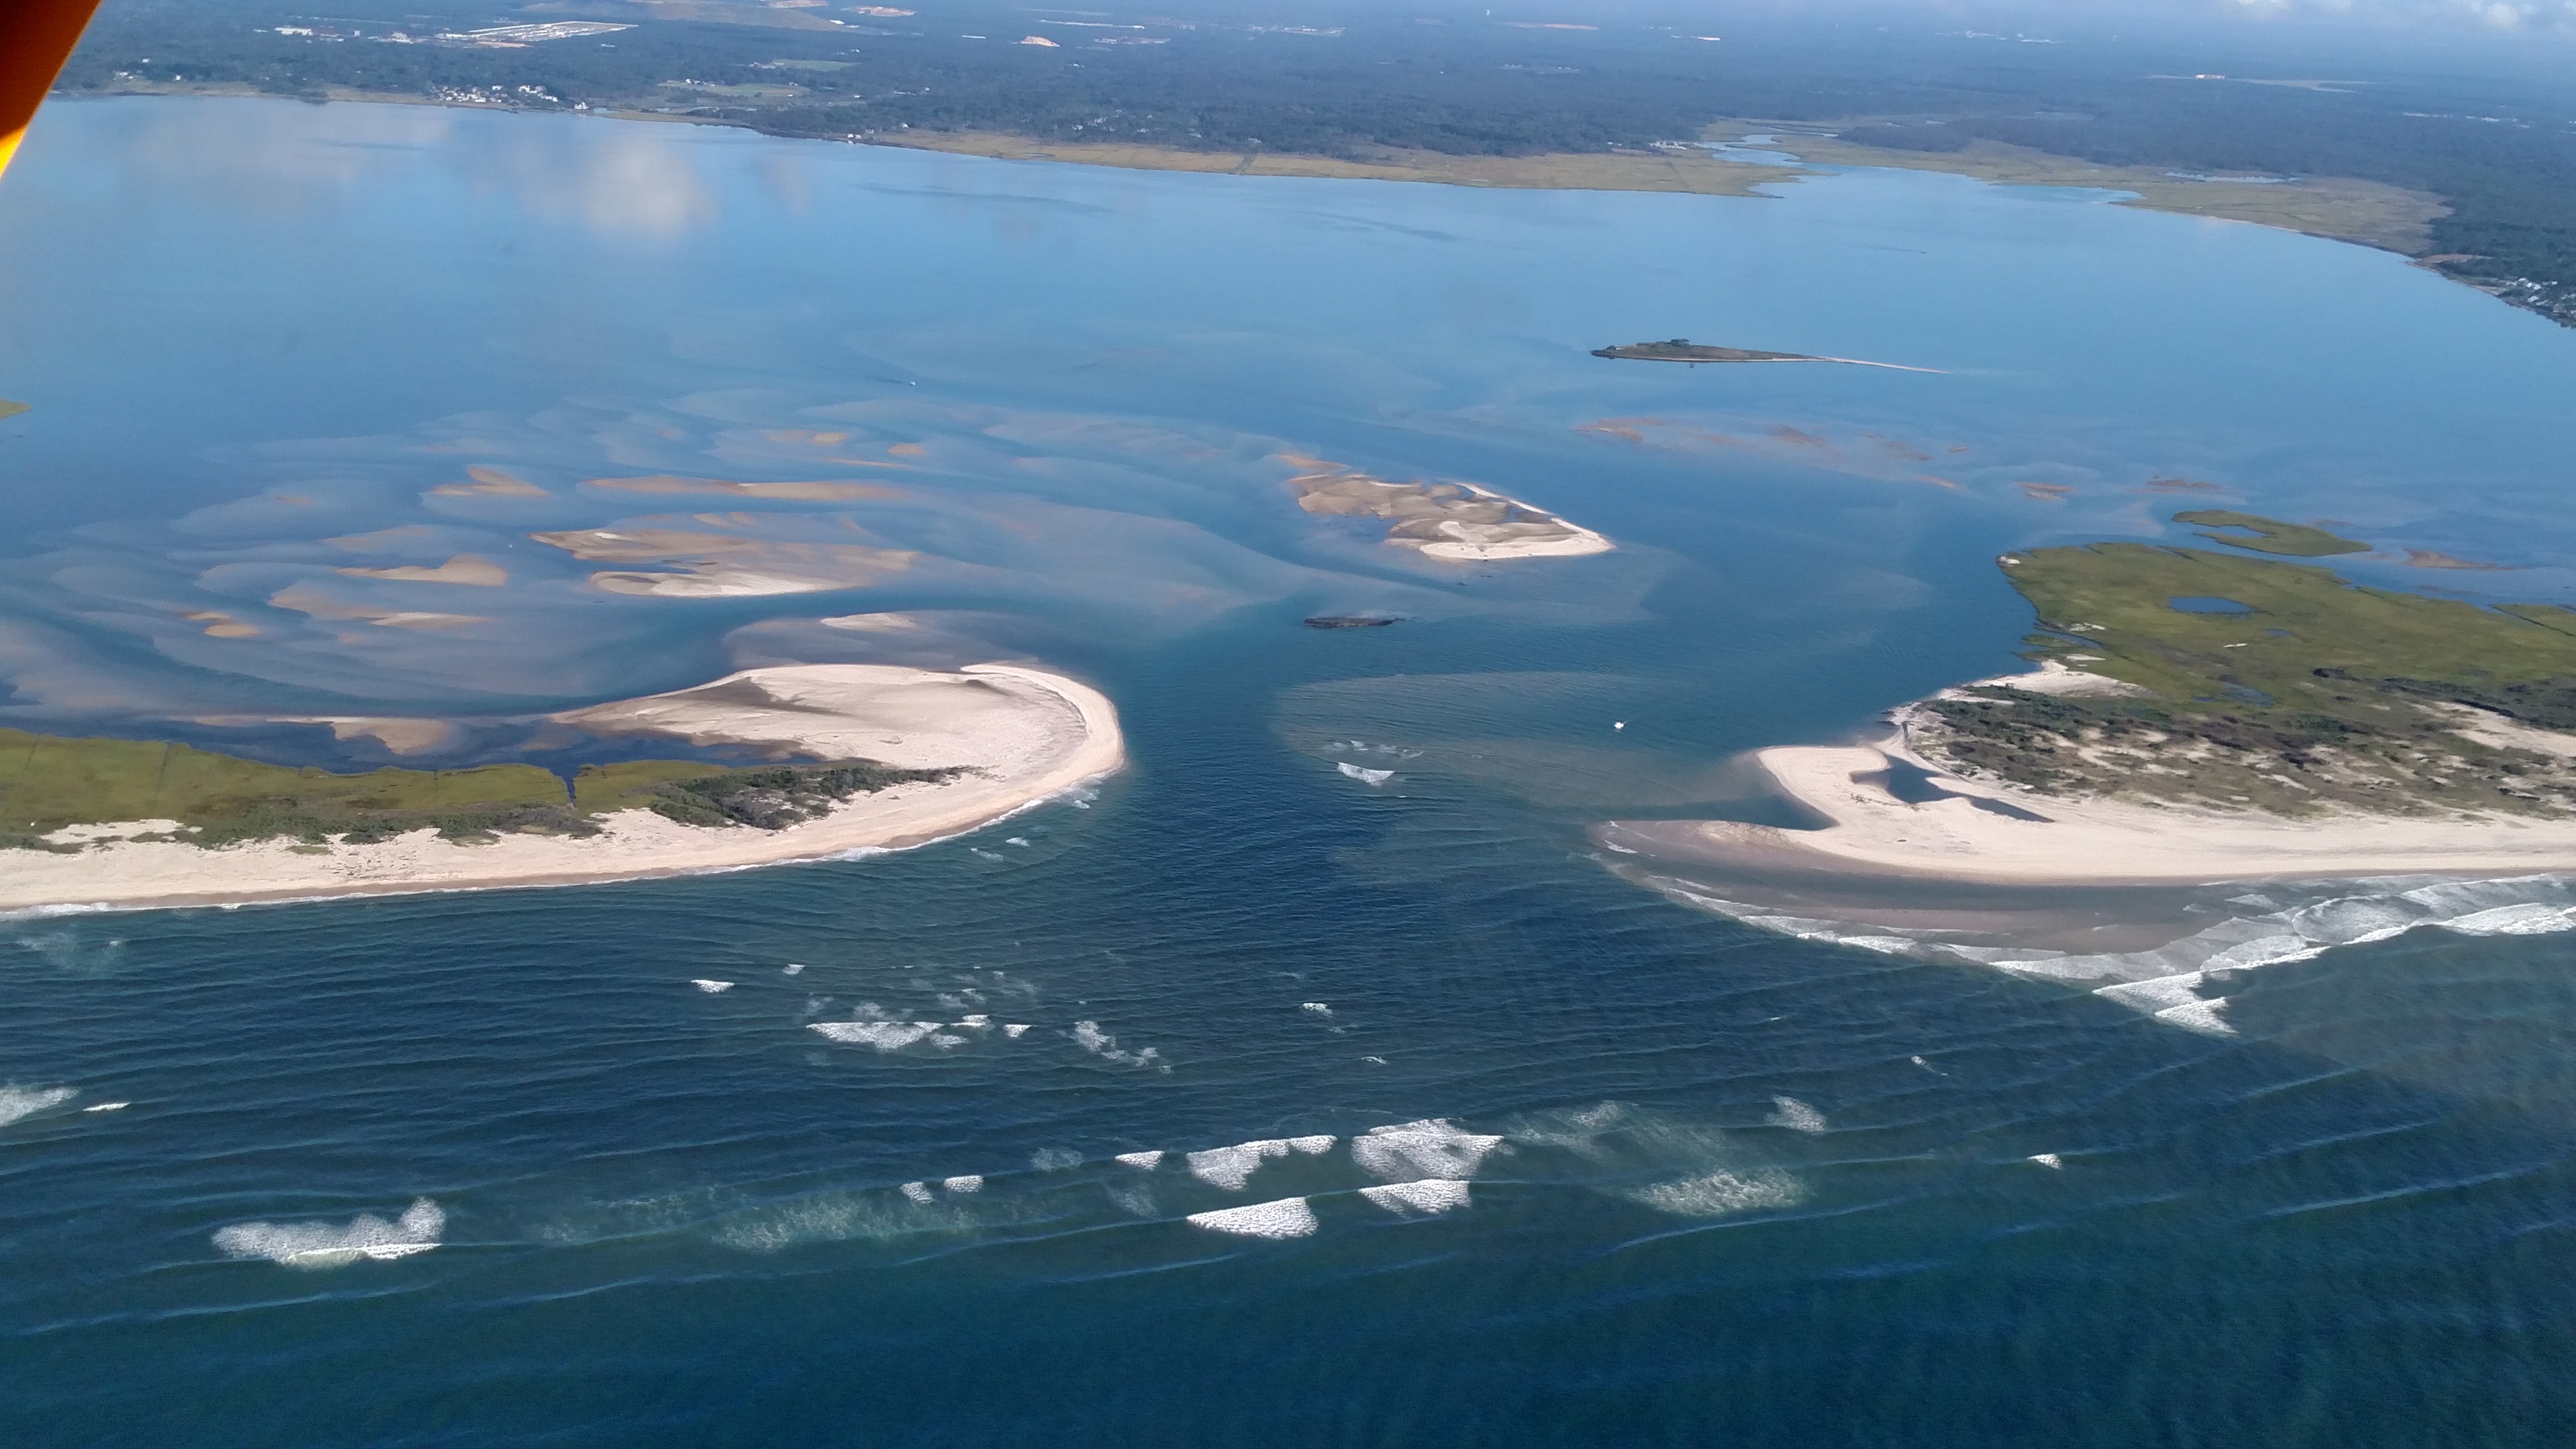 |
Oct 6, 2016 (CF)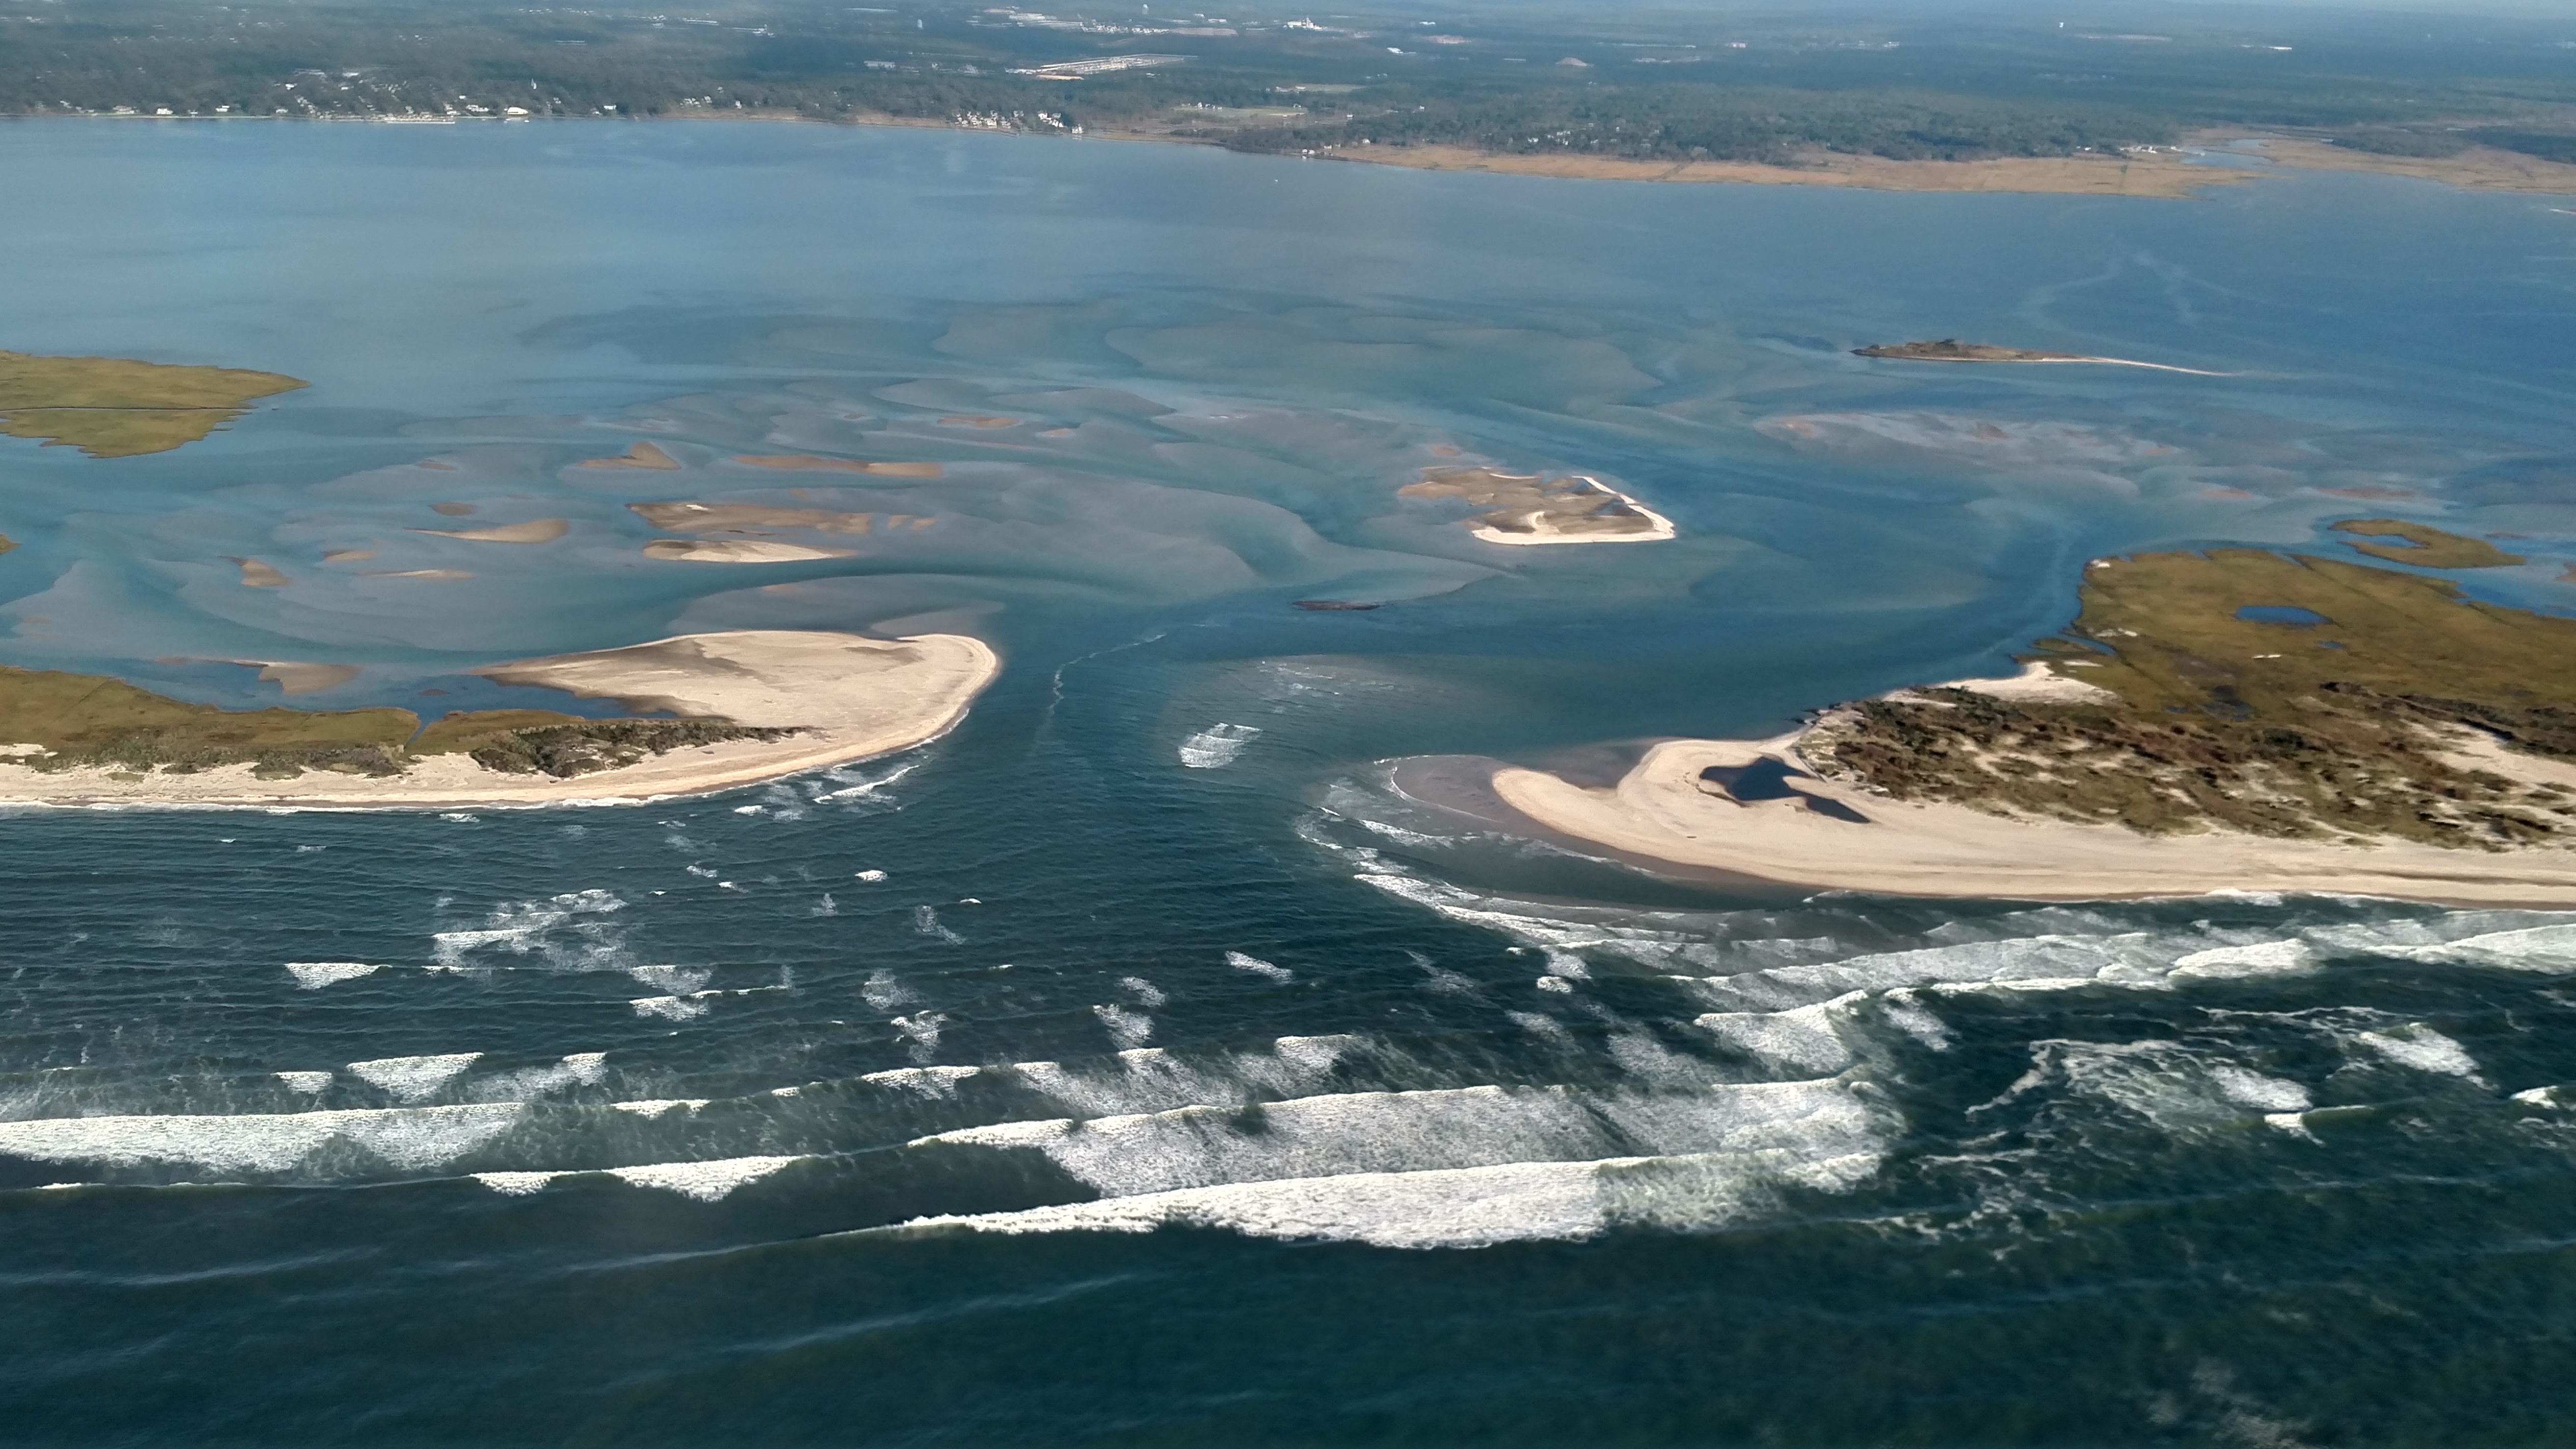 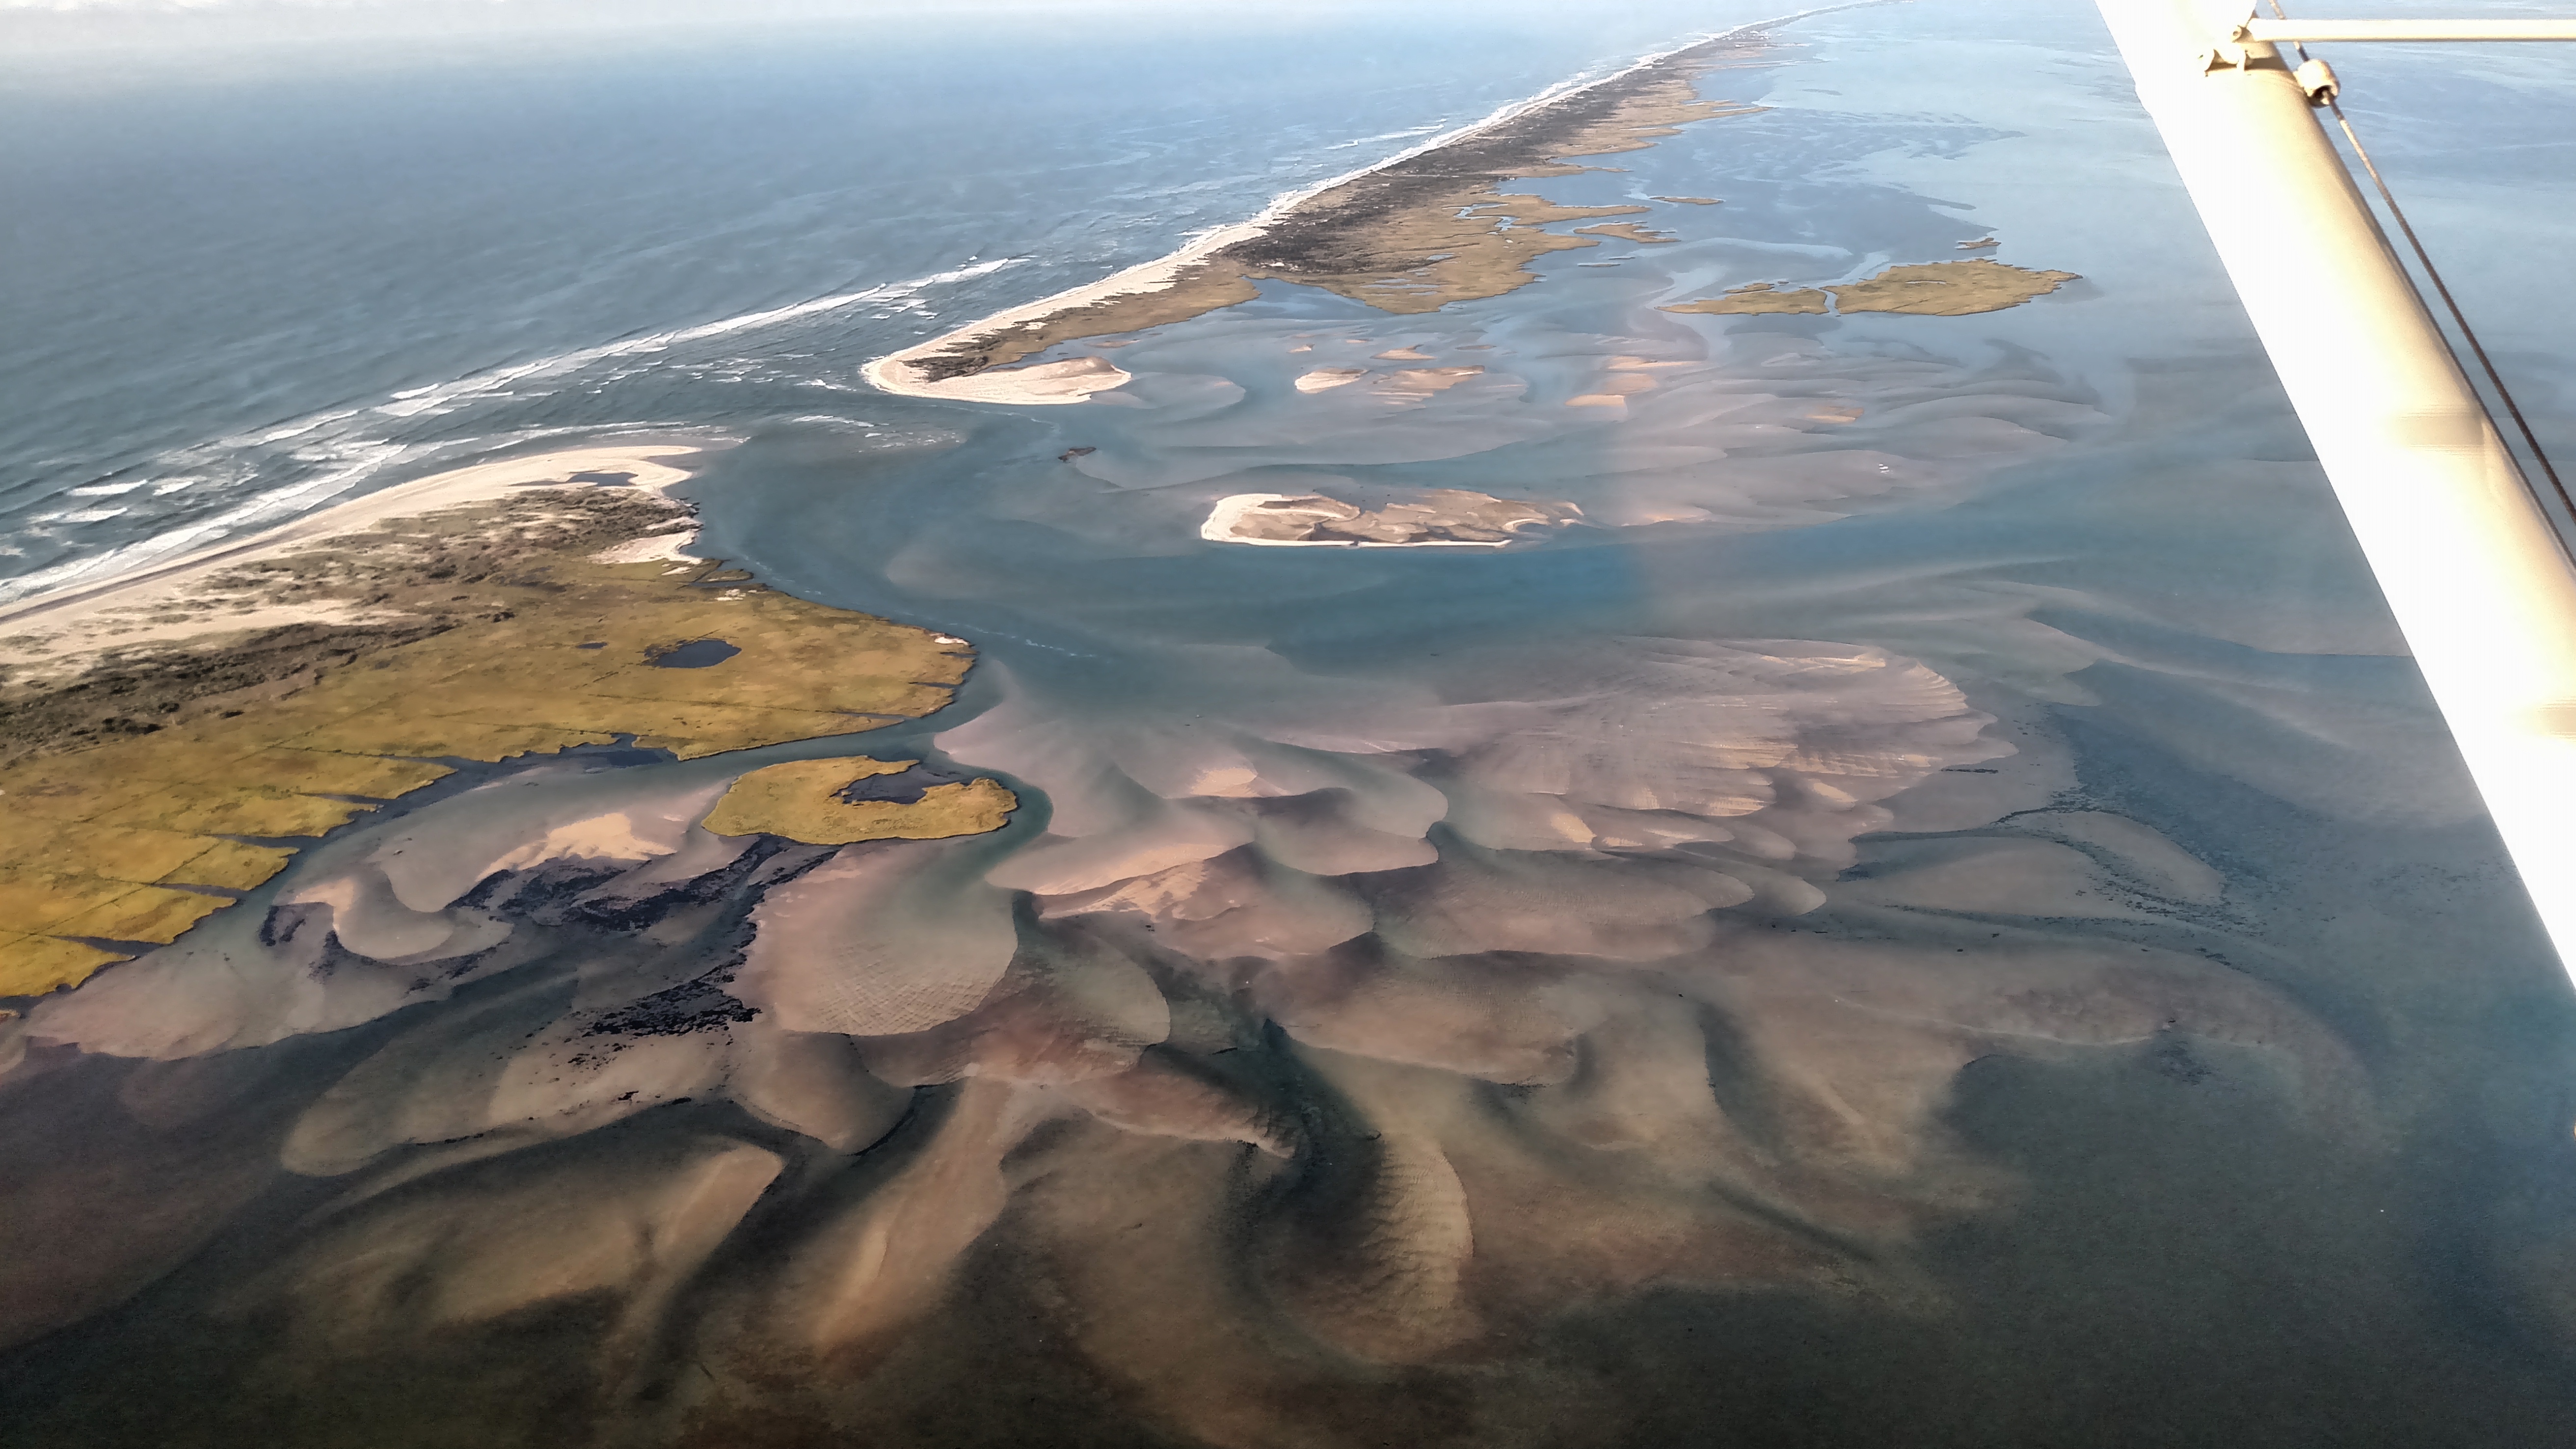 |
Oct 7, 2016 (JV)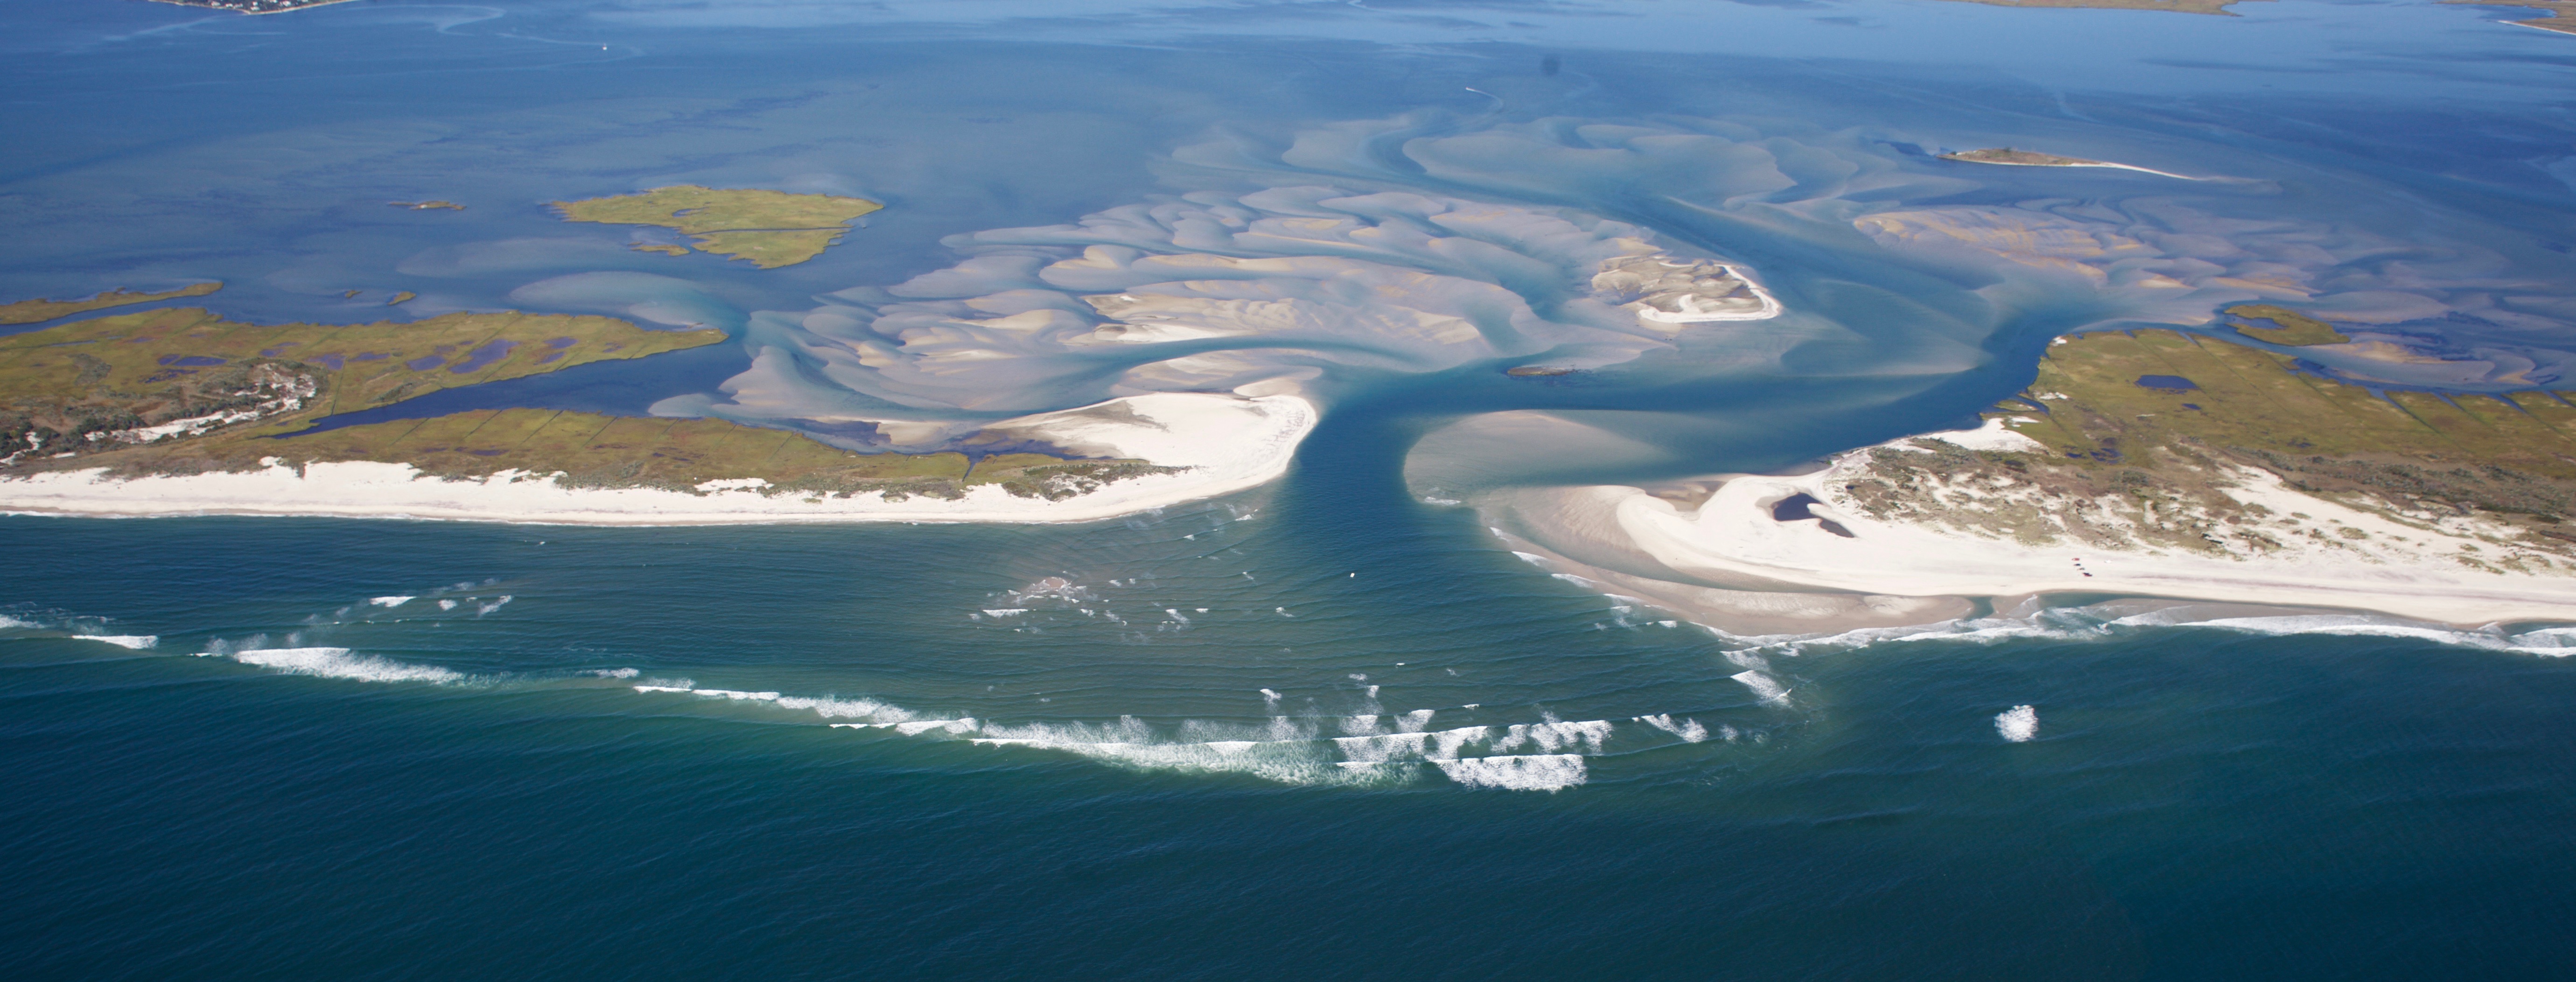  |
||||
Nov 8, 2016 (CF)  |
Dec 8, 2016 (CF)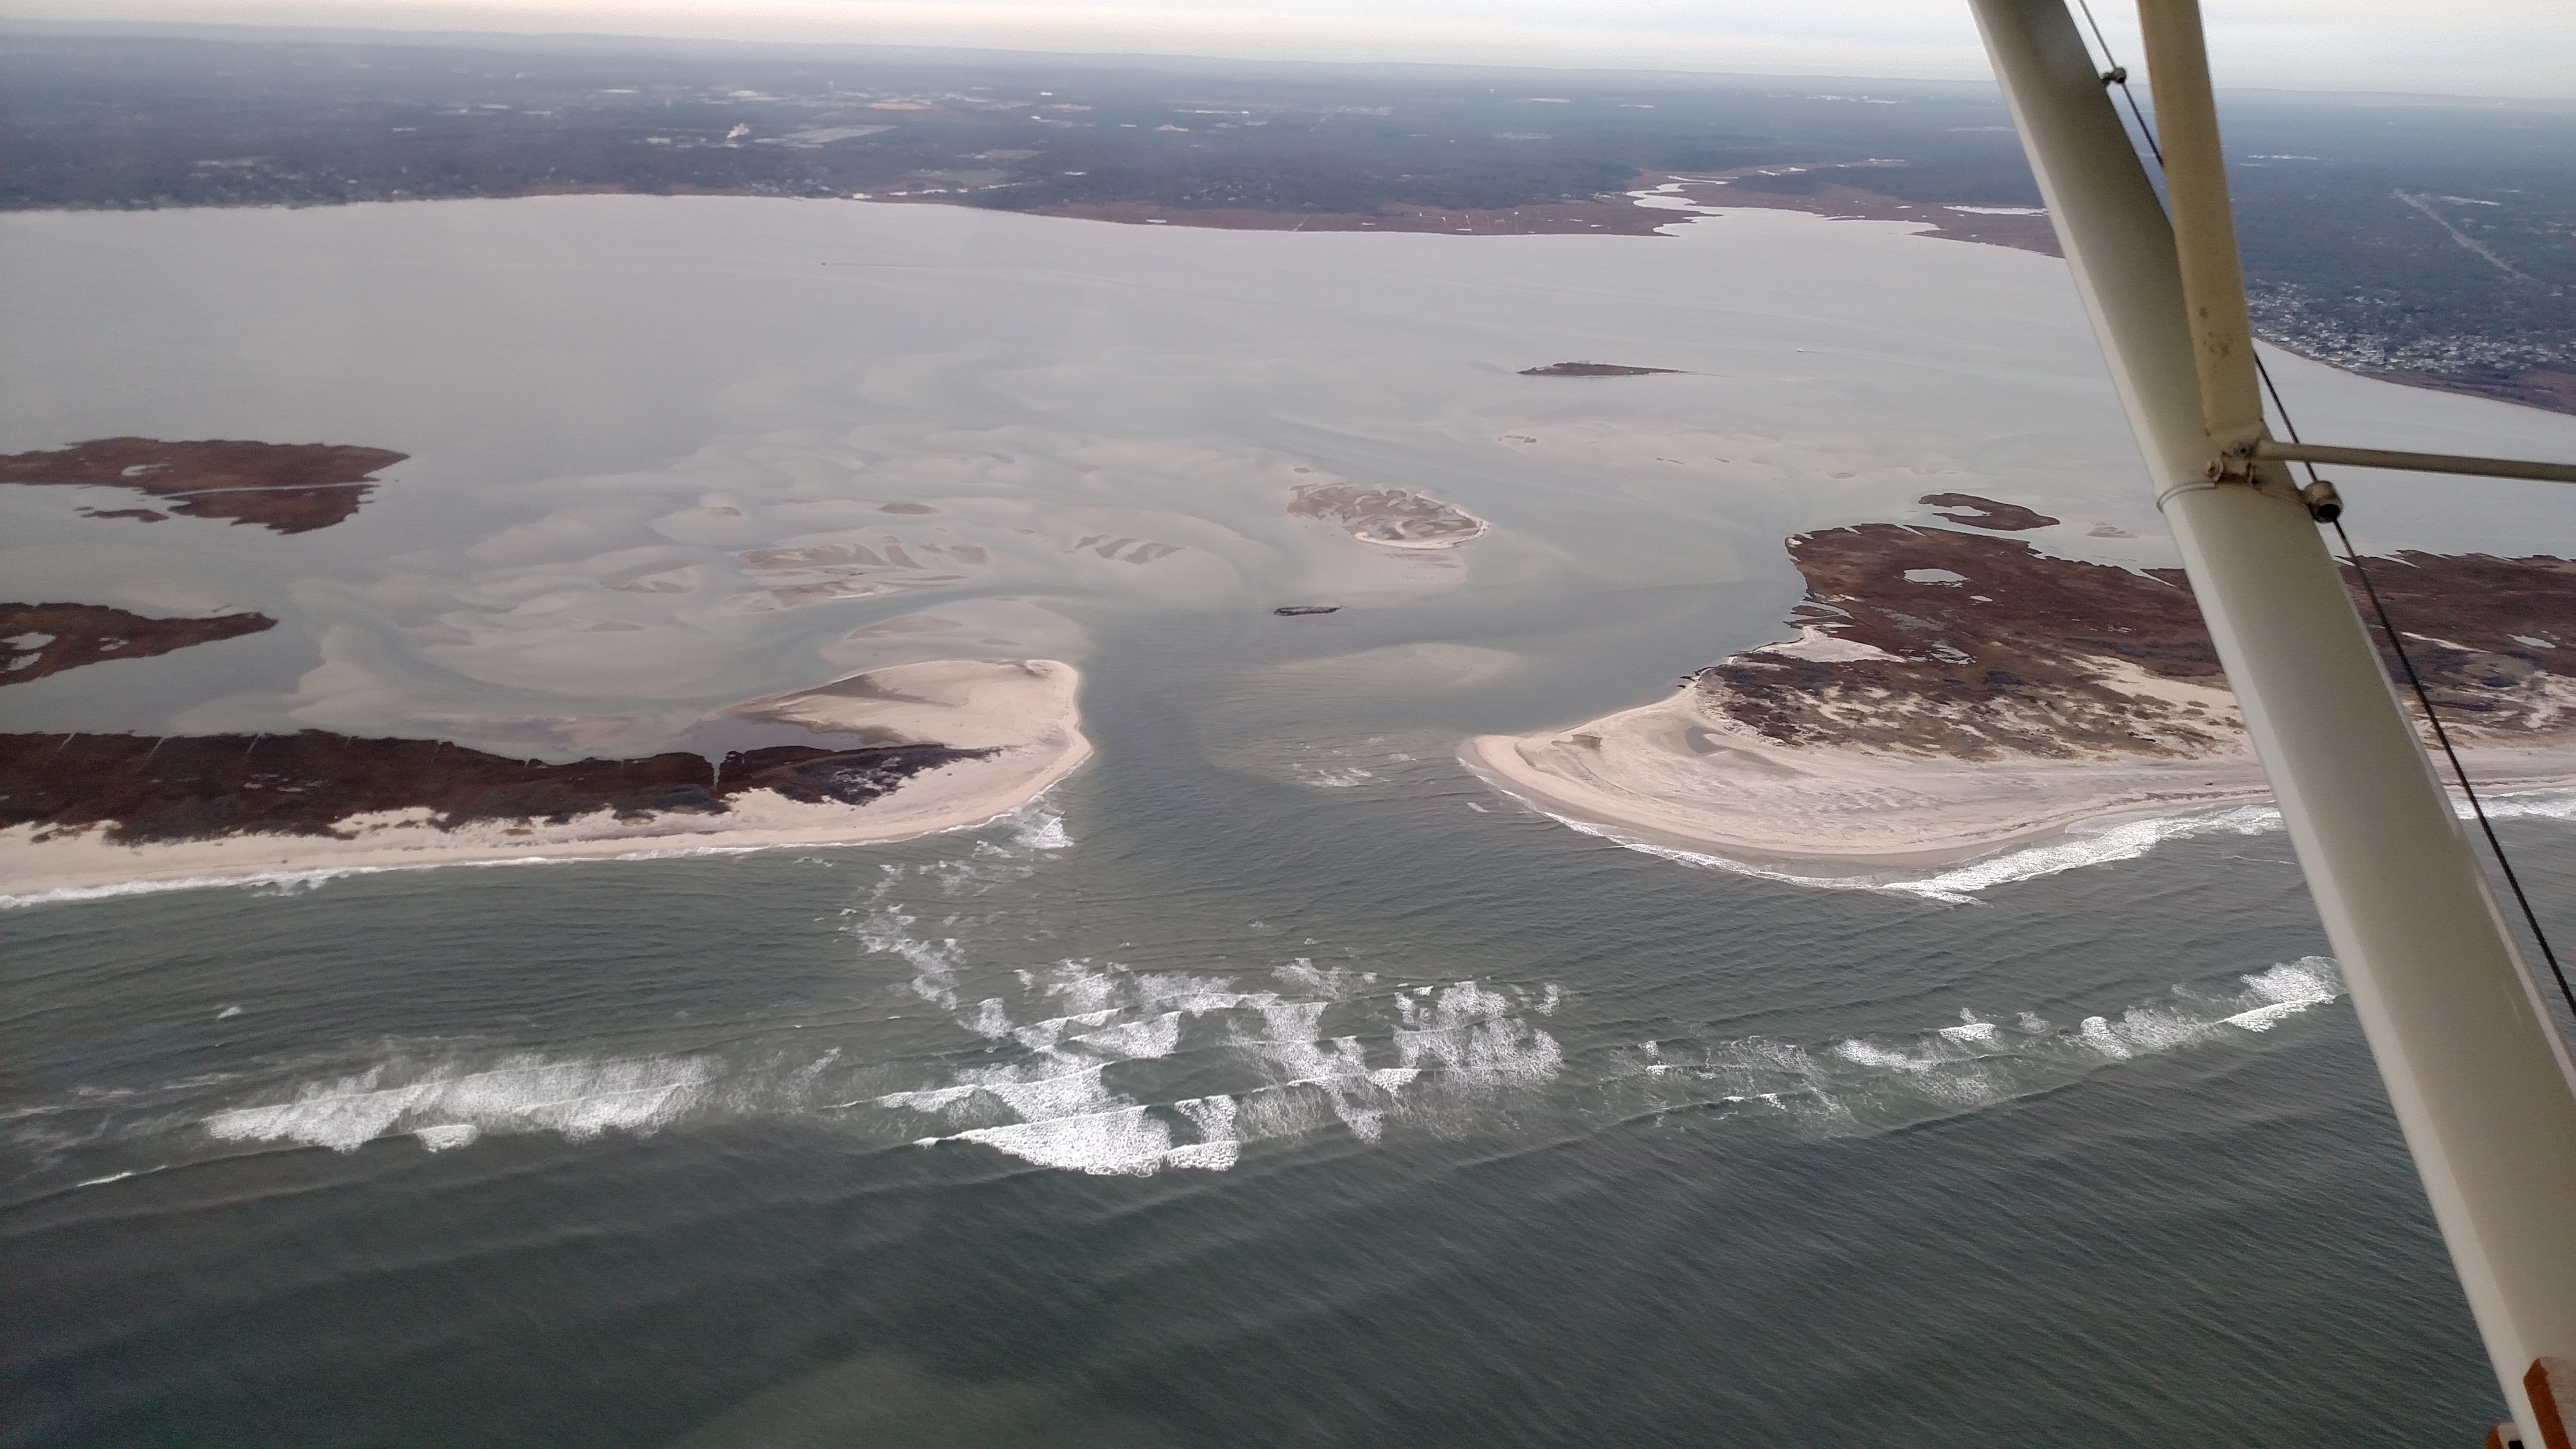 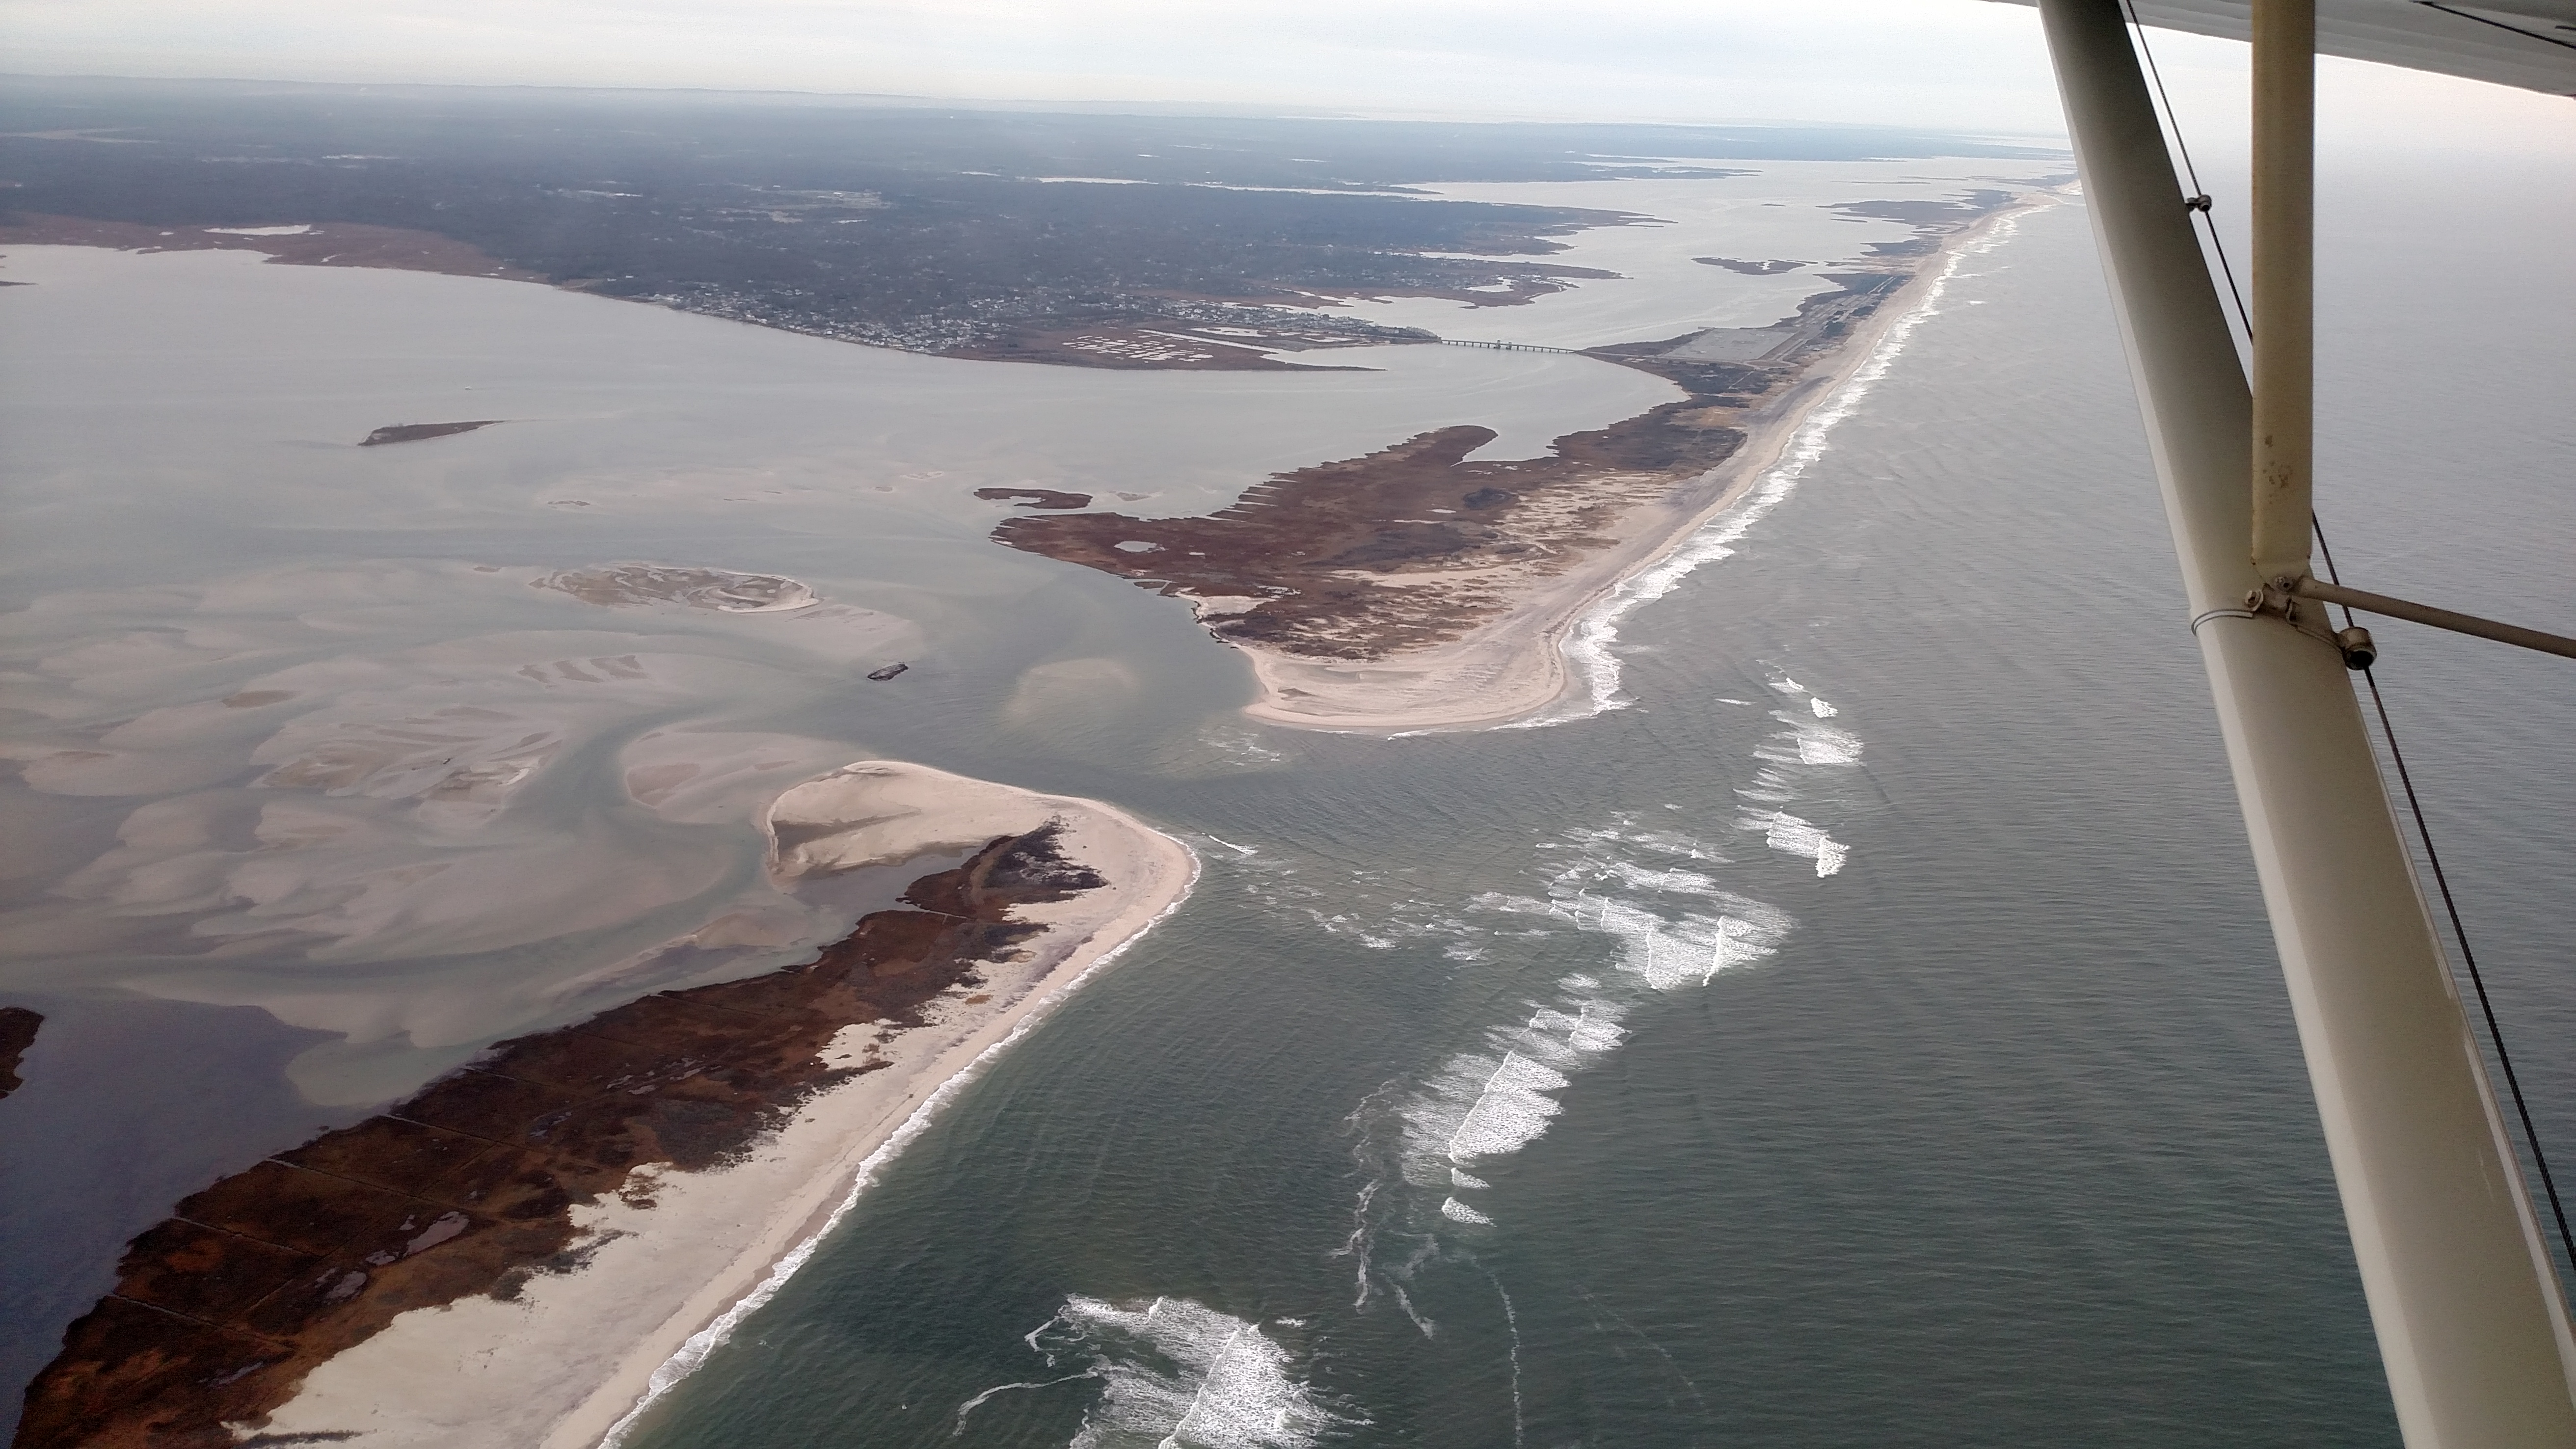 |
Jan 15, 2017 (CF&JF)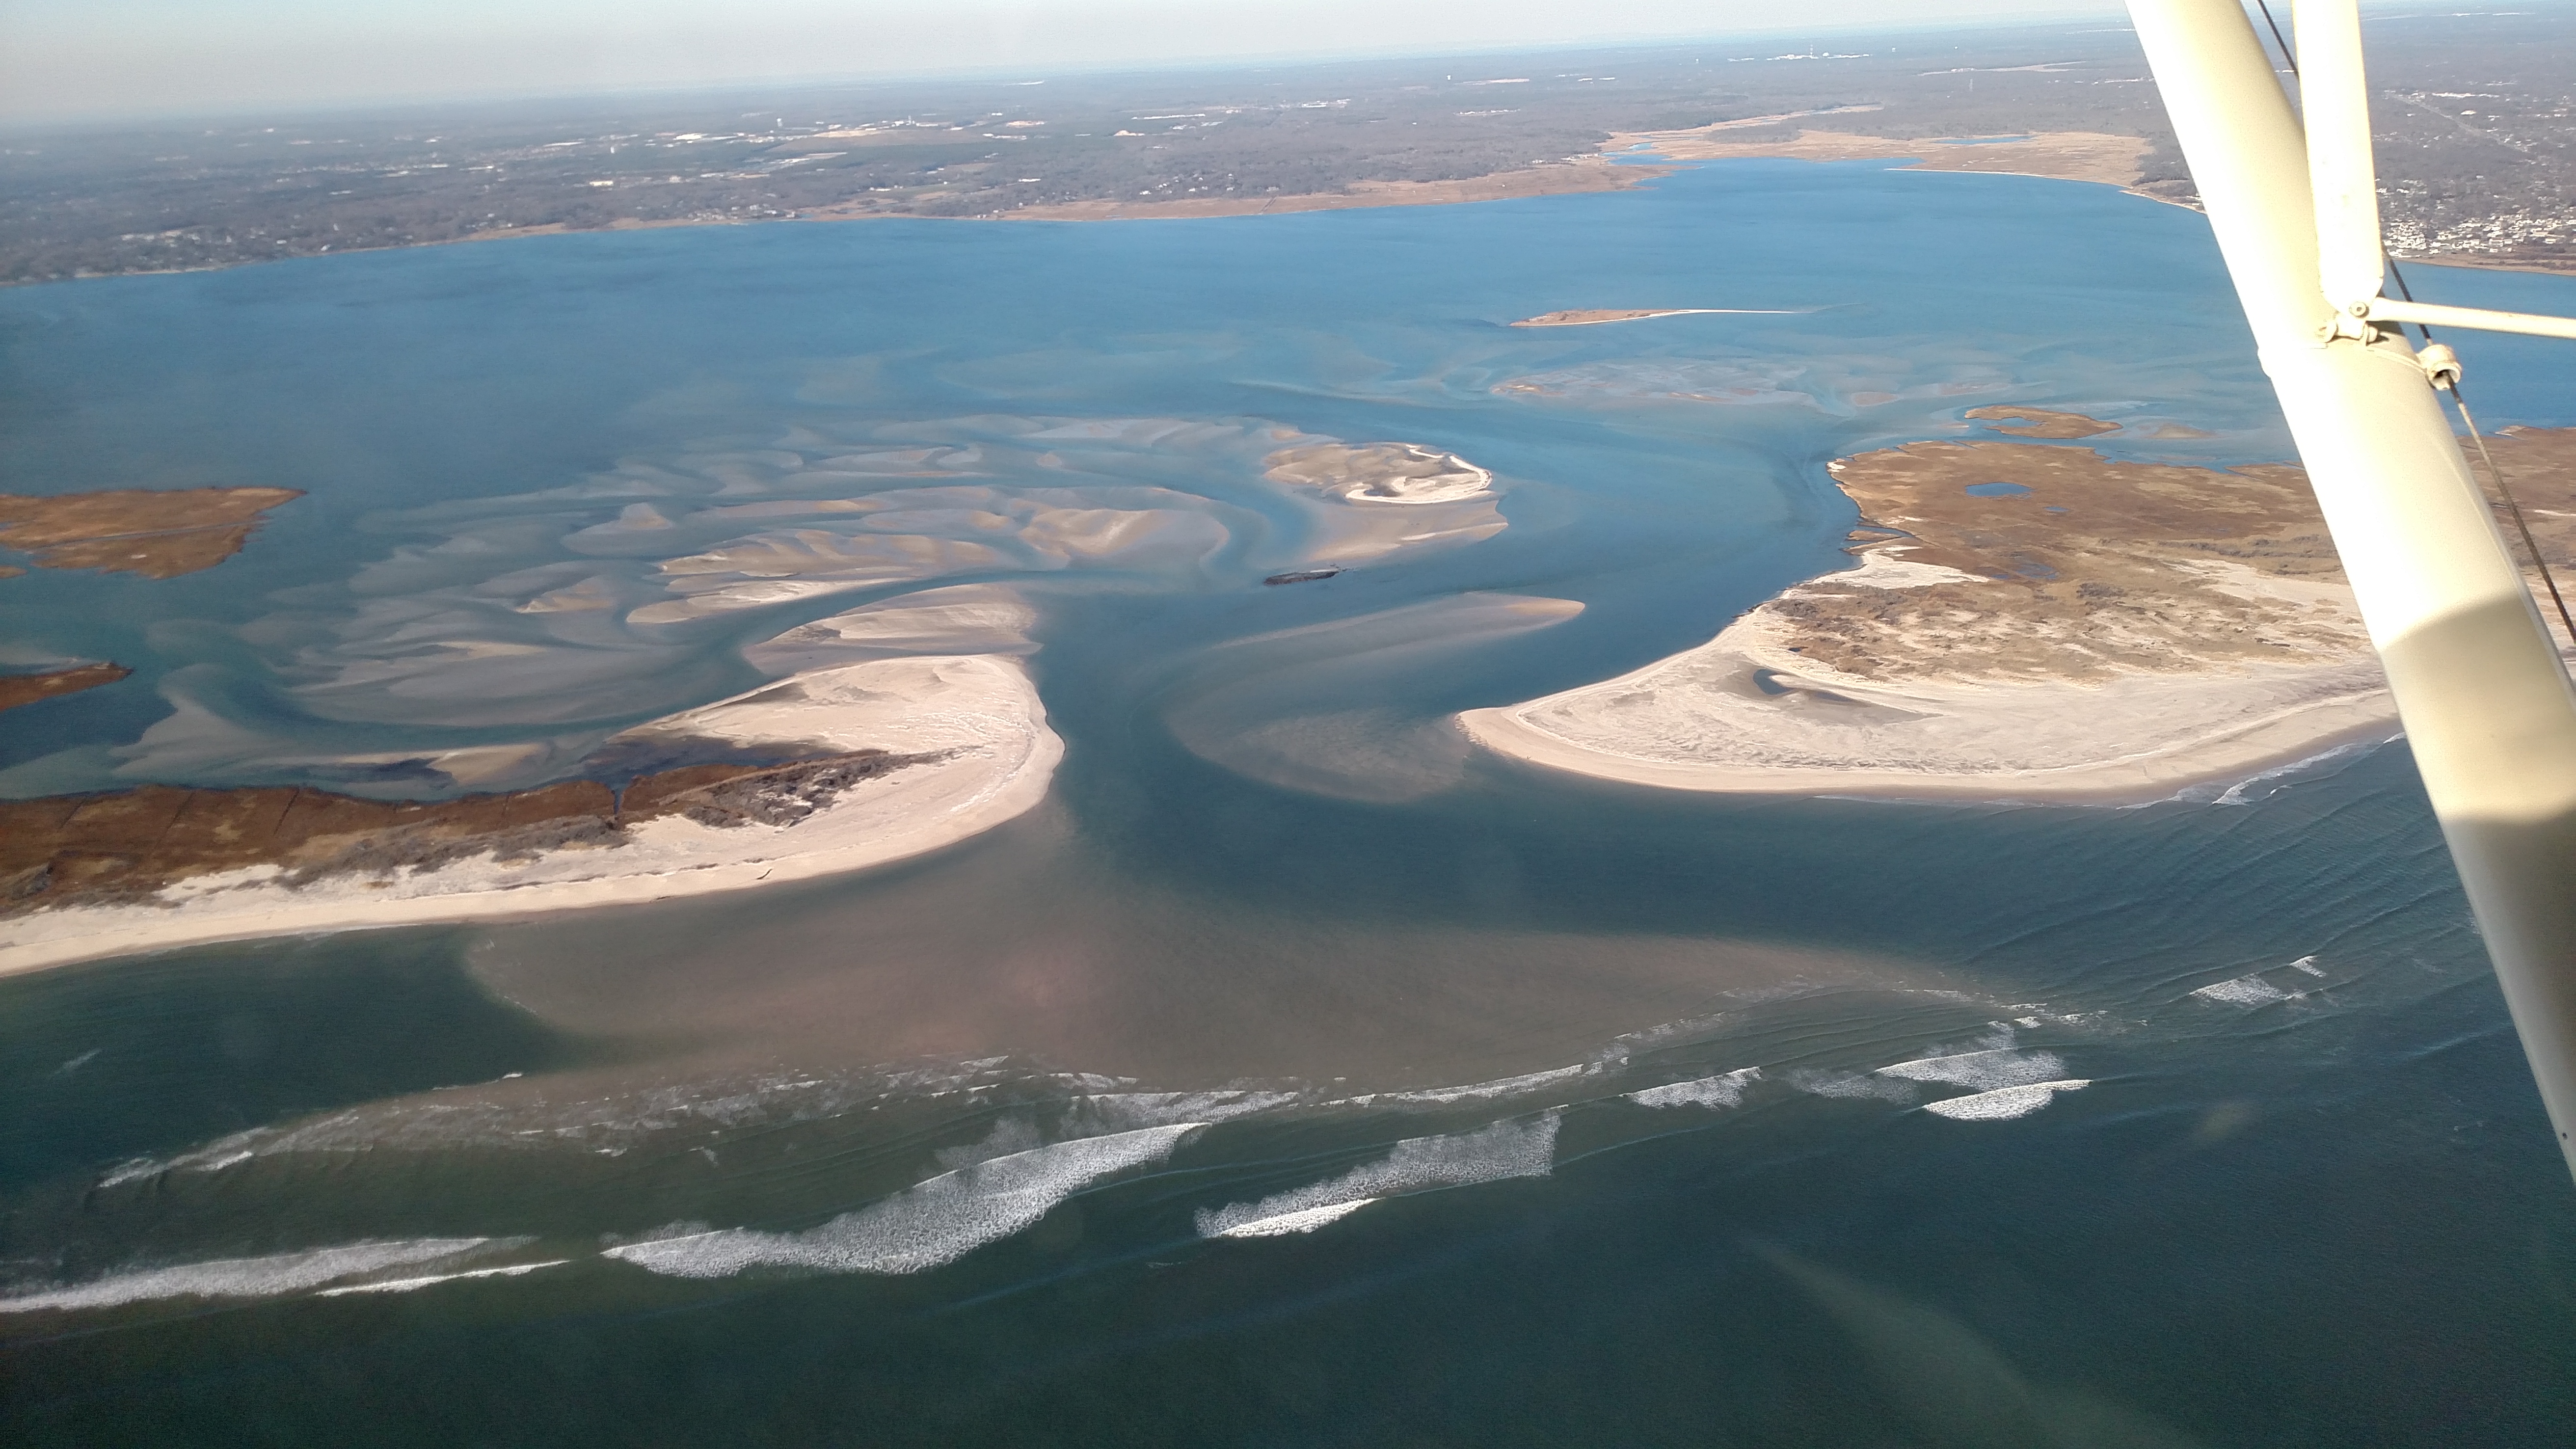 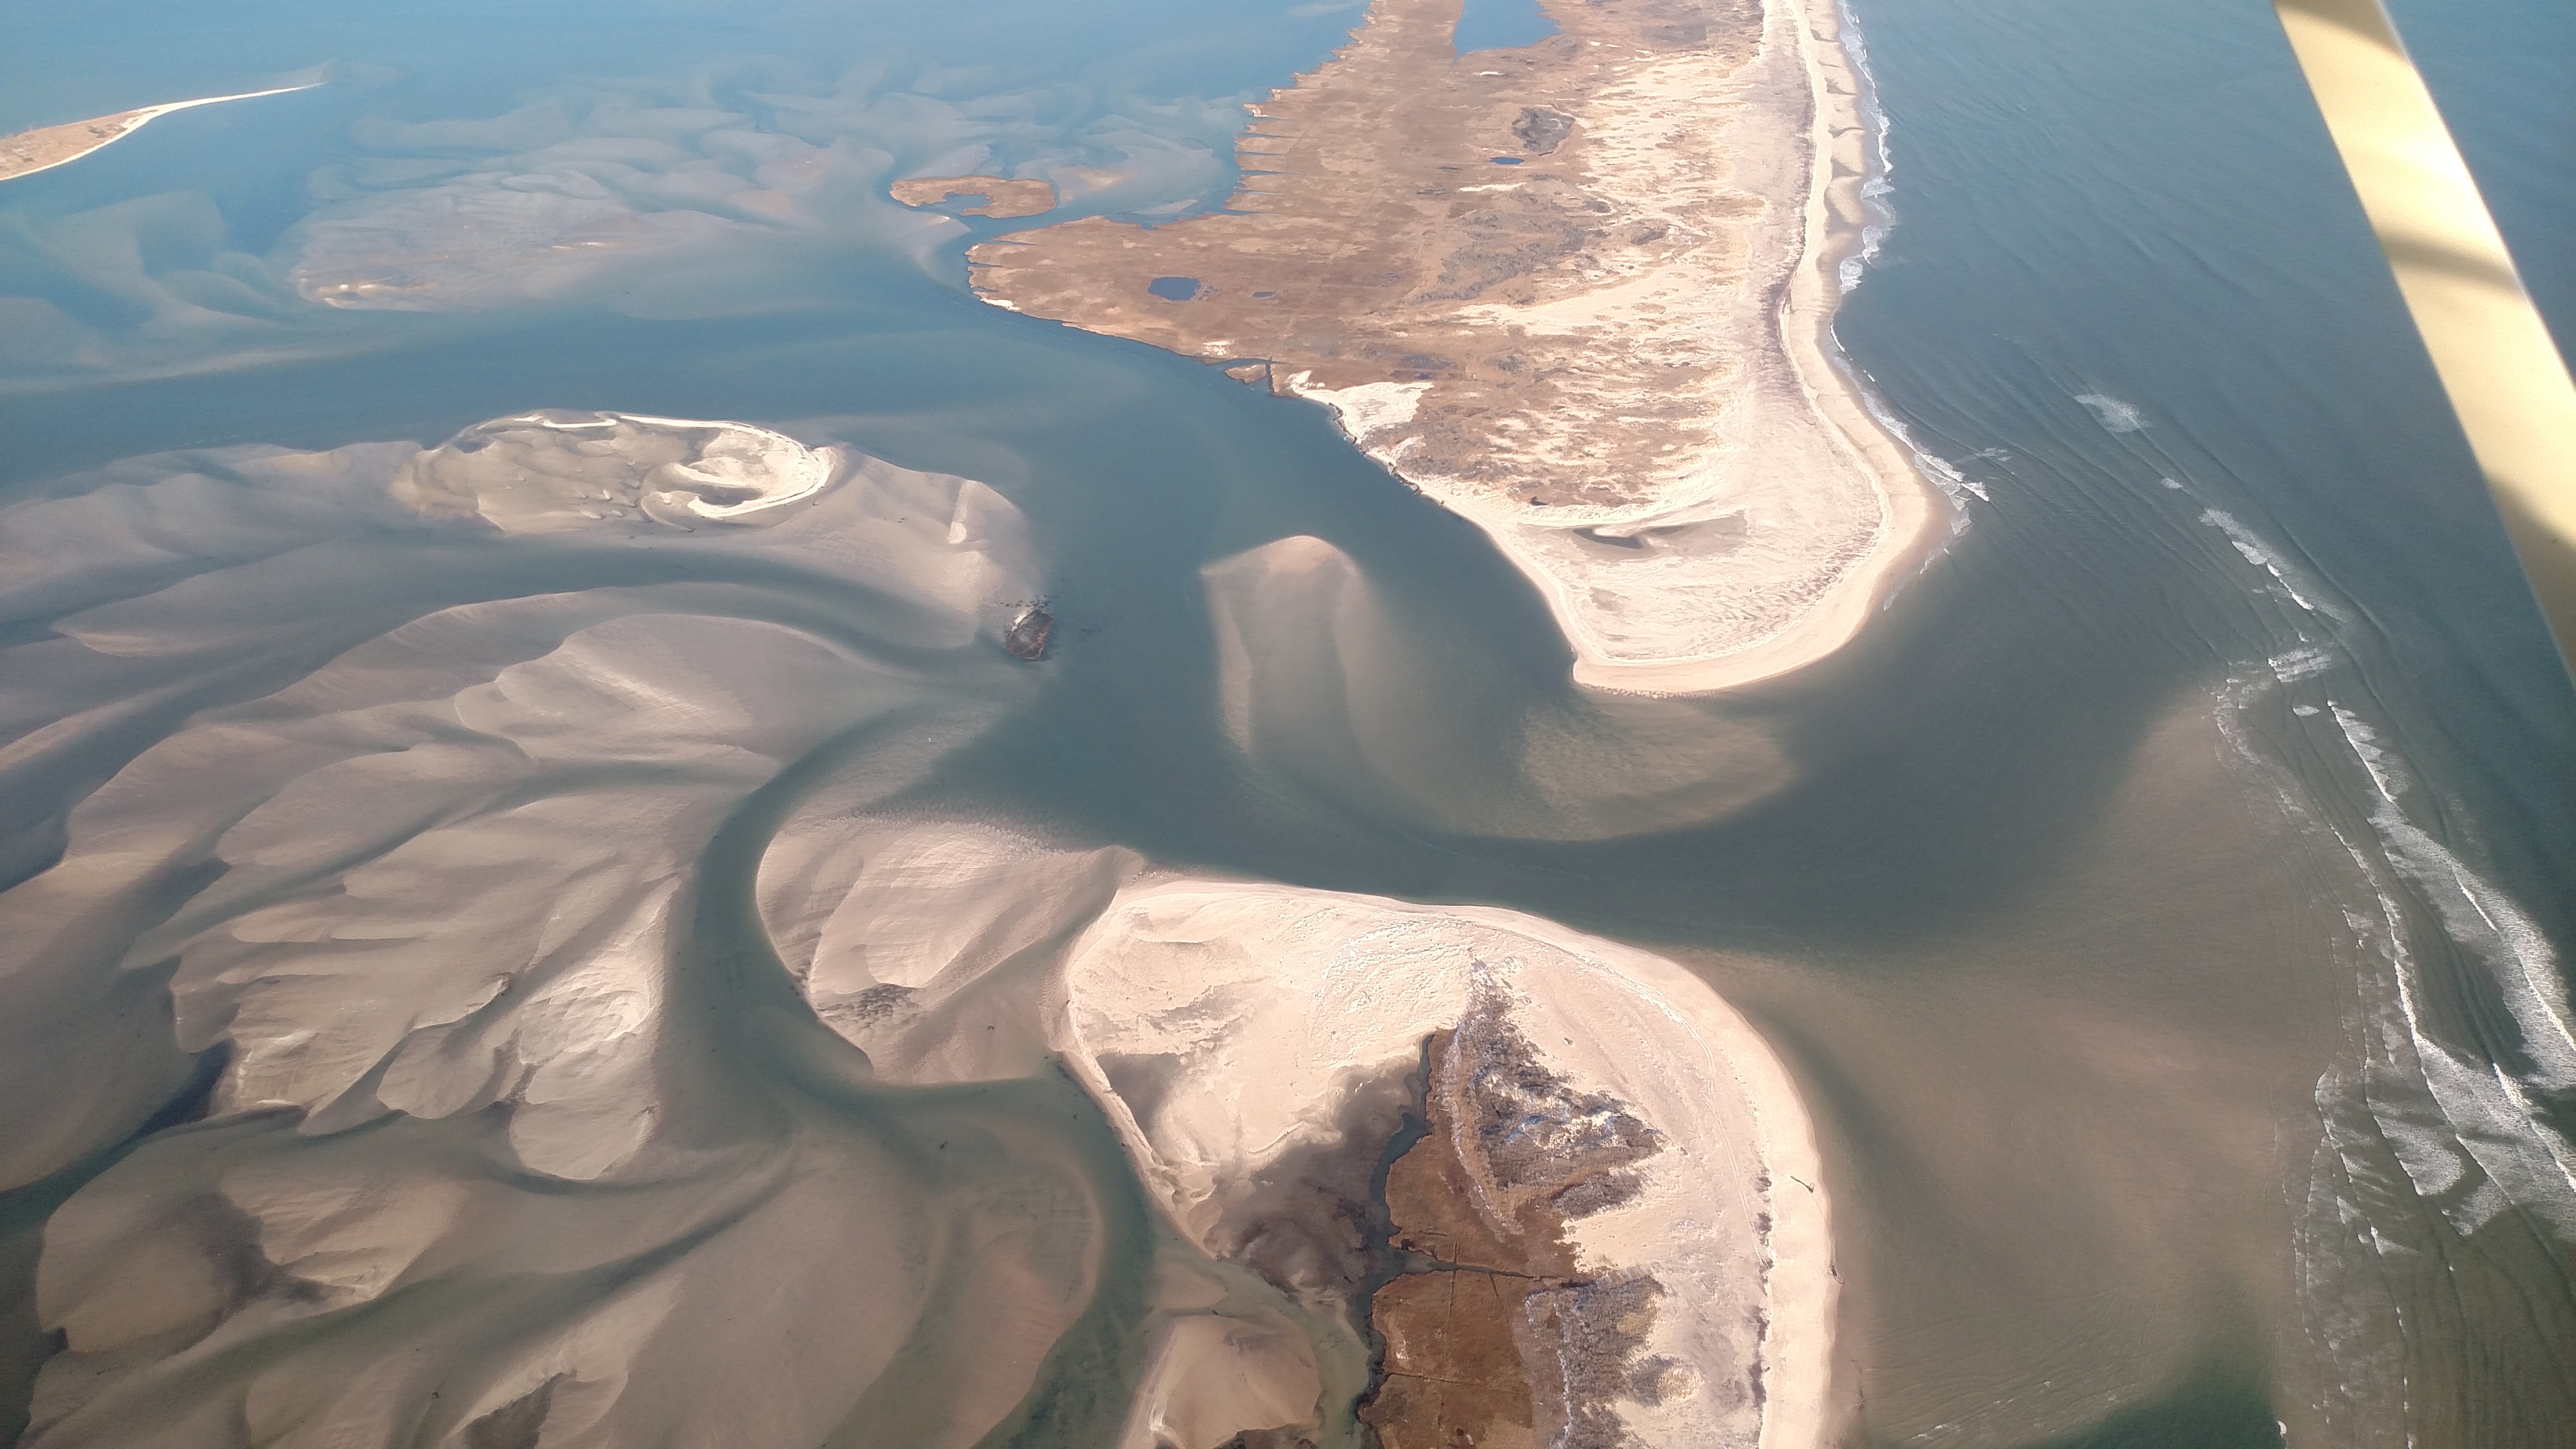 |
Feb 4, 2017 (CF)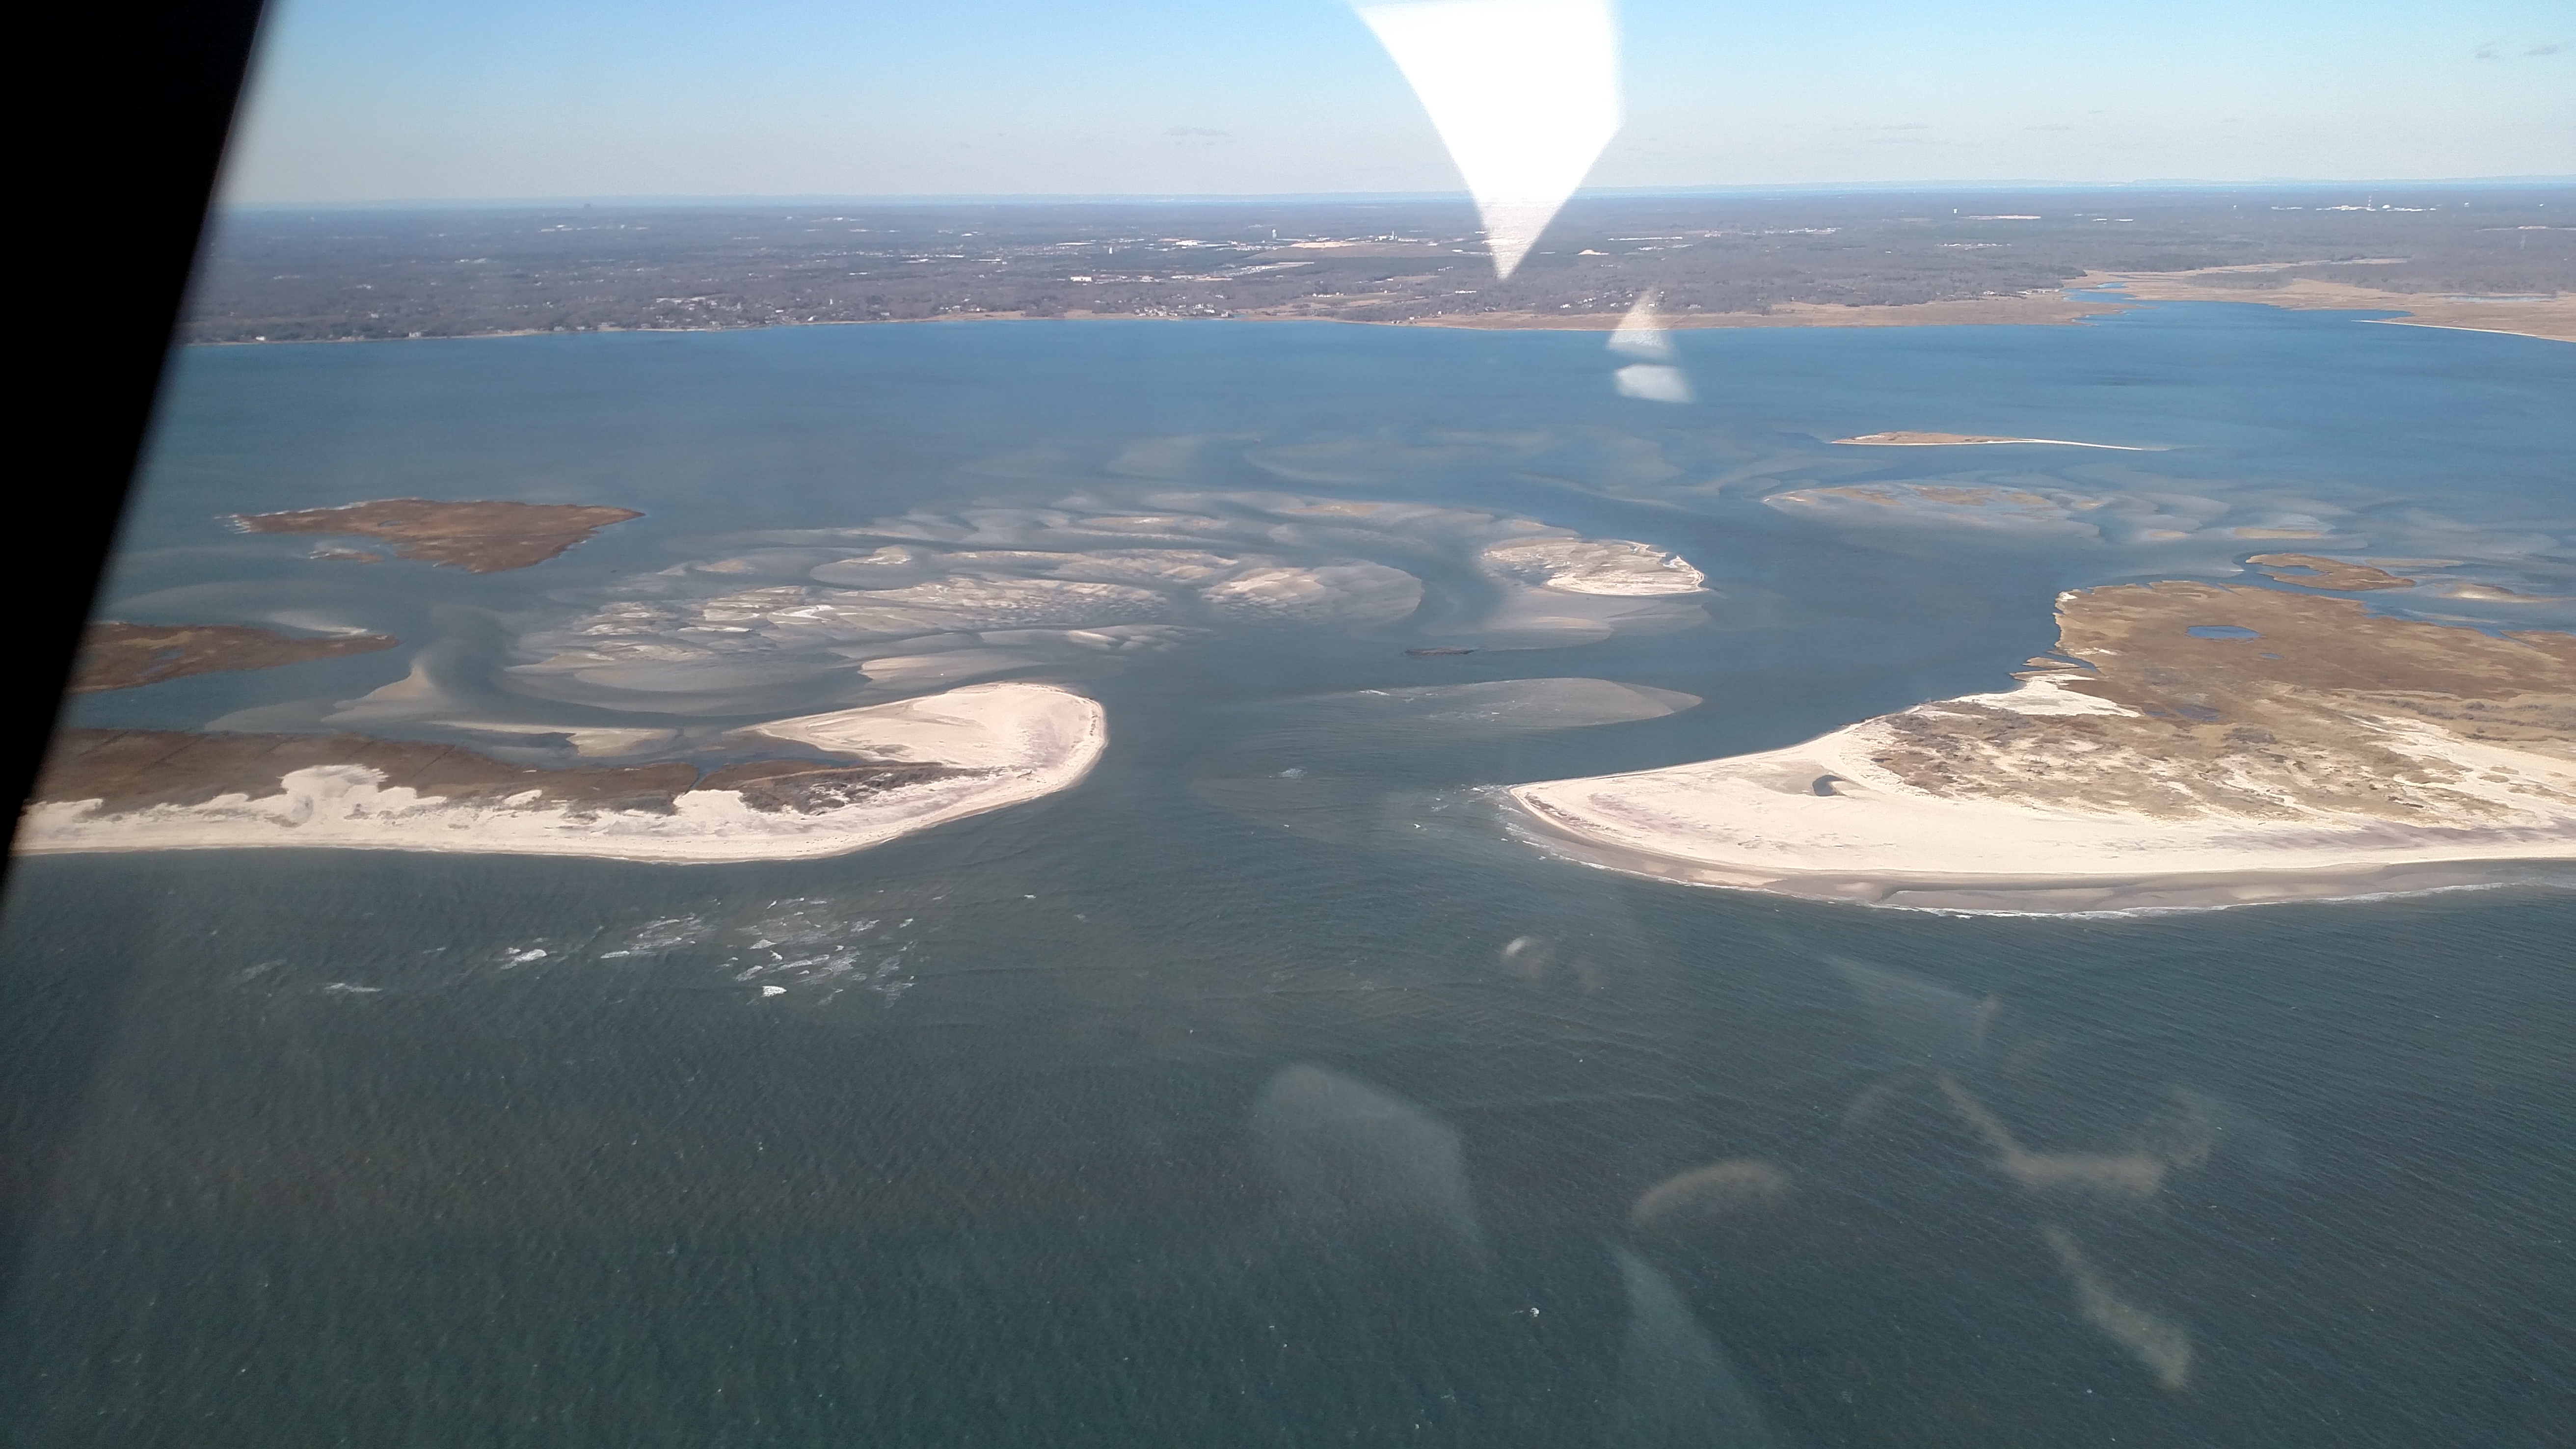  |
||||
Mar 13, 2017 (CF)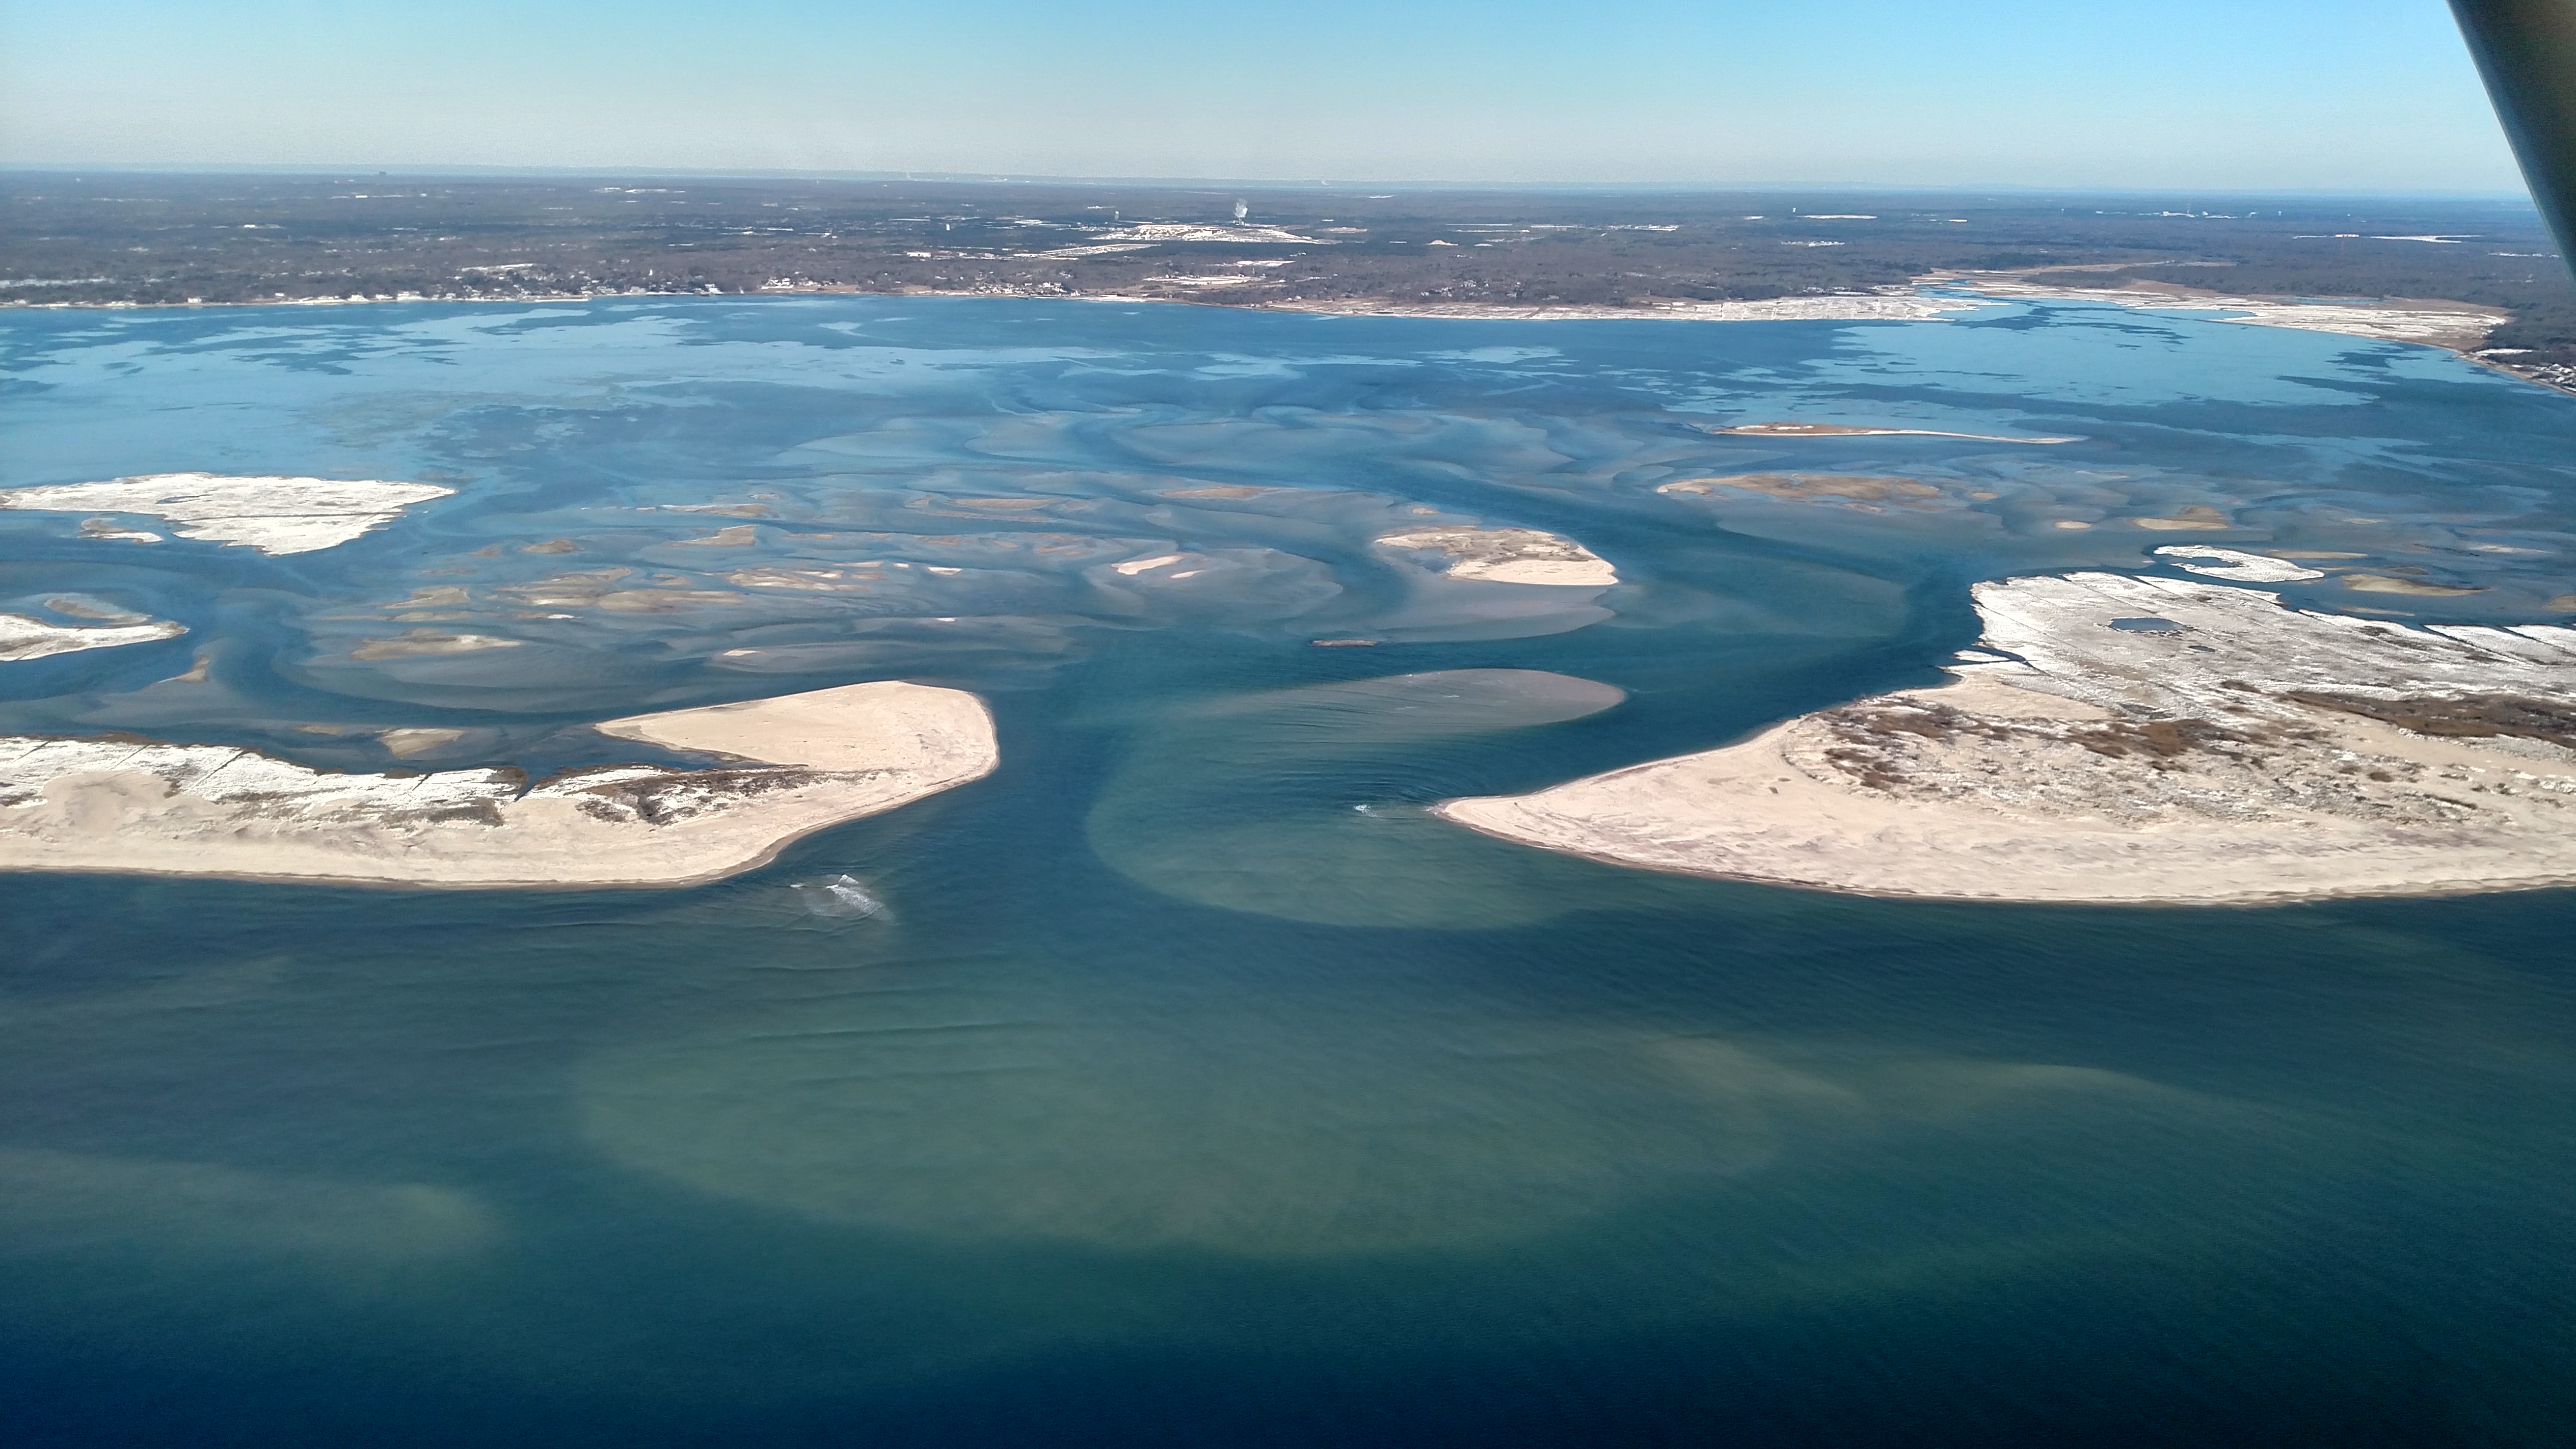 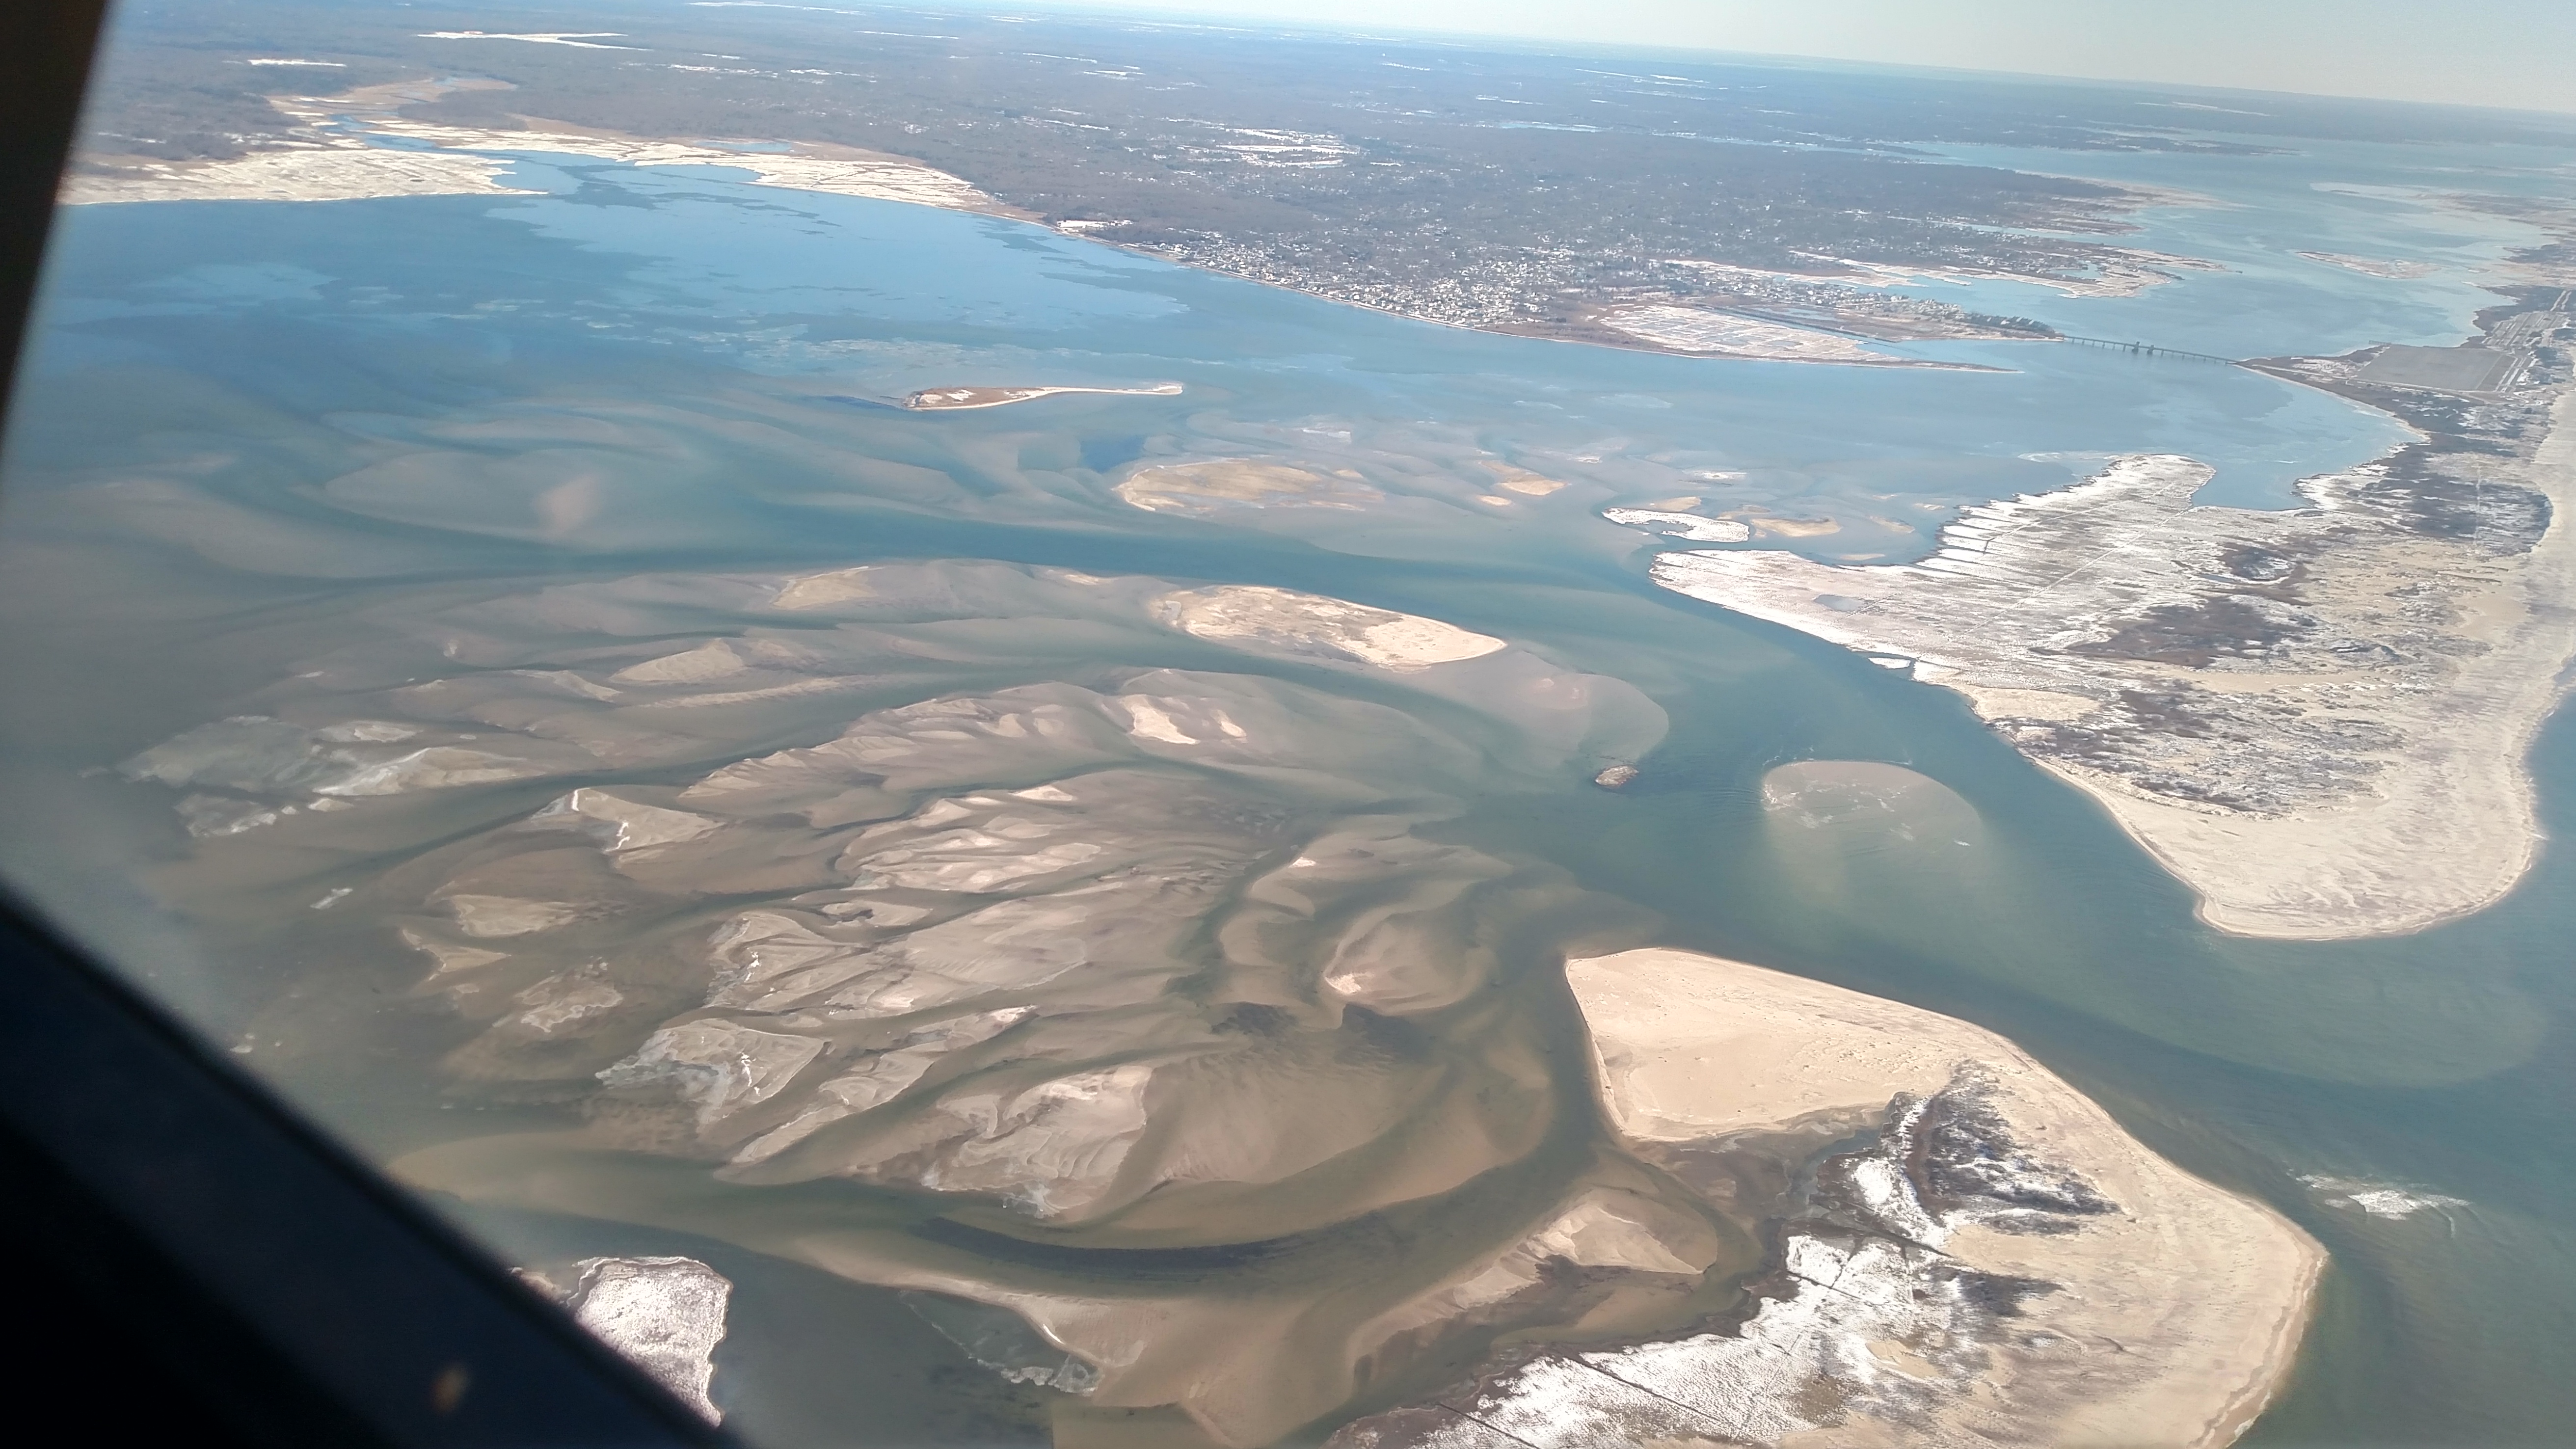 |
Mar 24, 2017 (JV) |
Apr 9, 2017 (CF)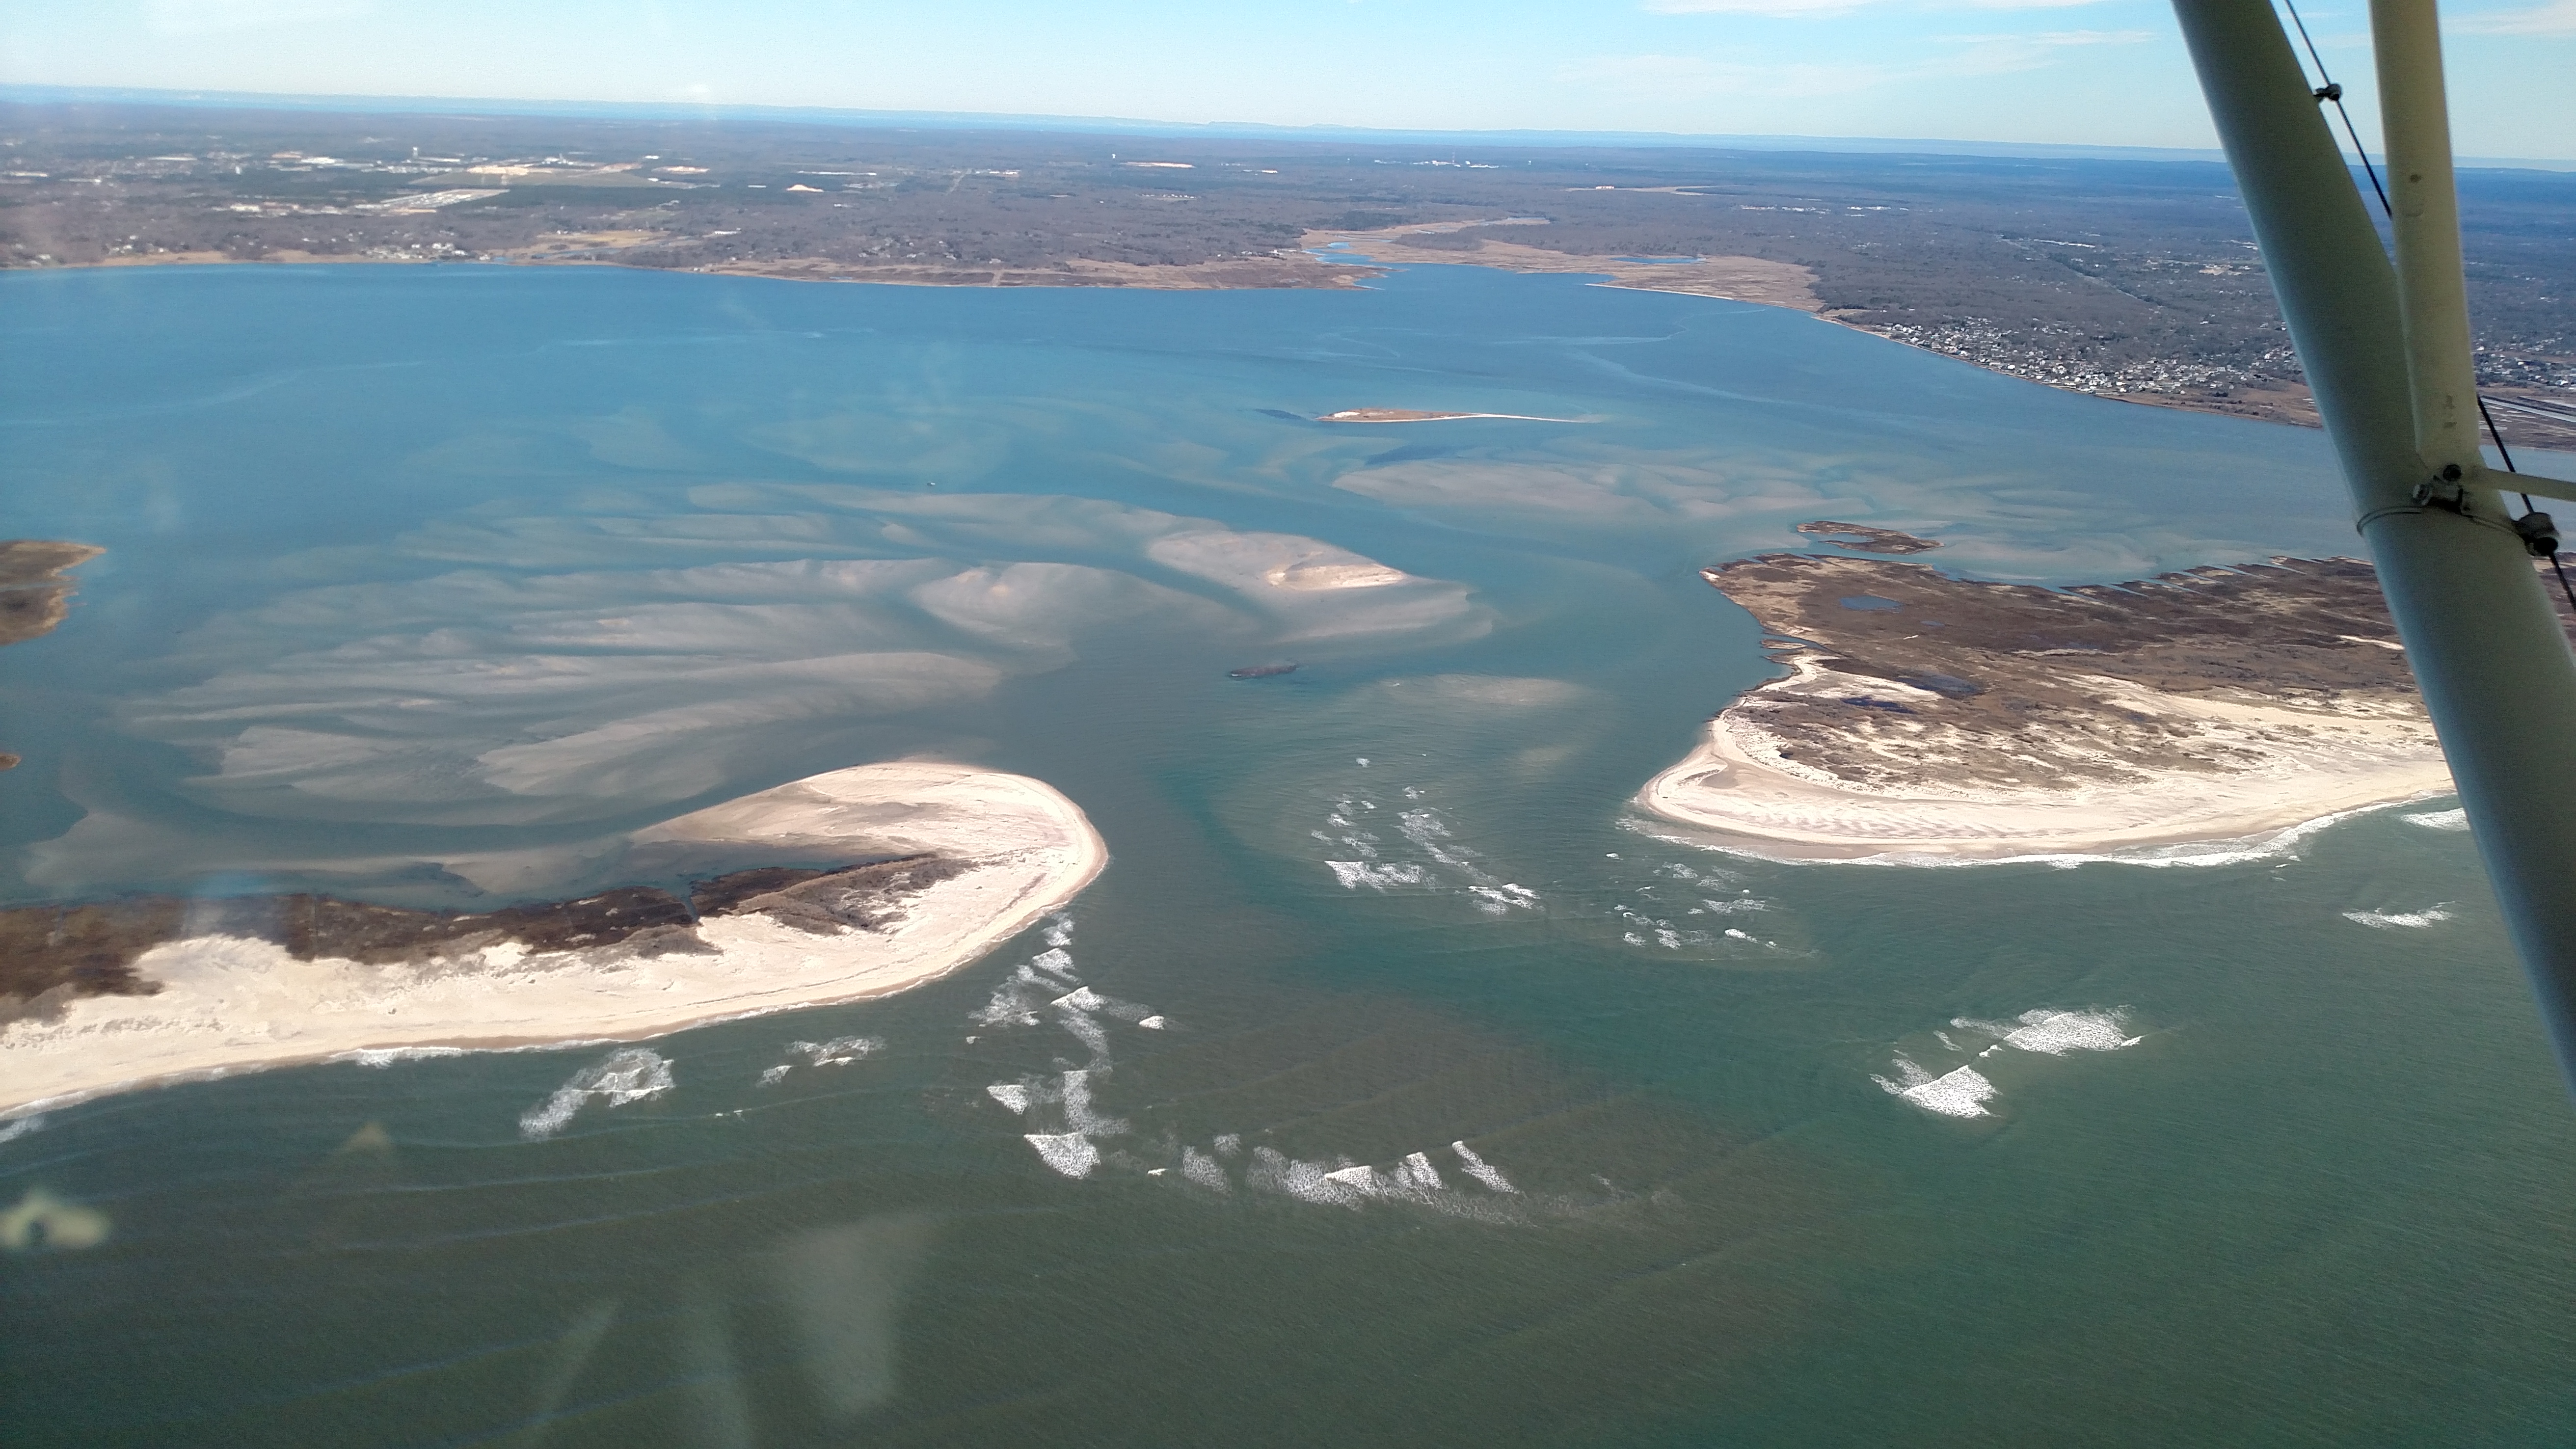 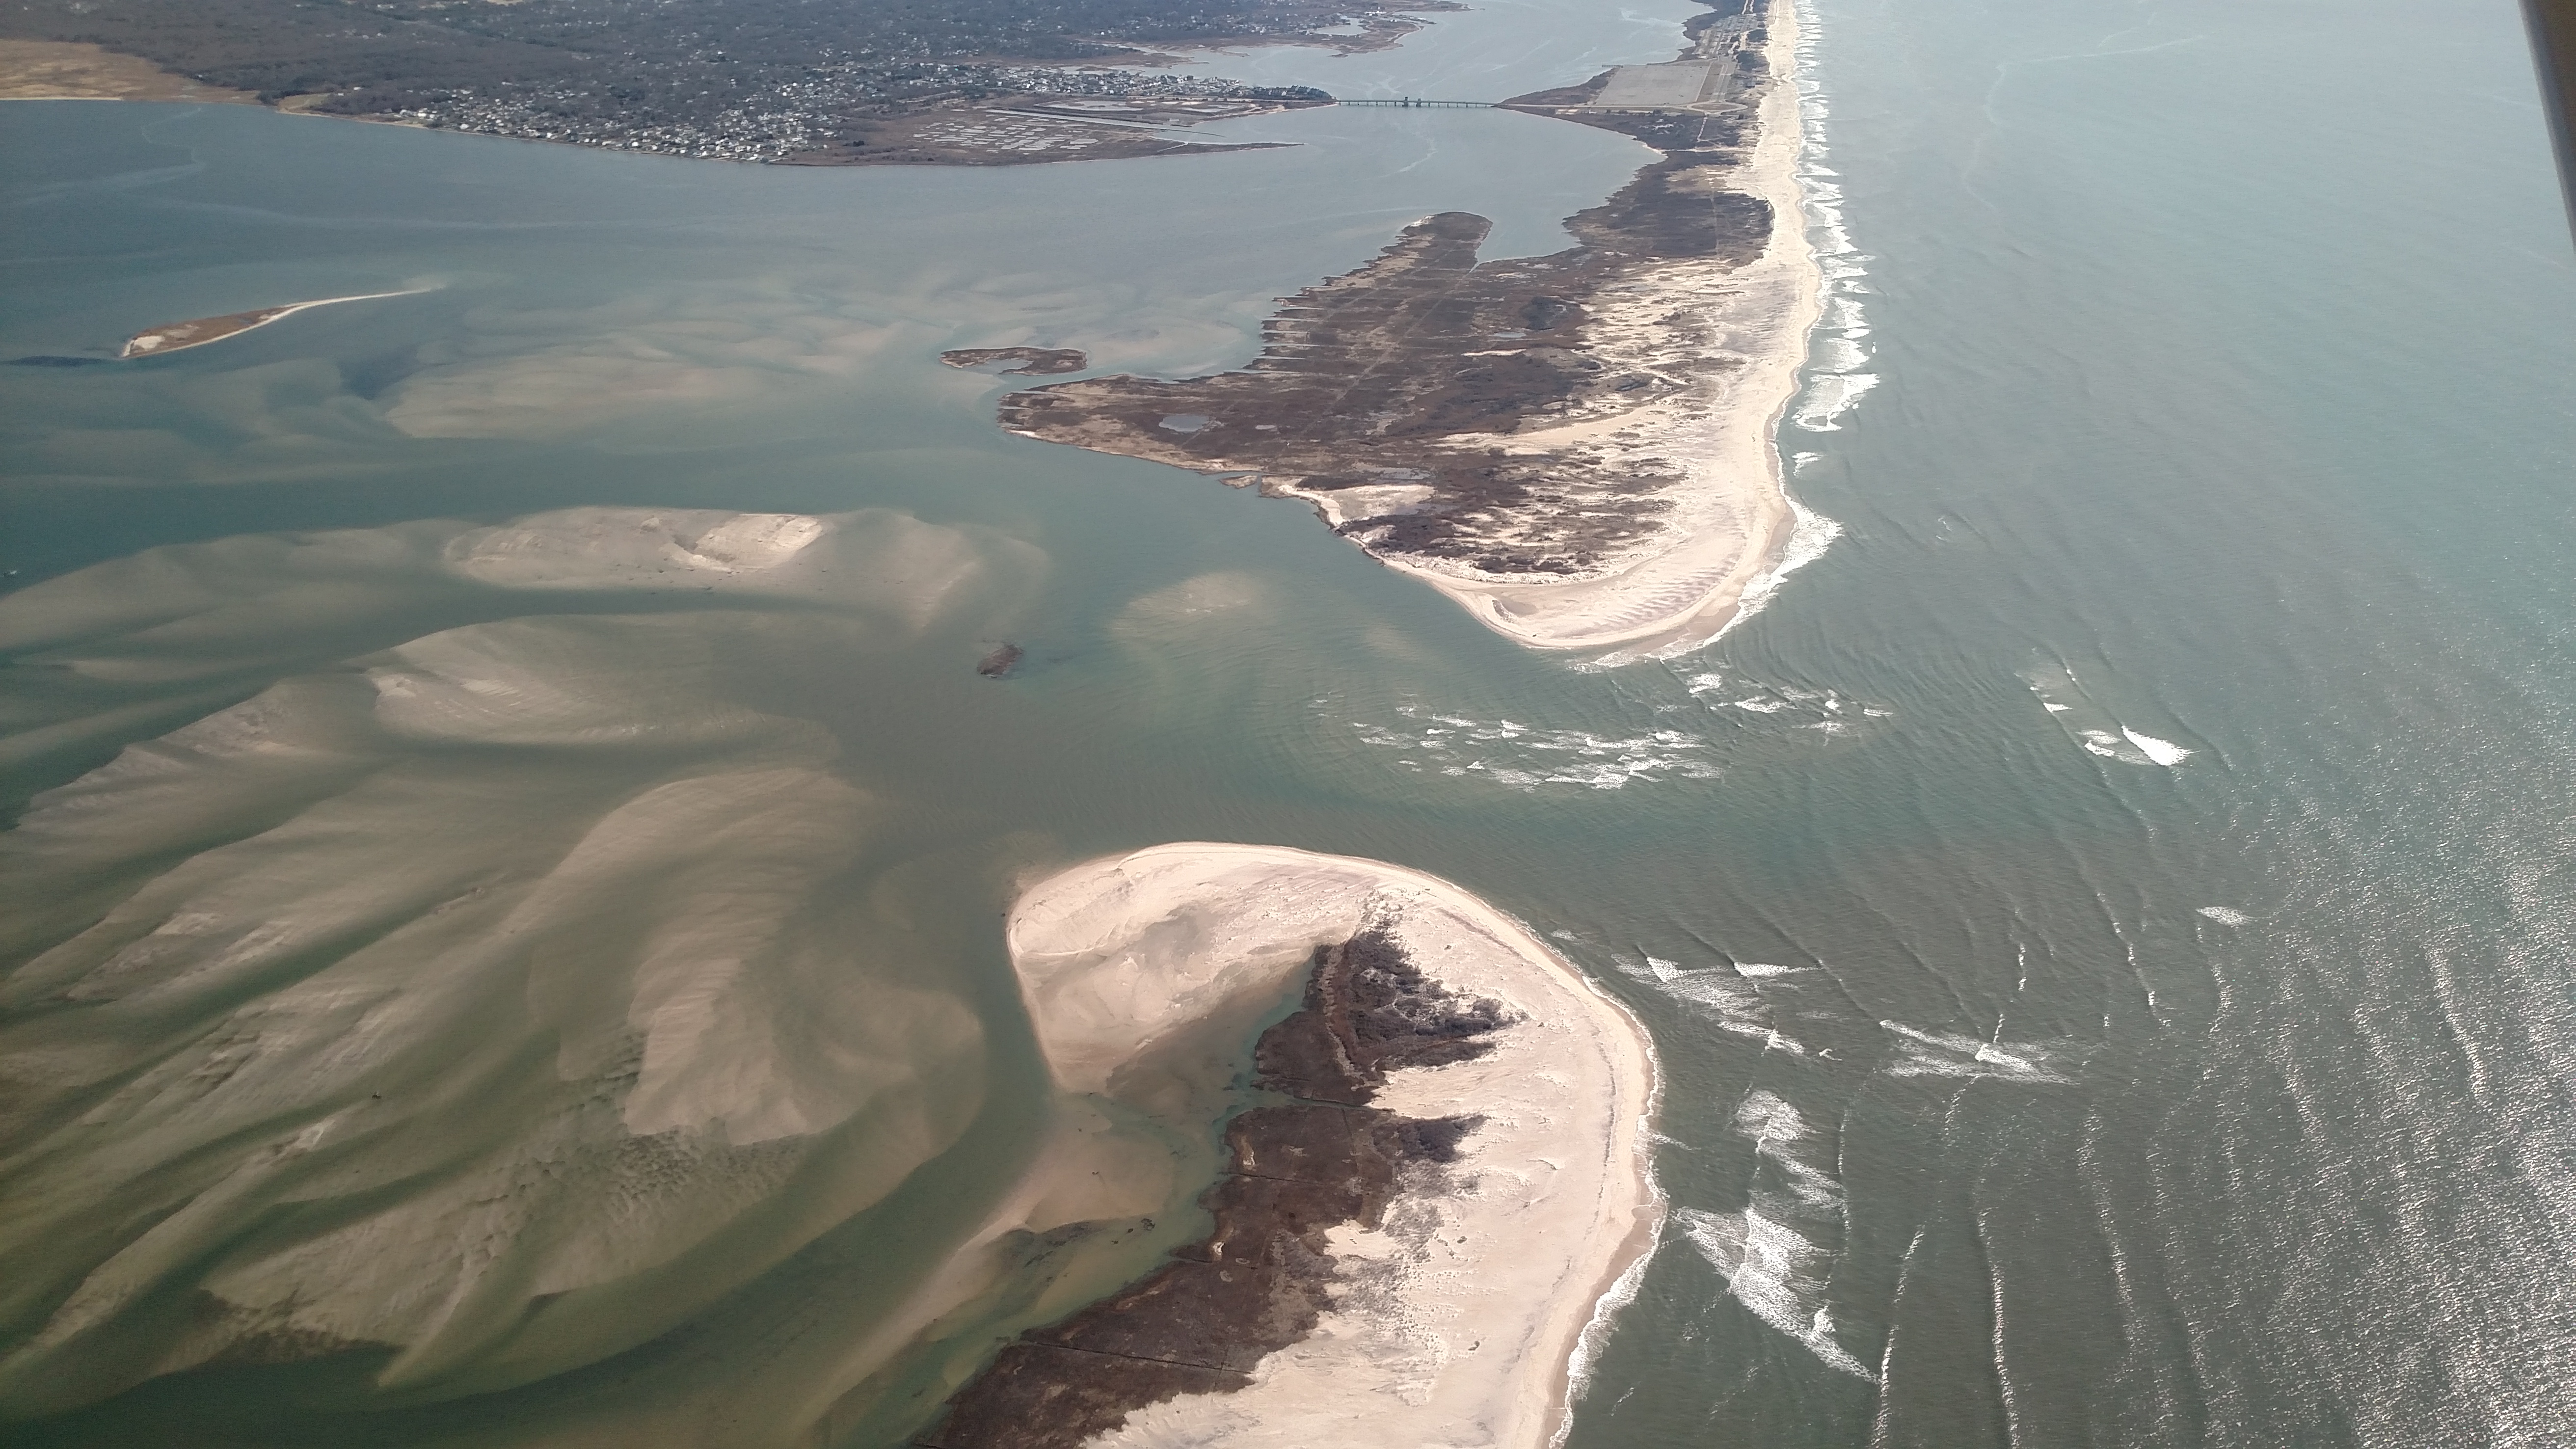 |
May 10, 2017 (CF)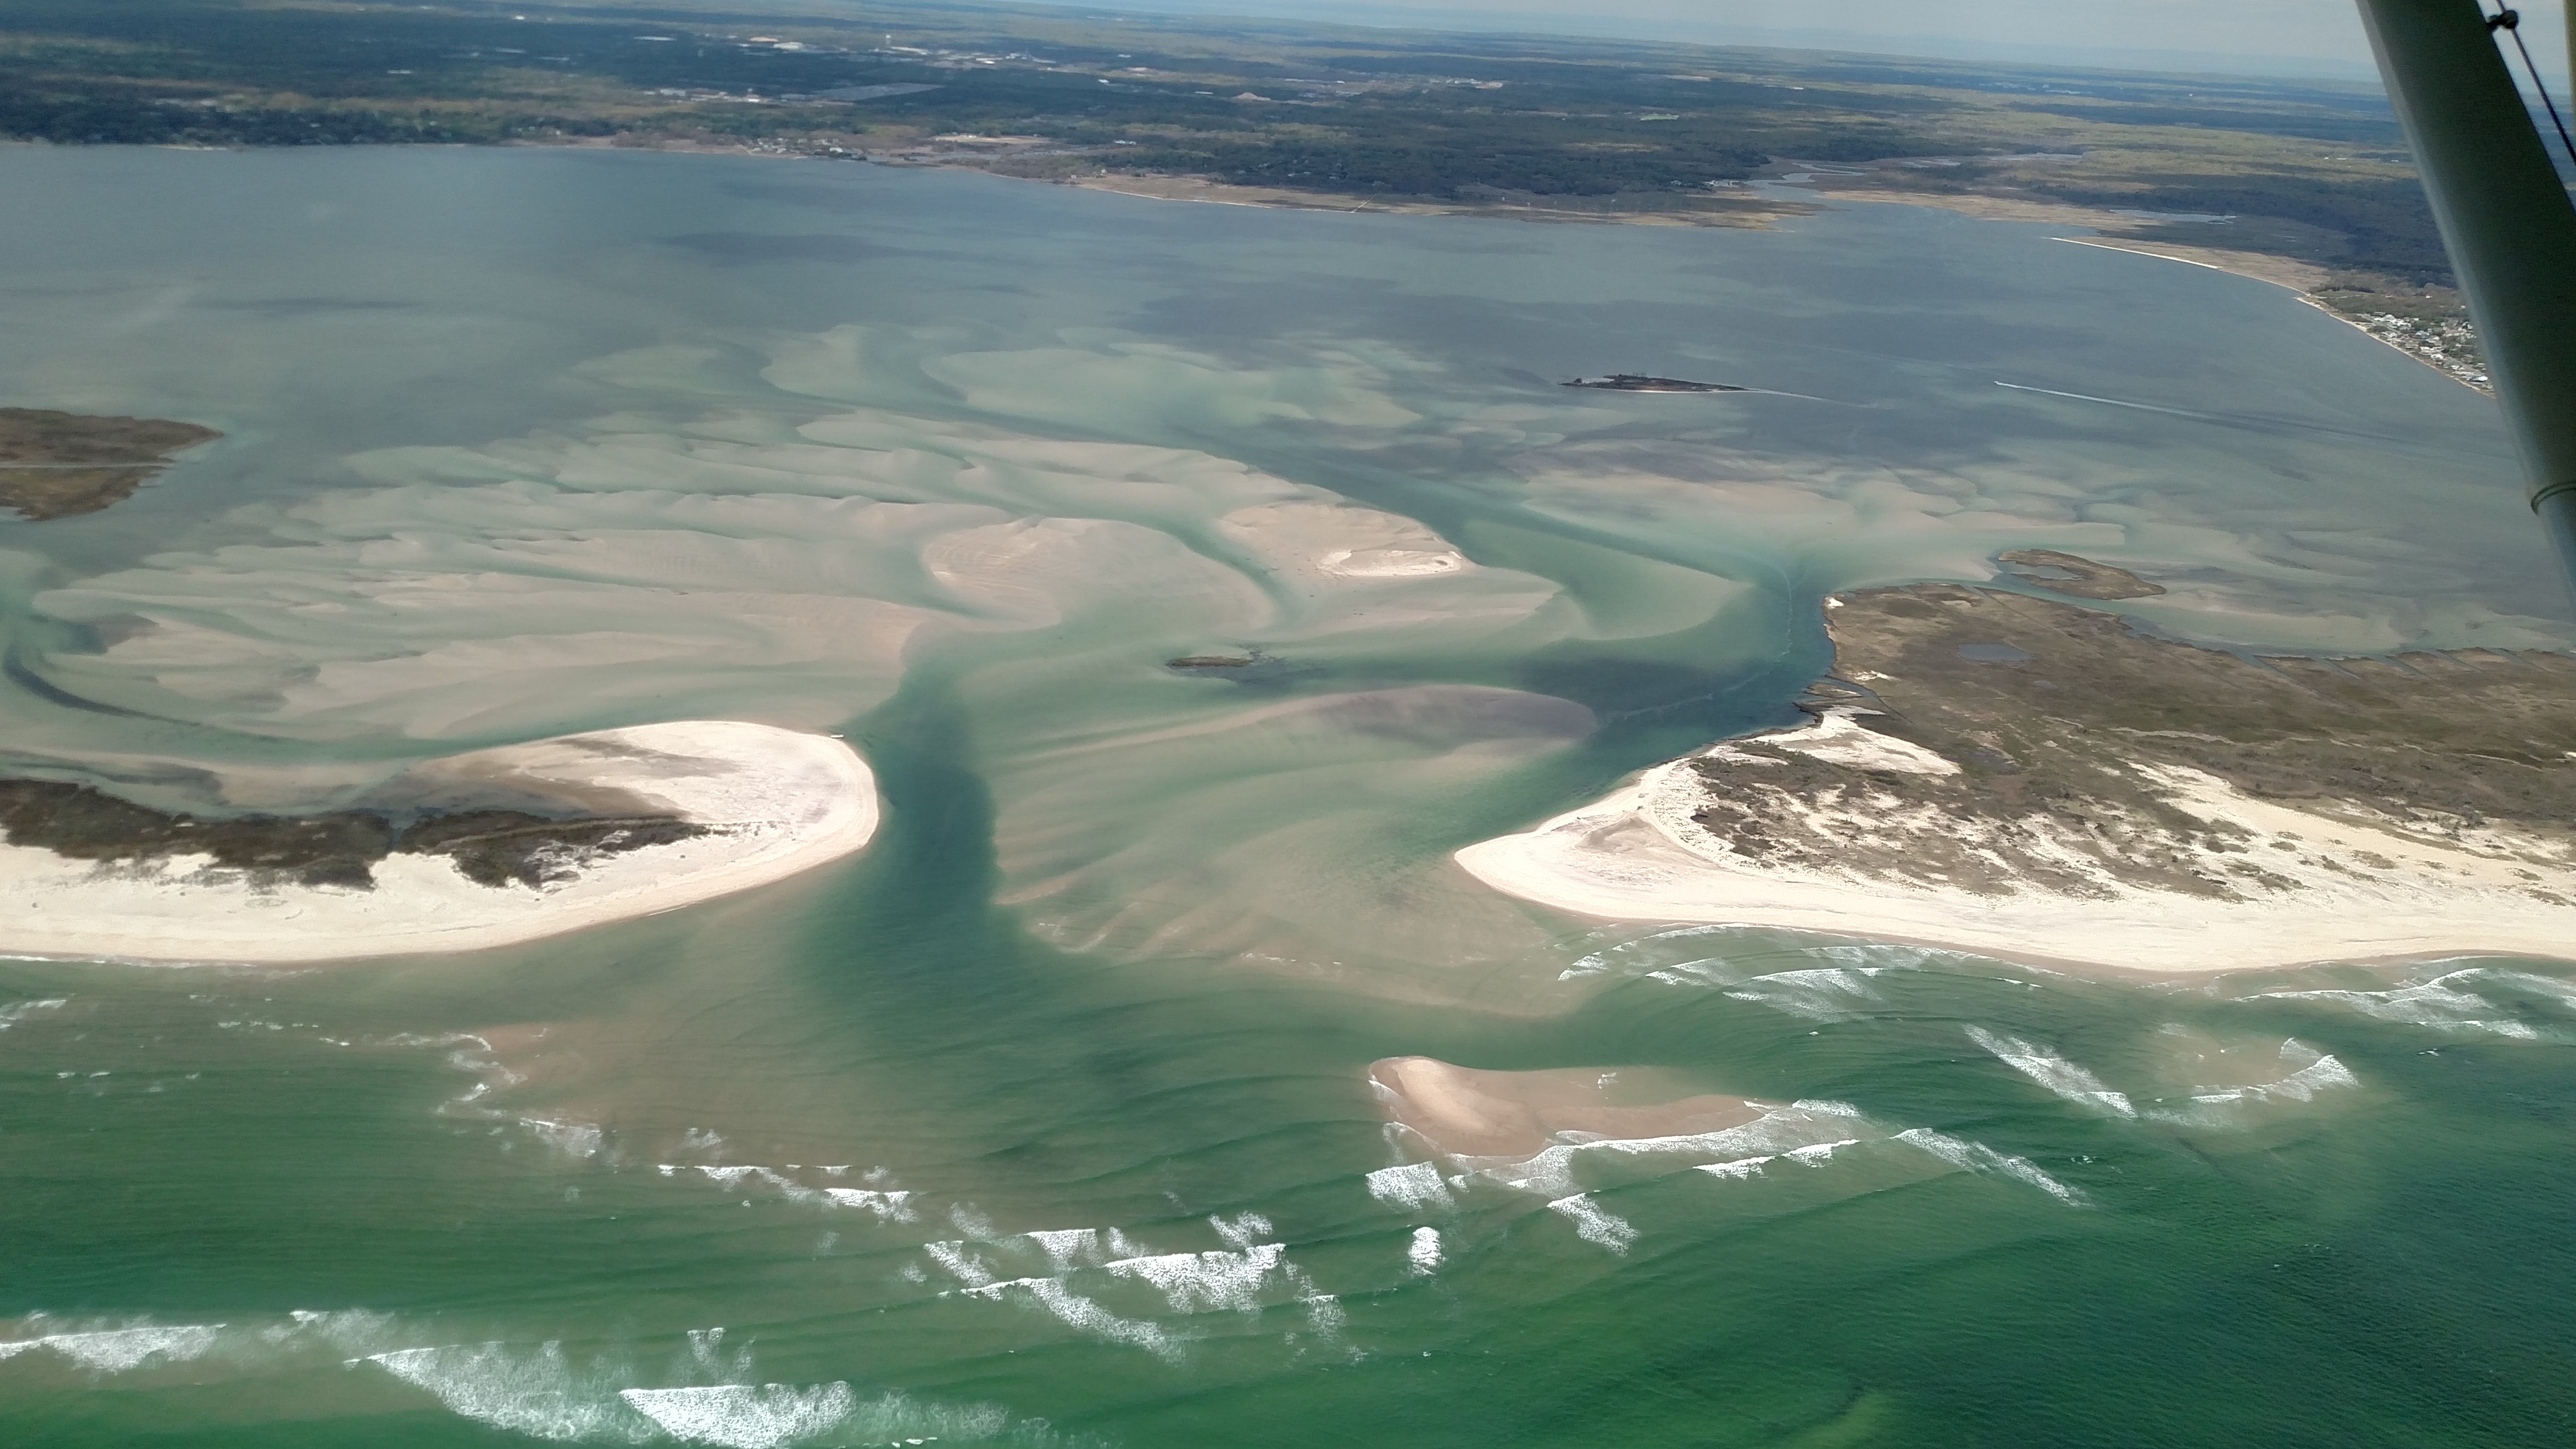 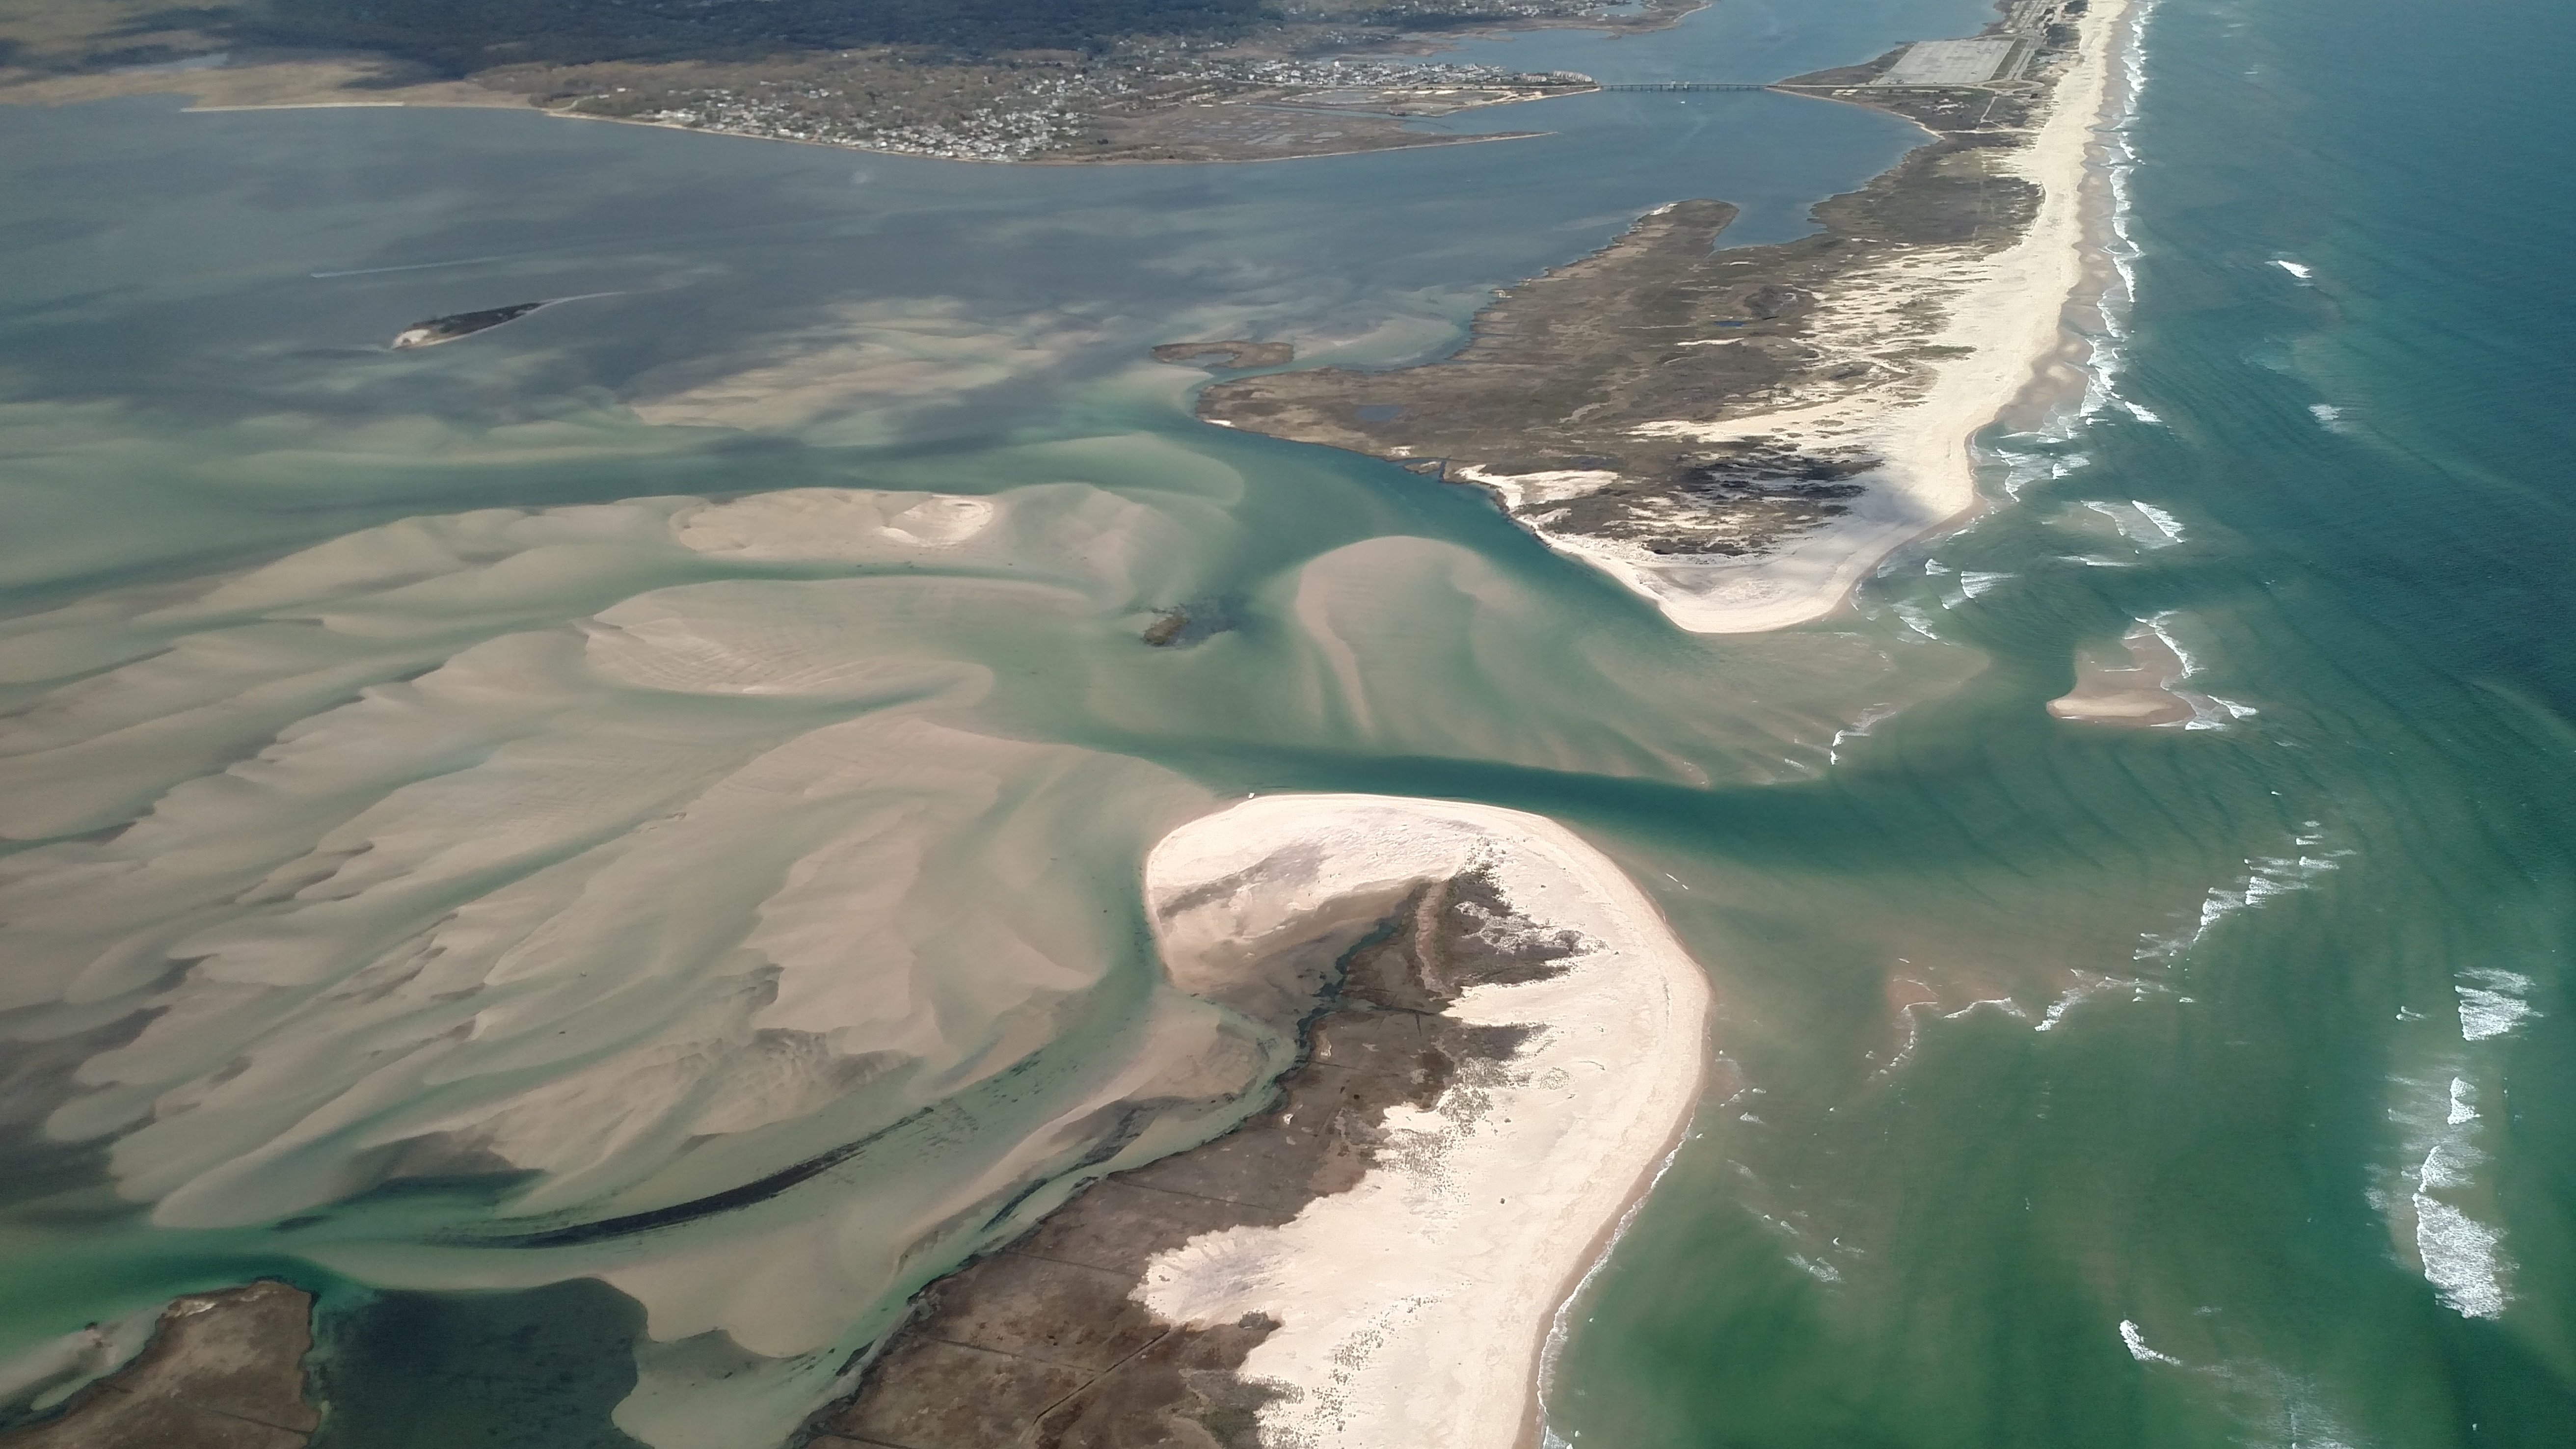 |
||||
June 4, 2017 (CF)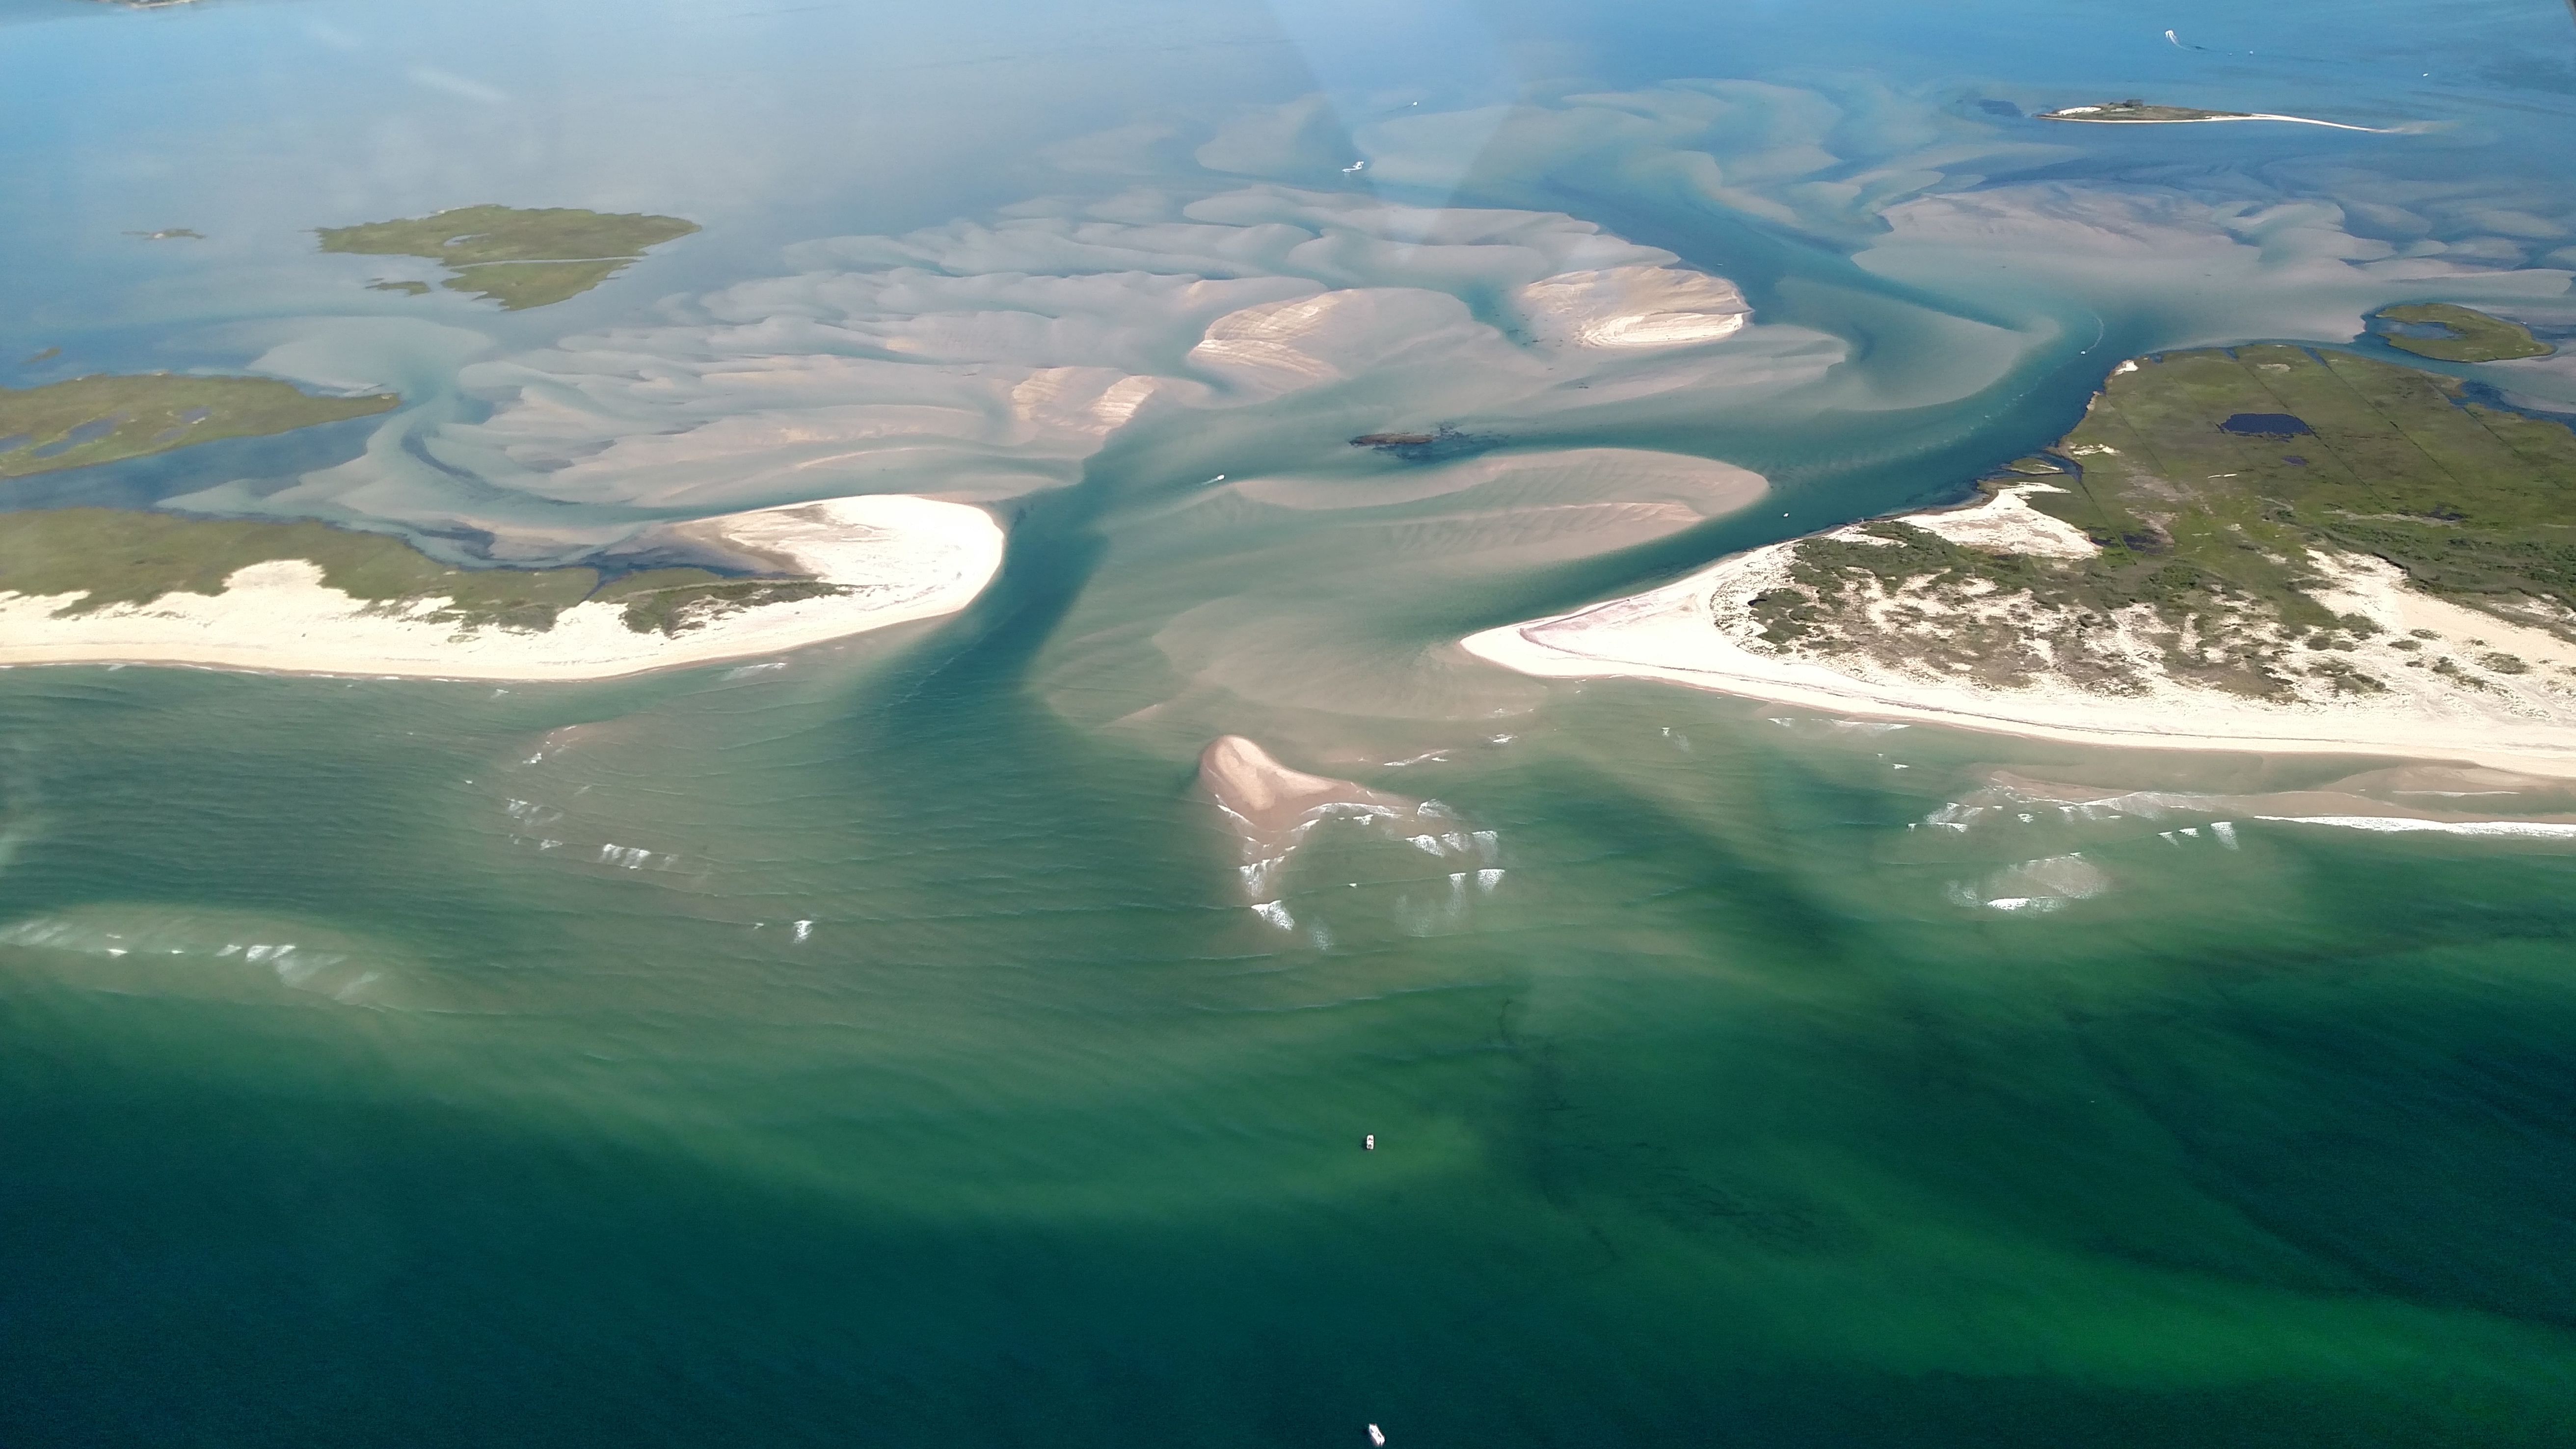 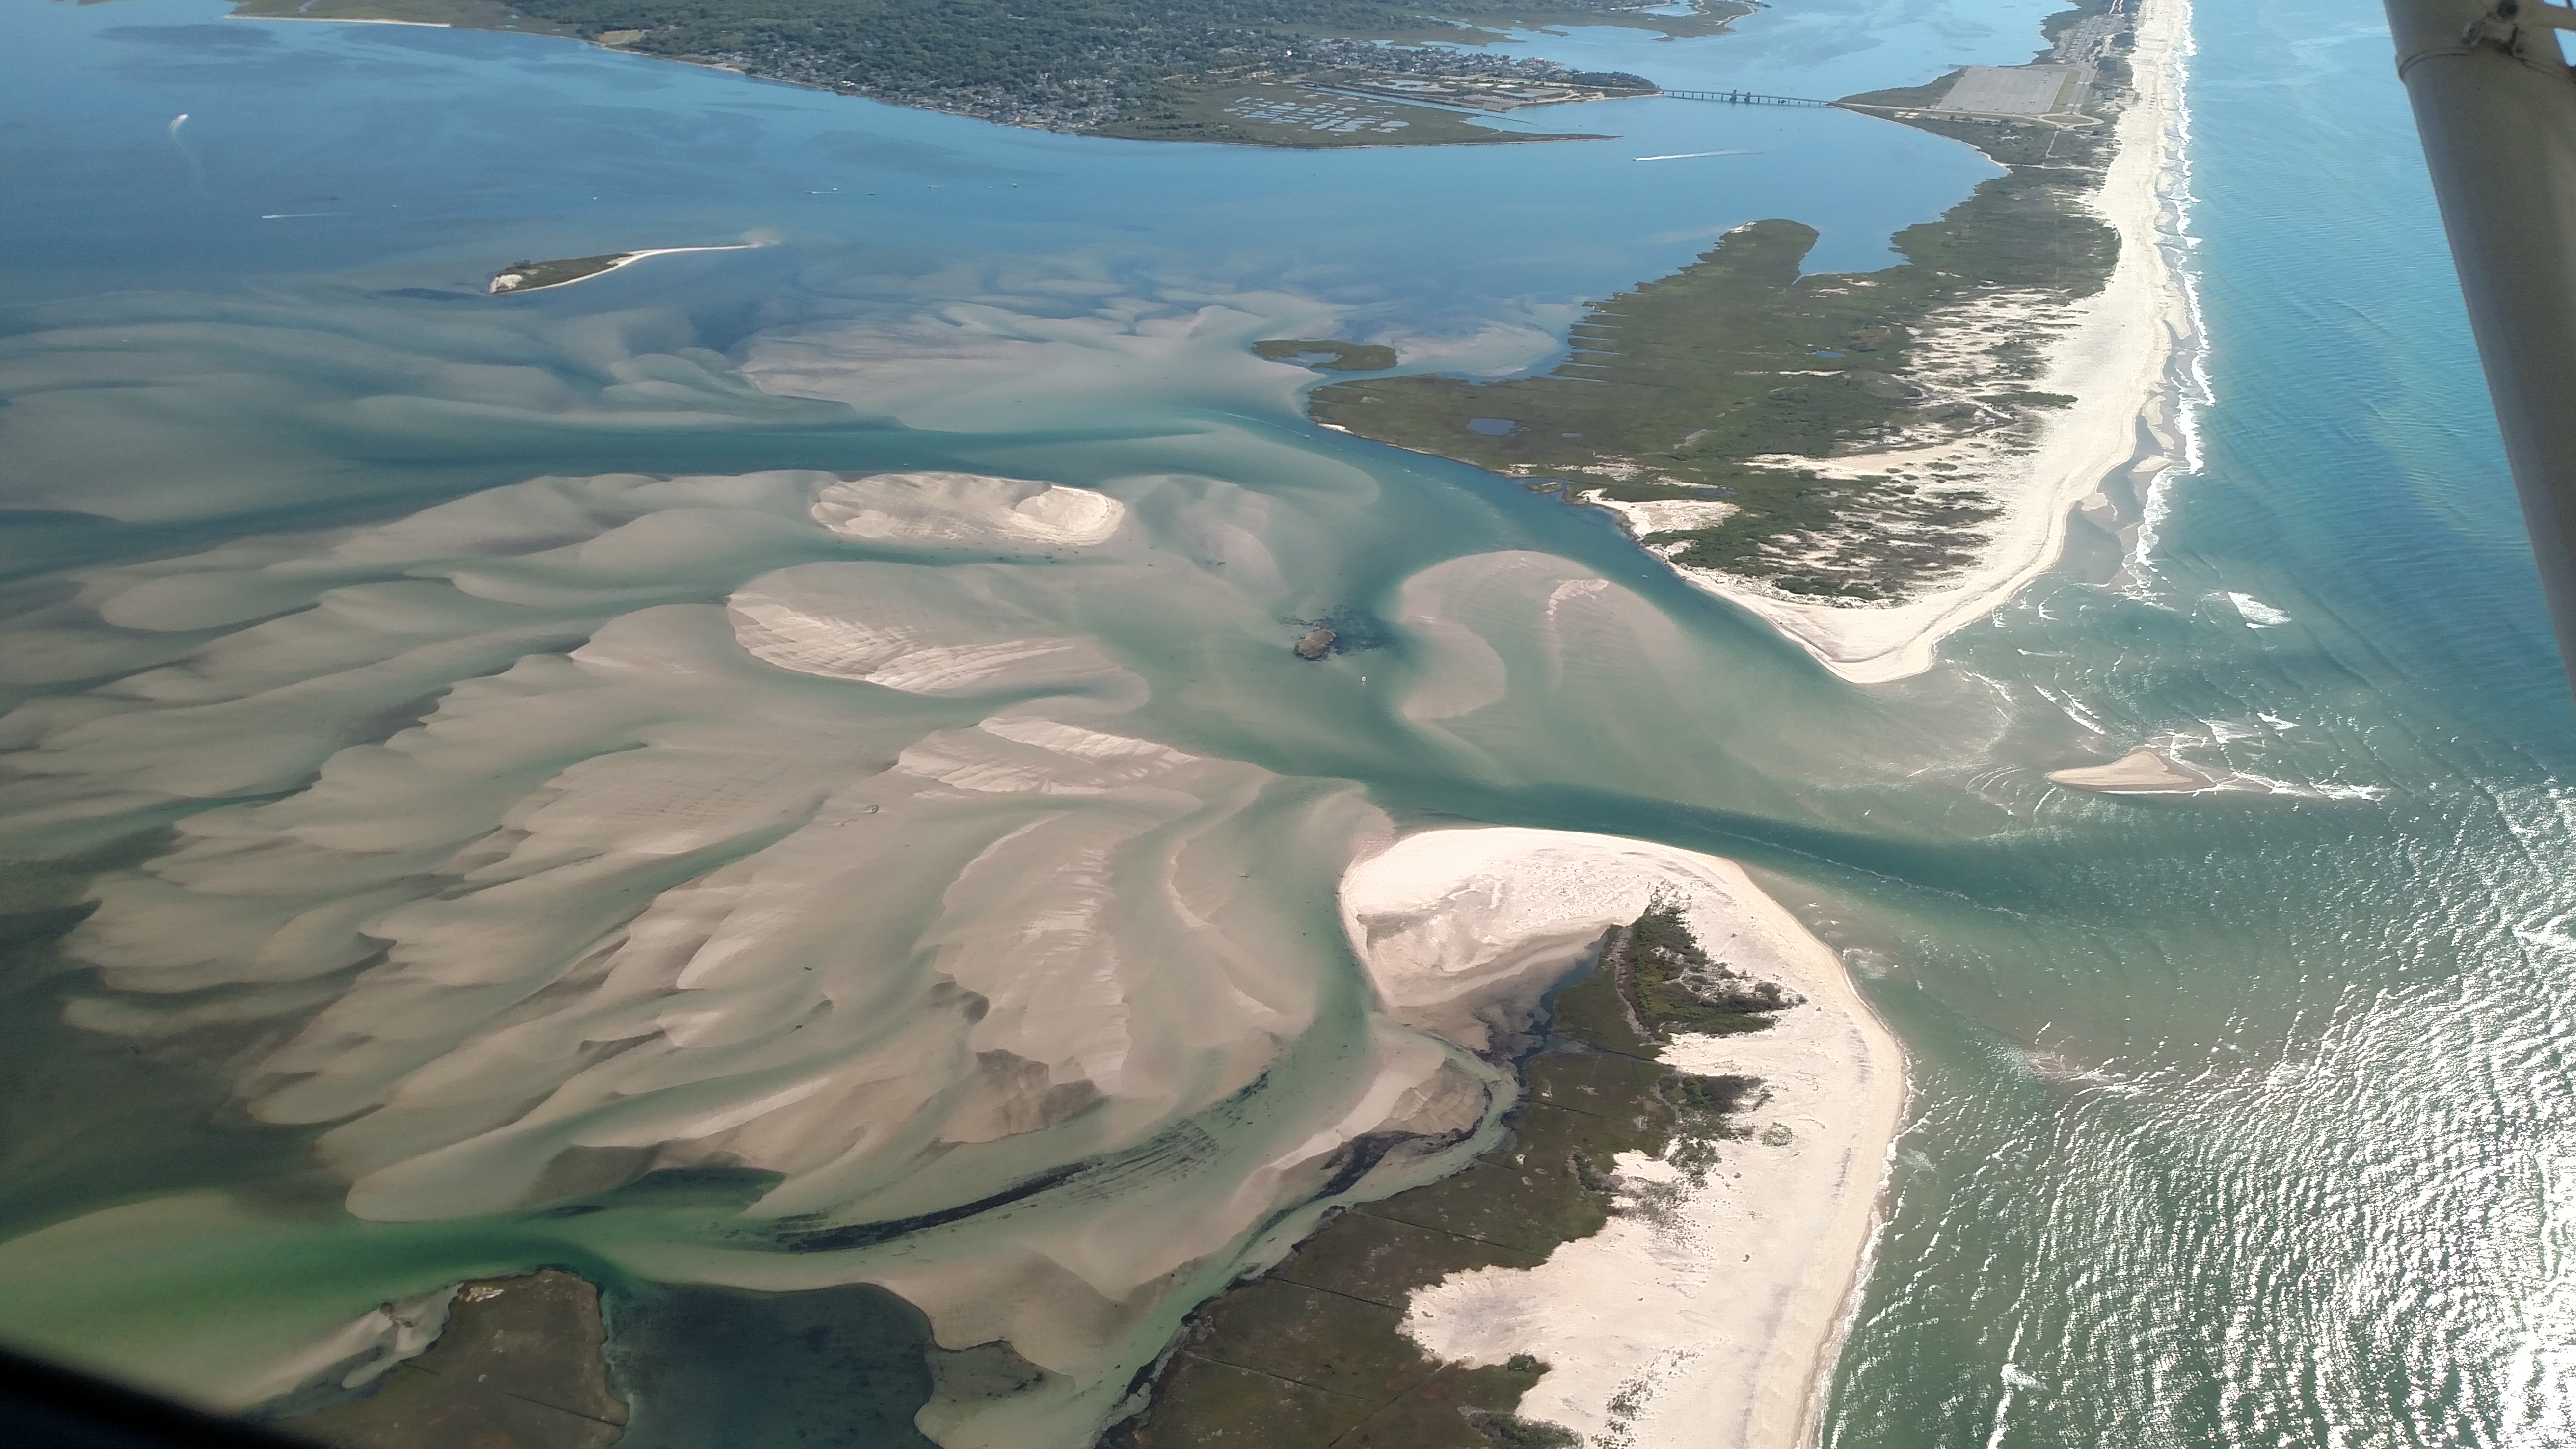 |
June 11, 2017 (CF&JF)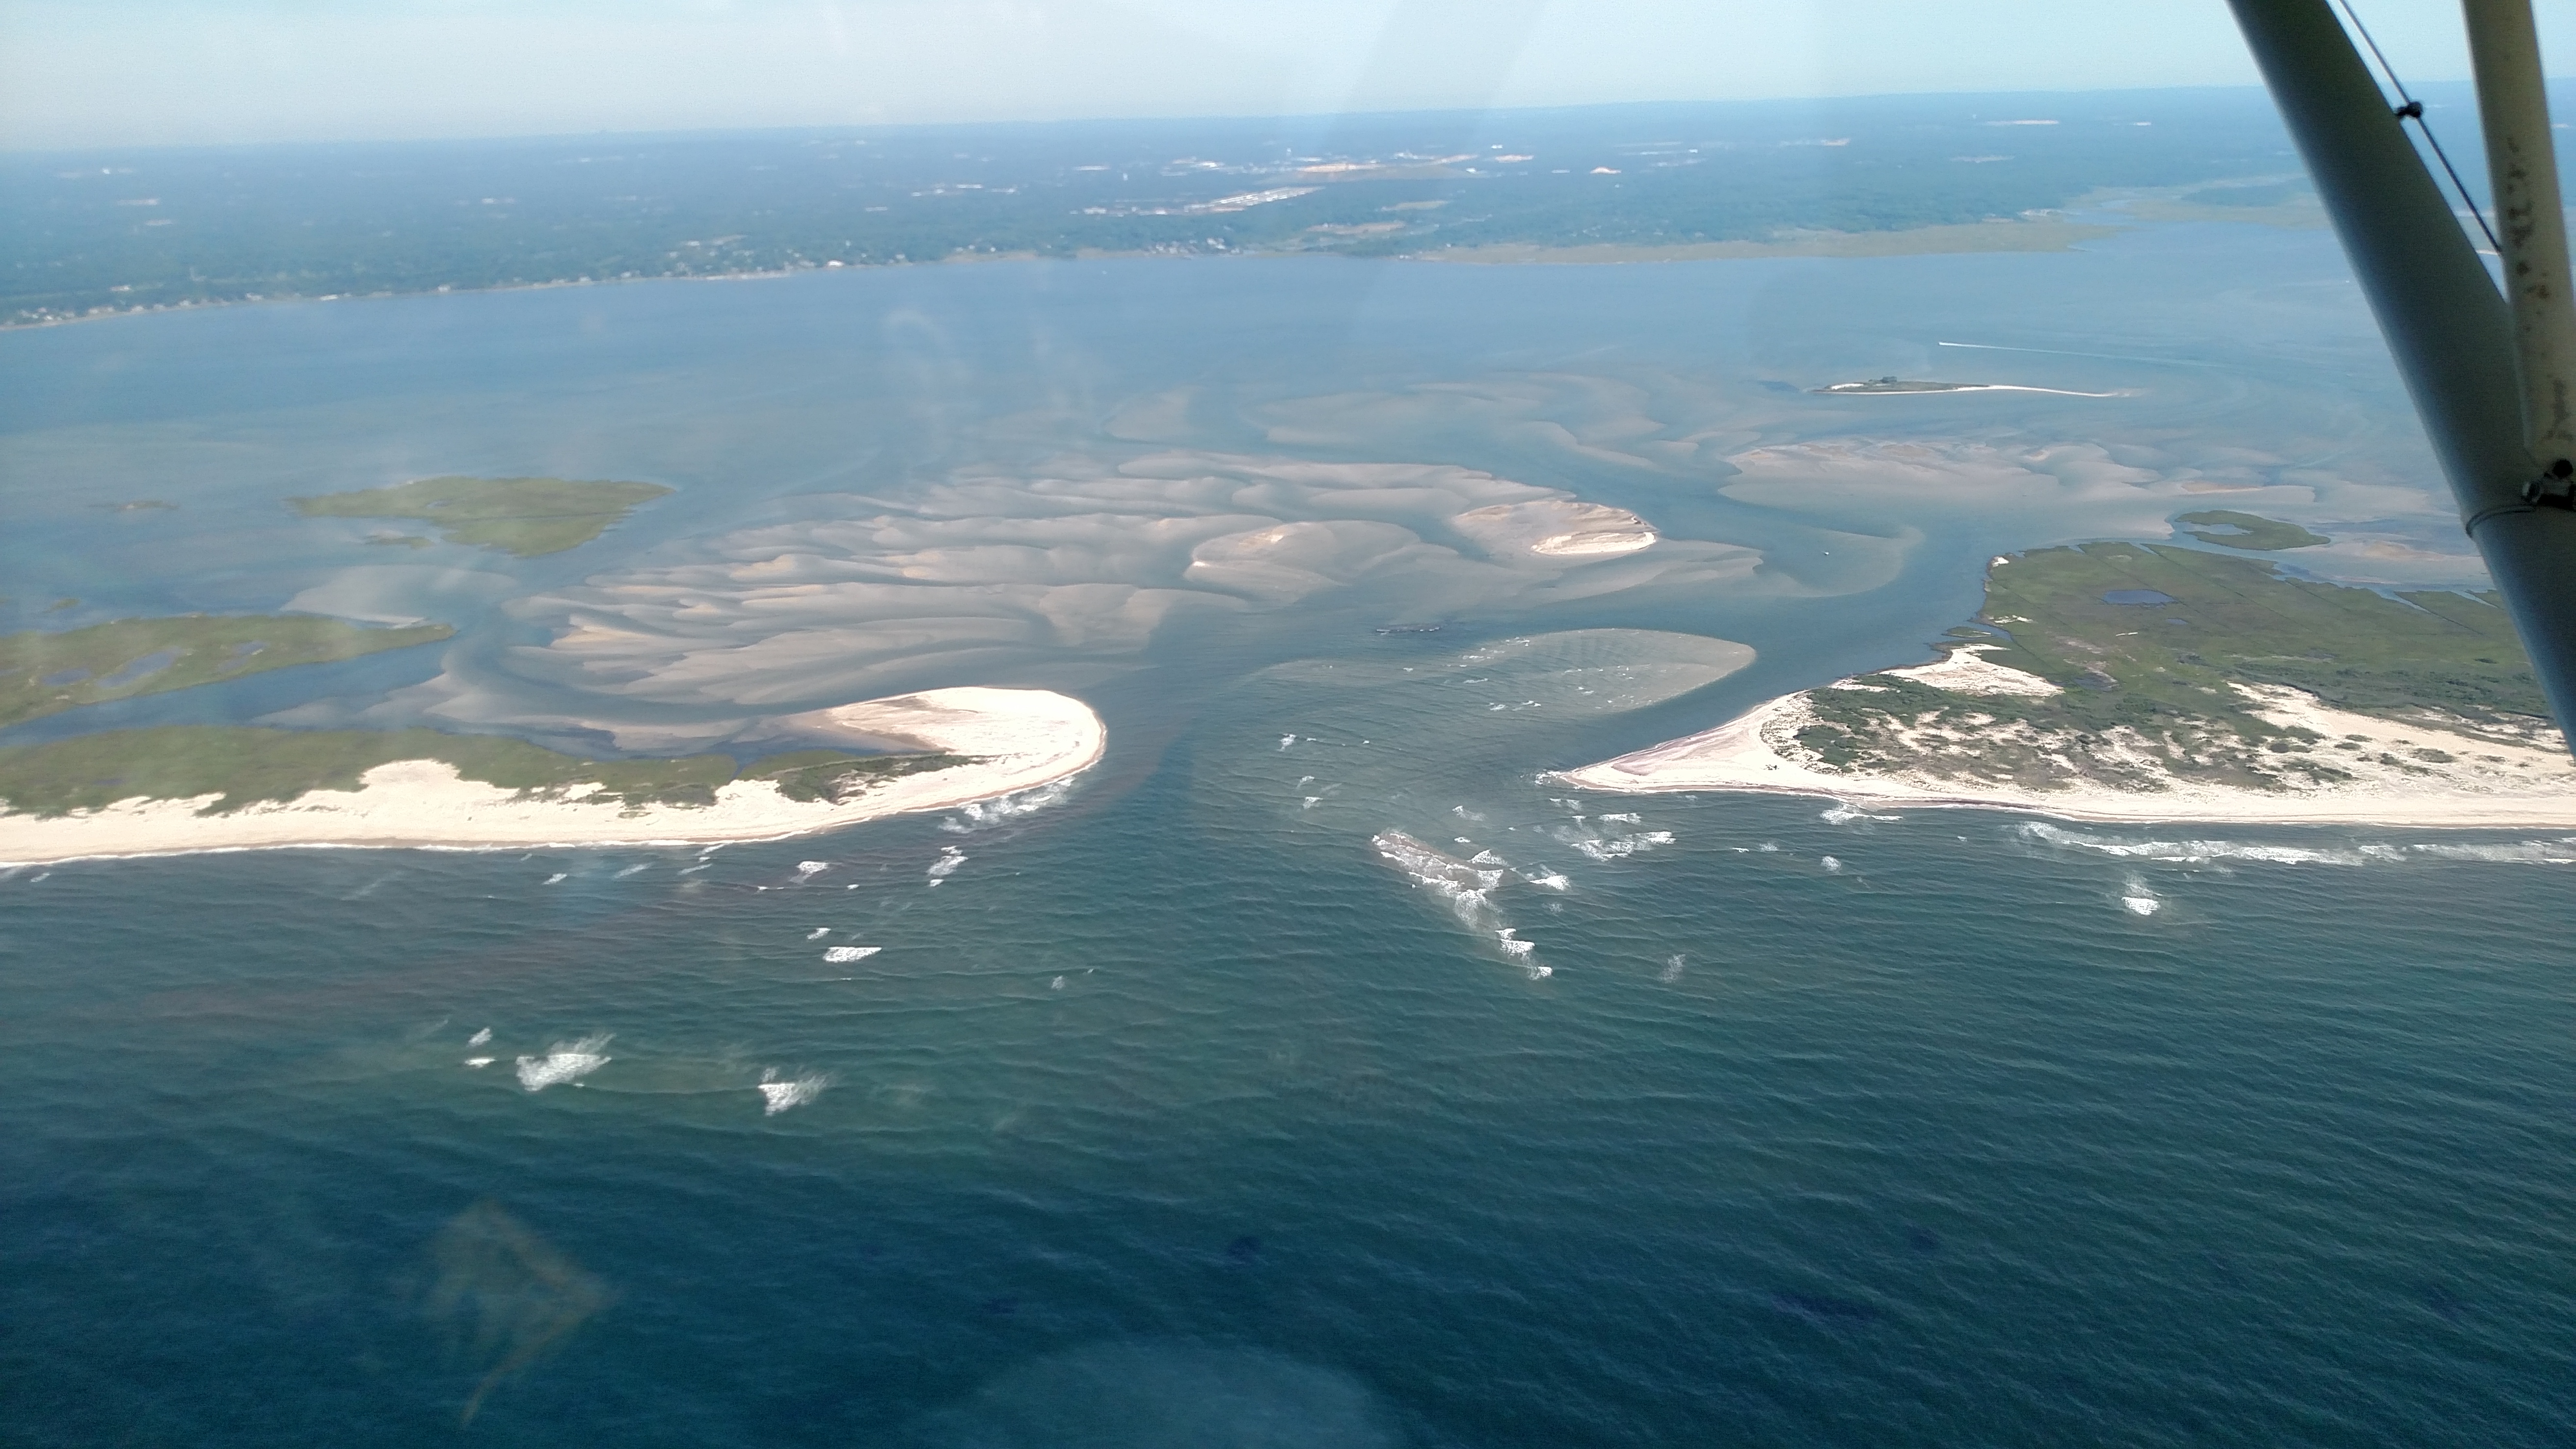 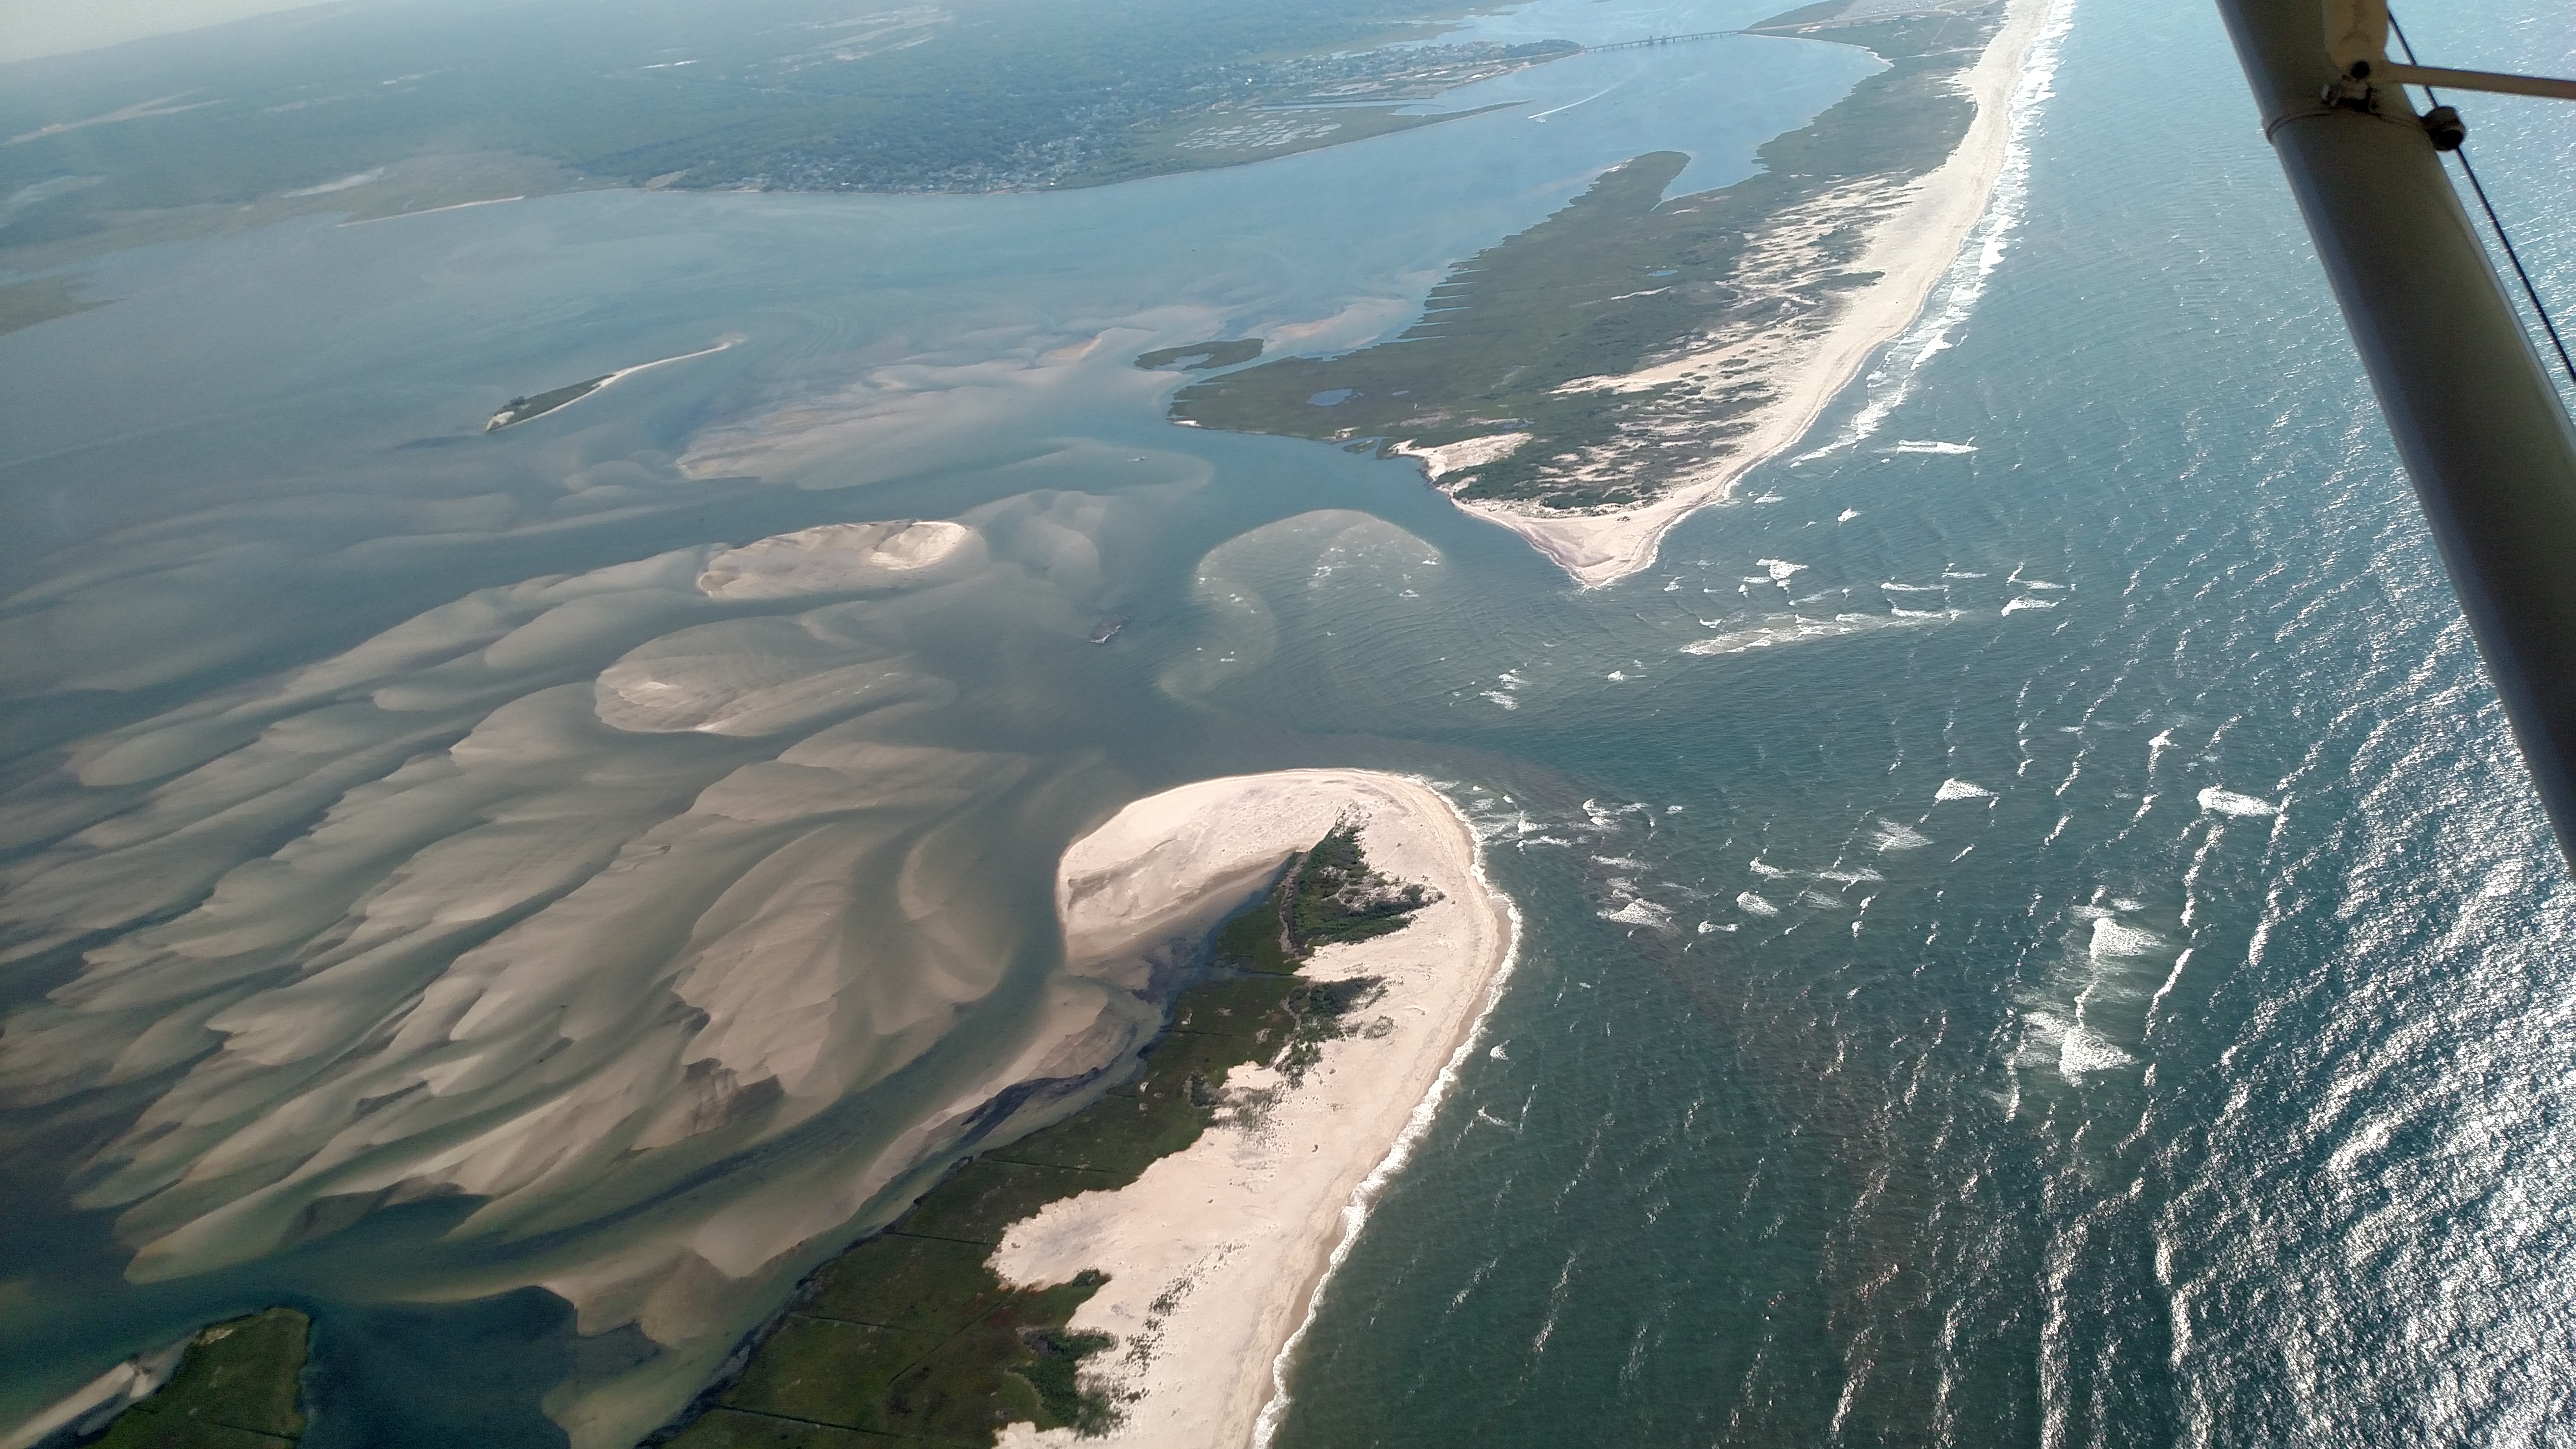 |
June 22, 2017 (CF)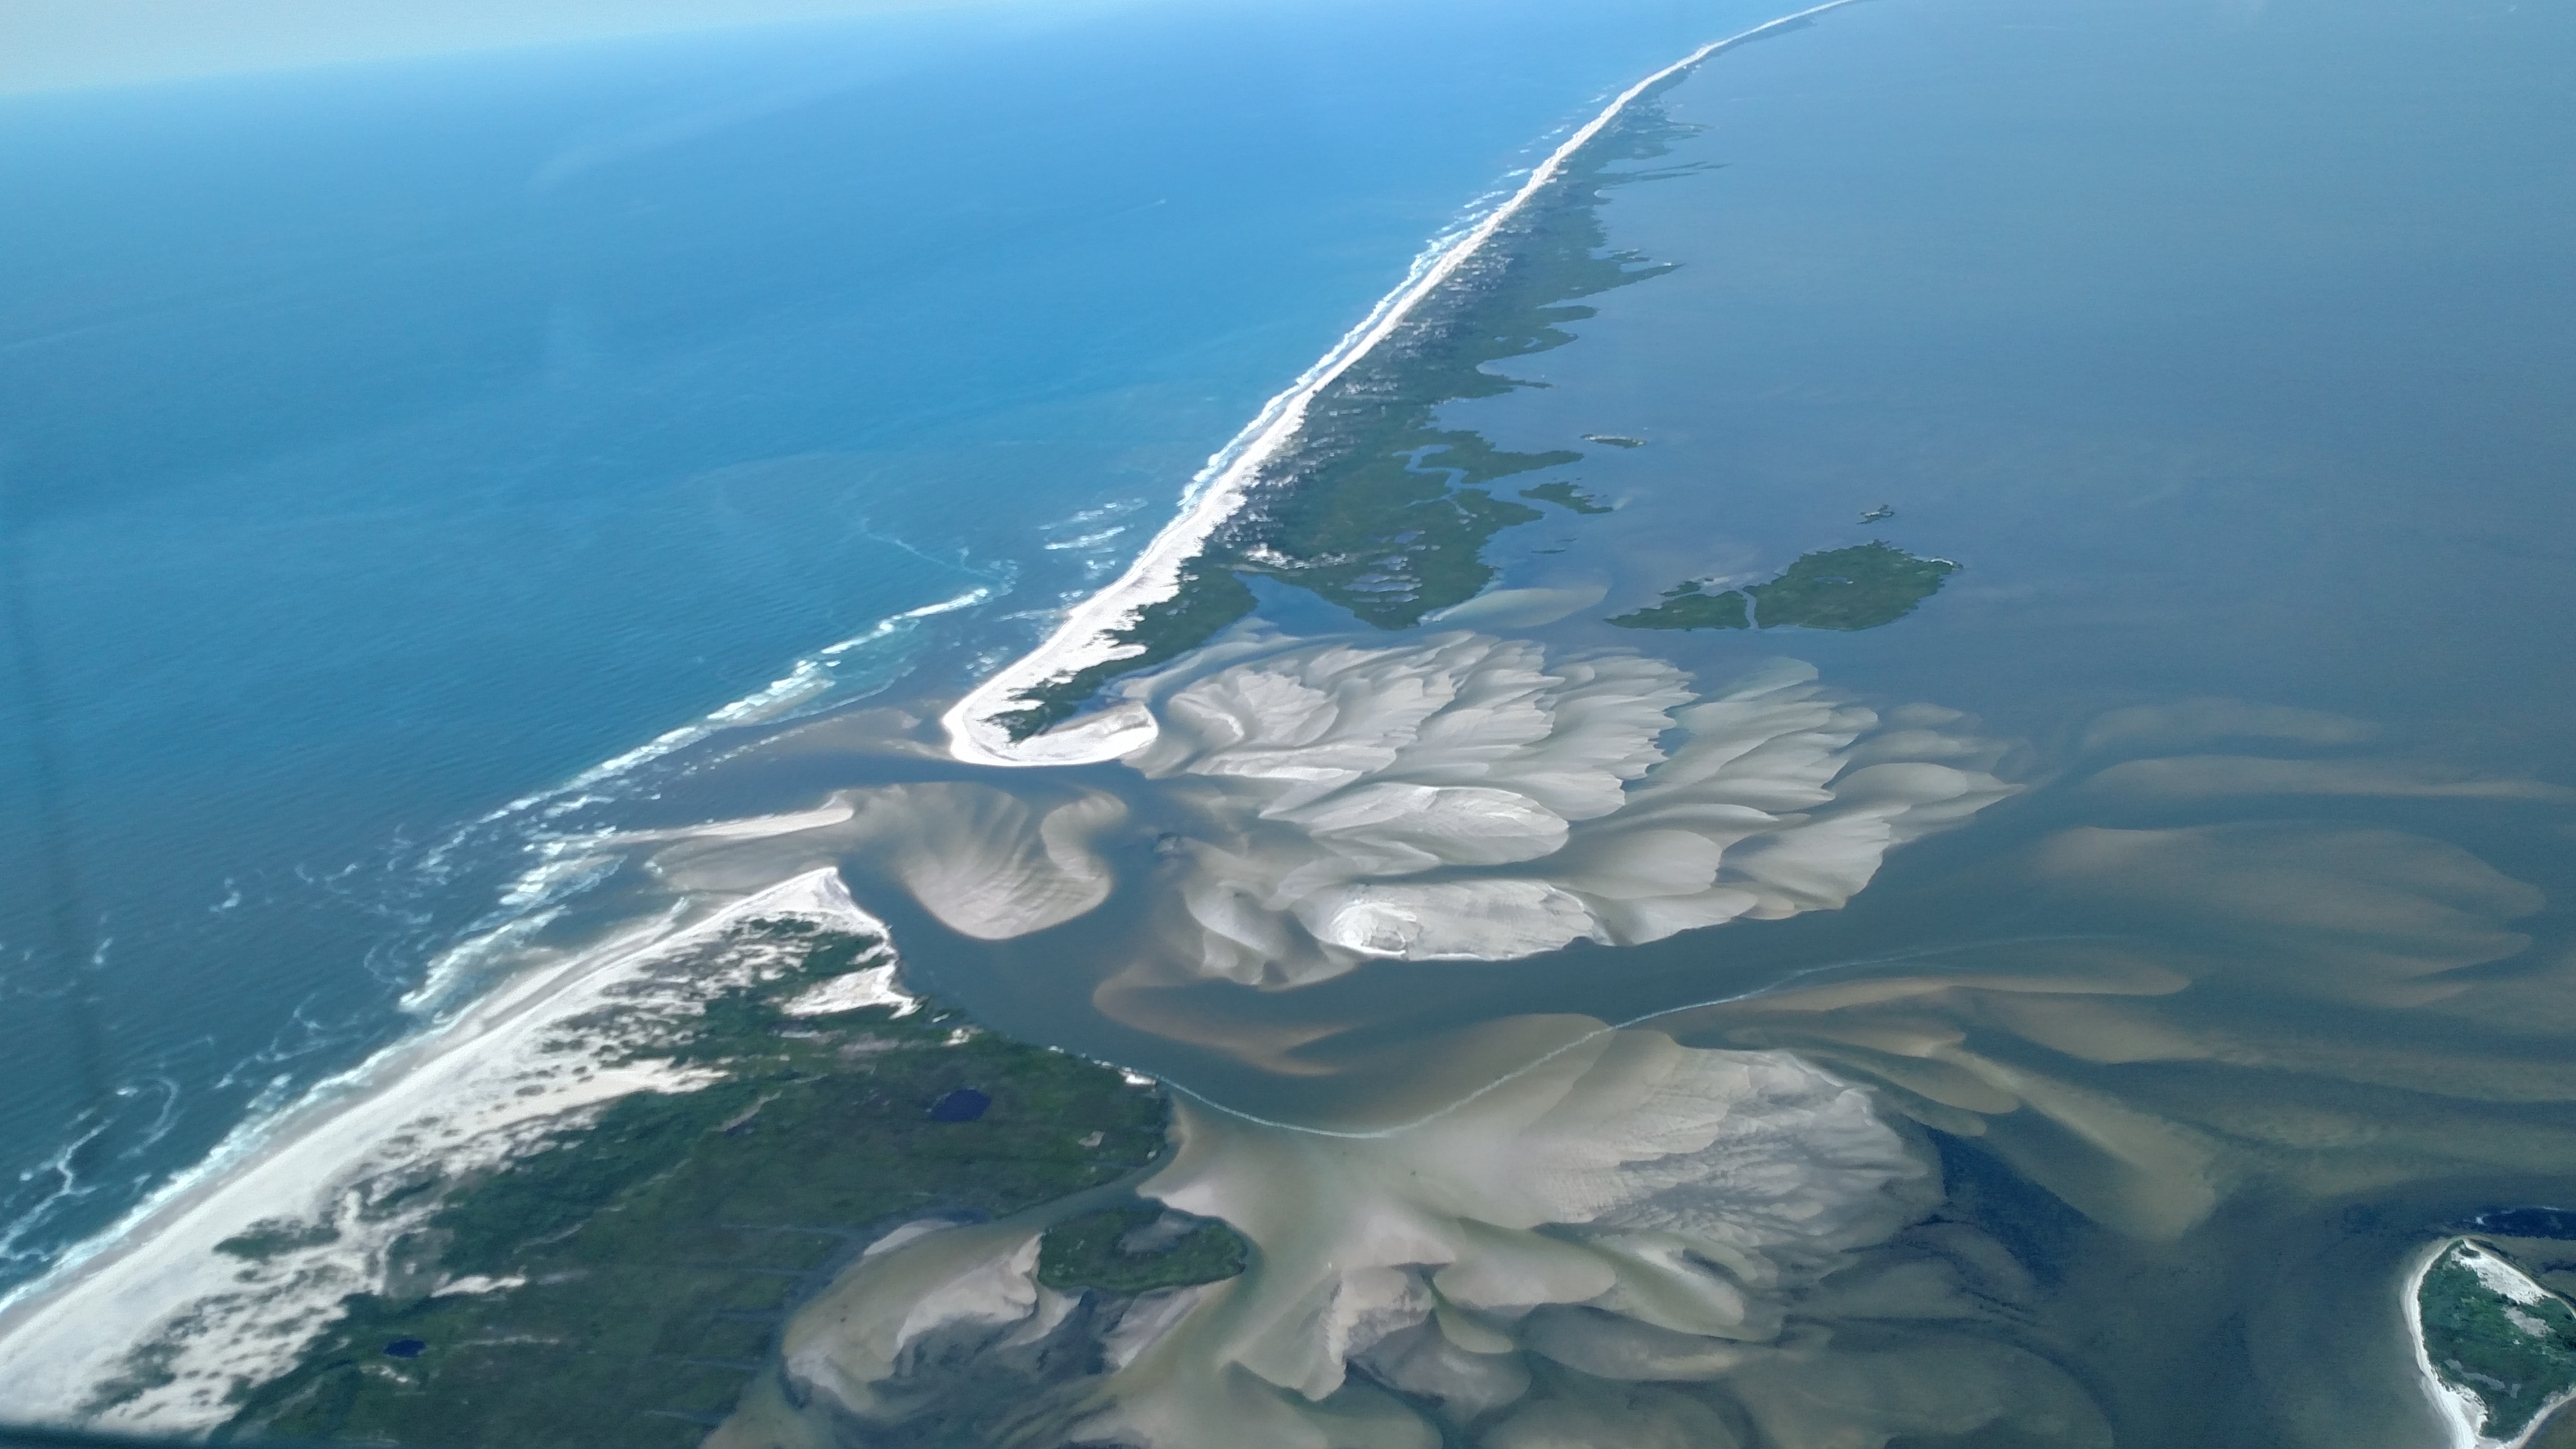 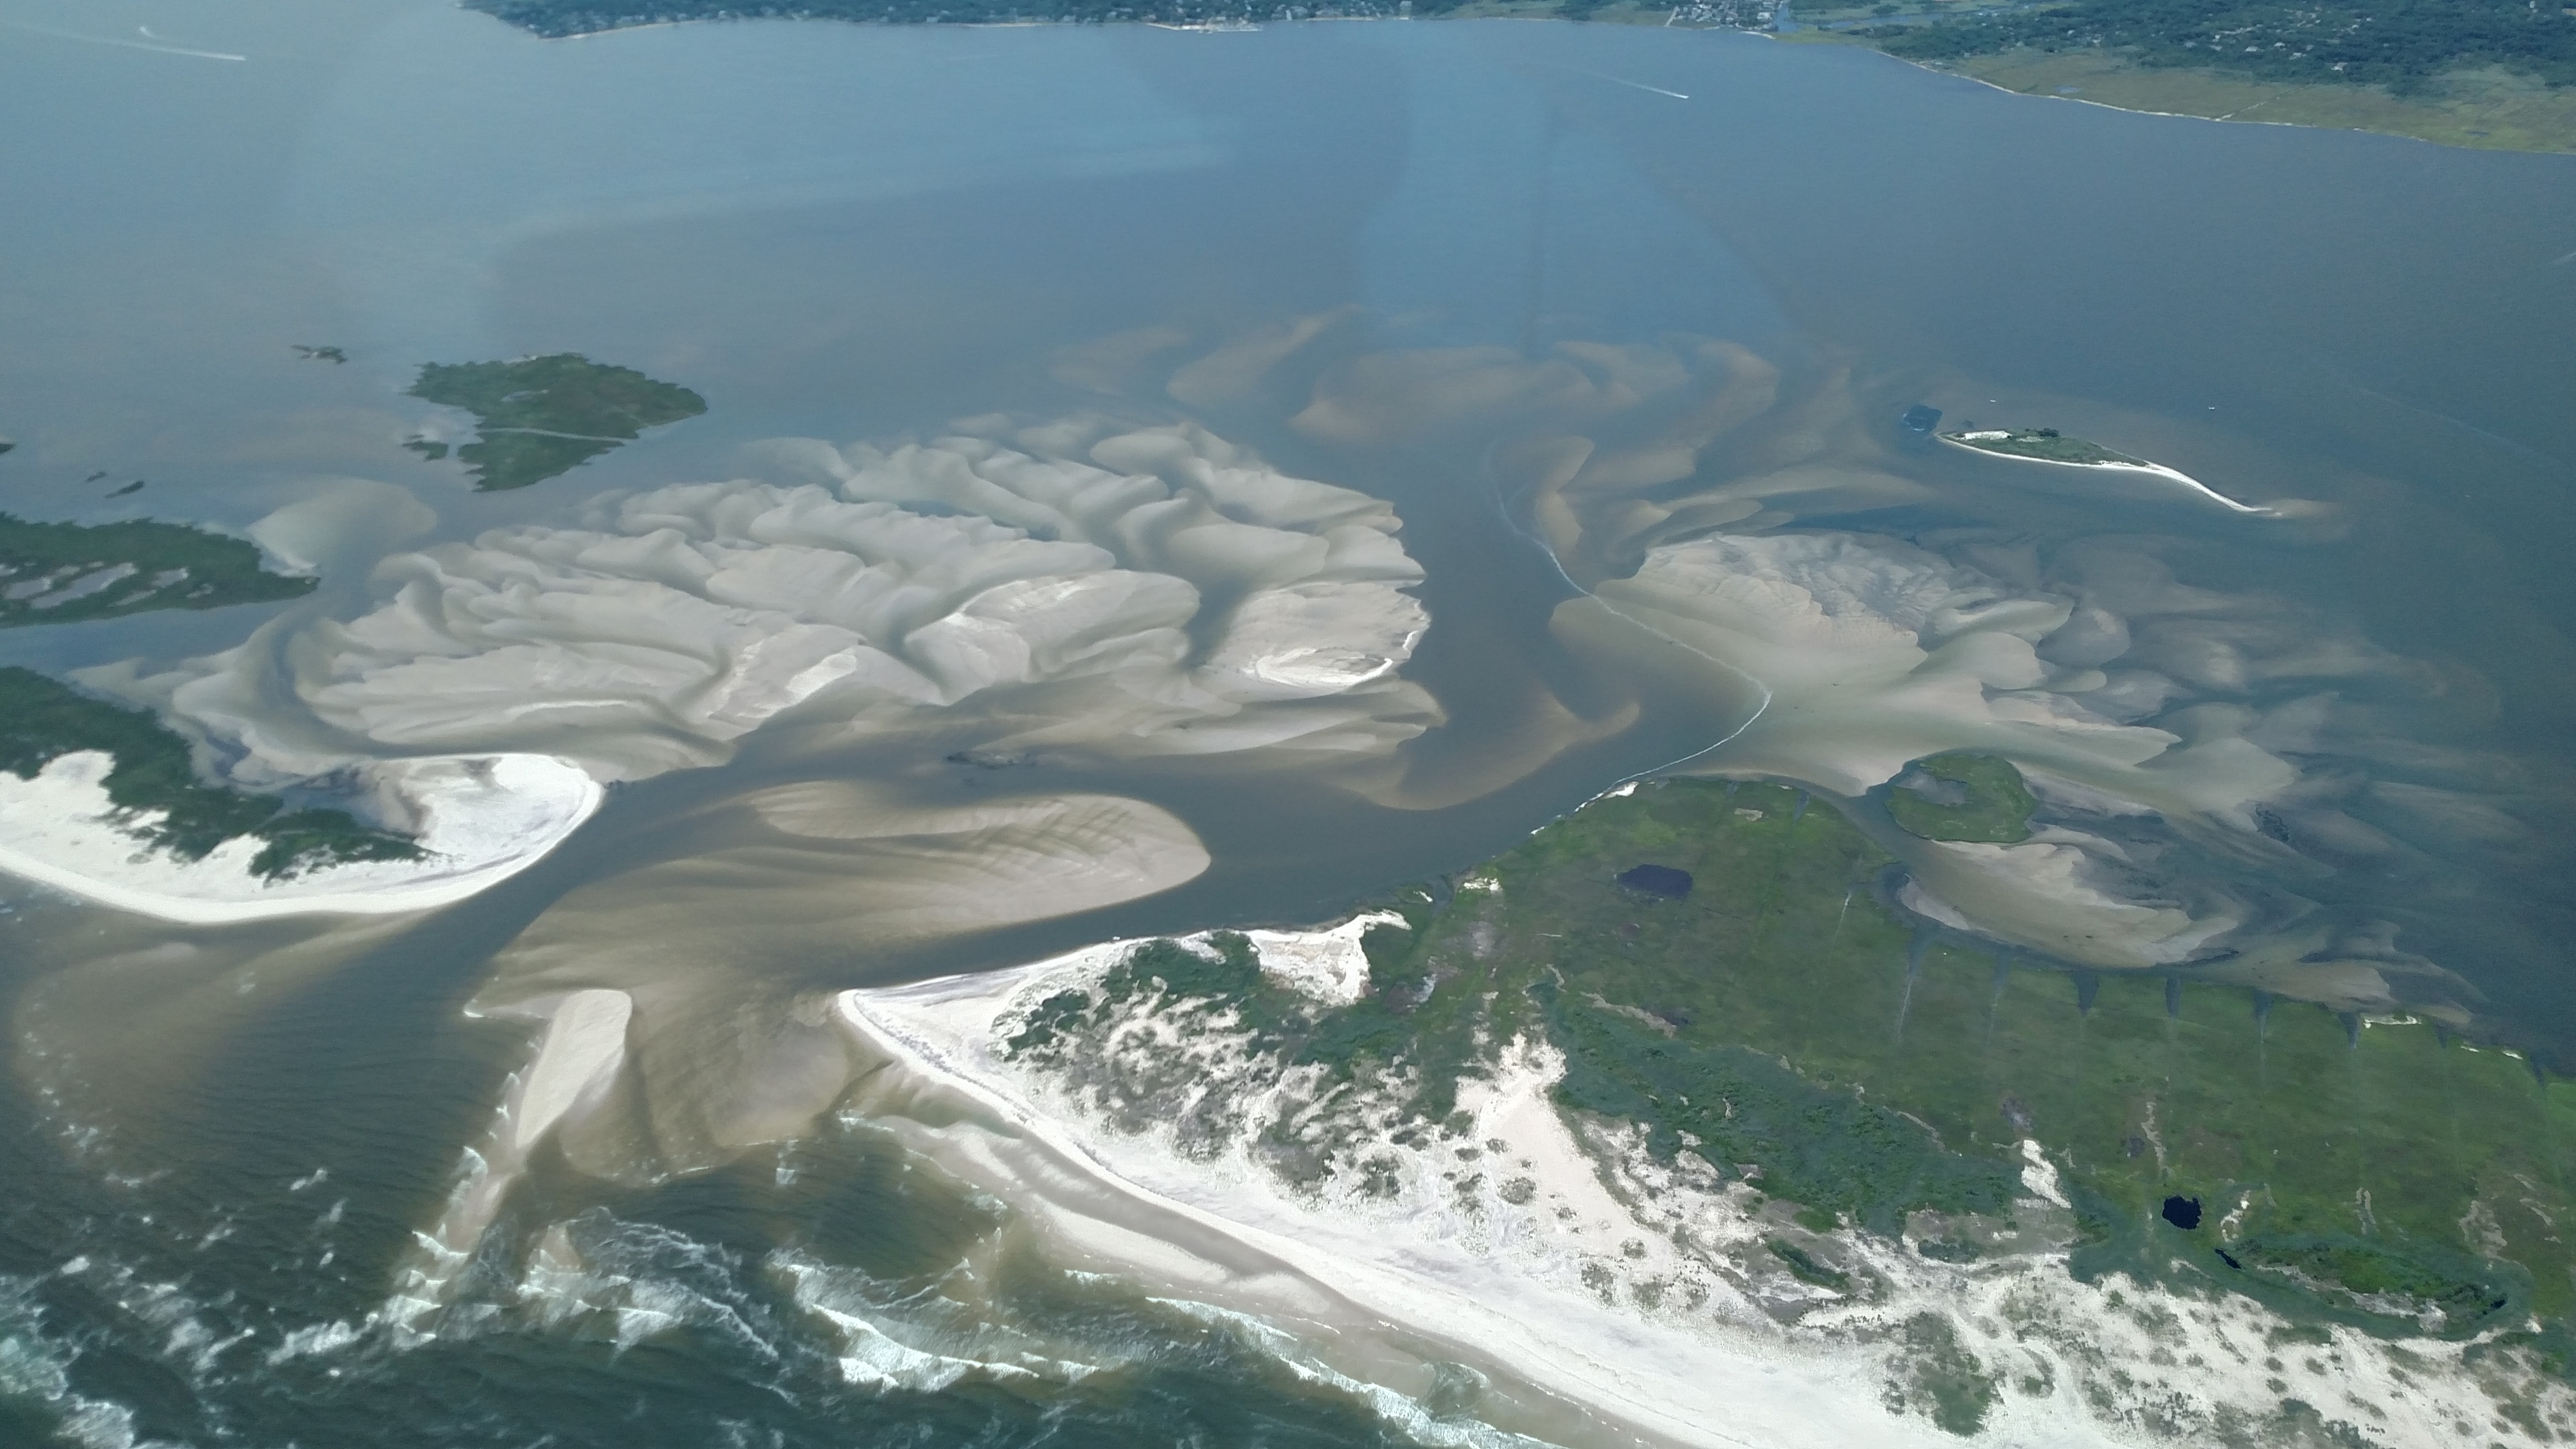 |
July 16, 2017 (CF)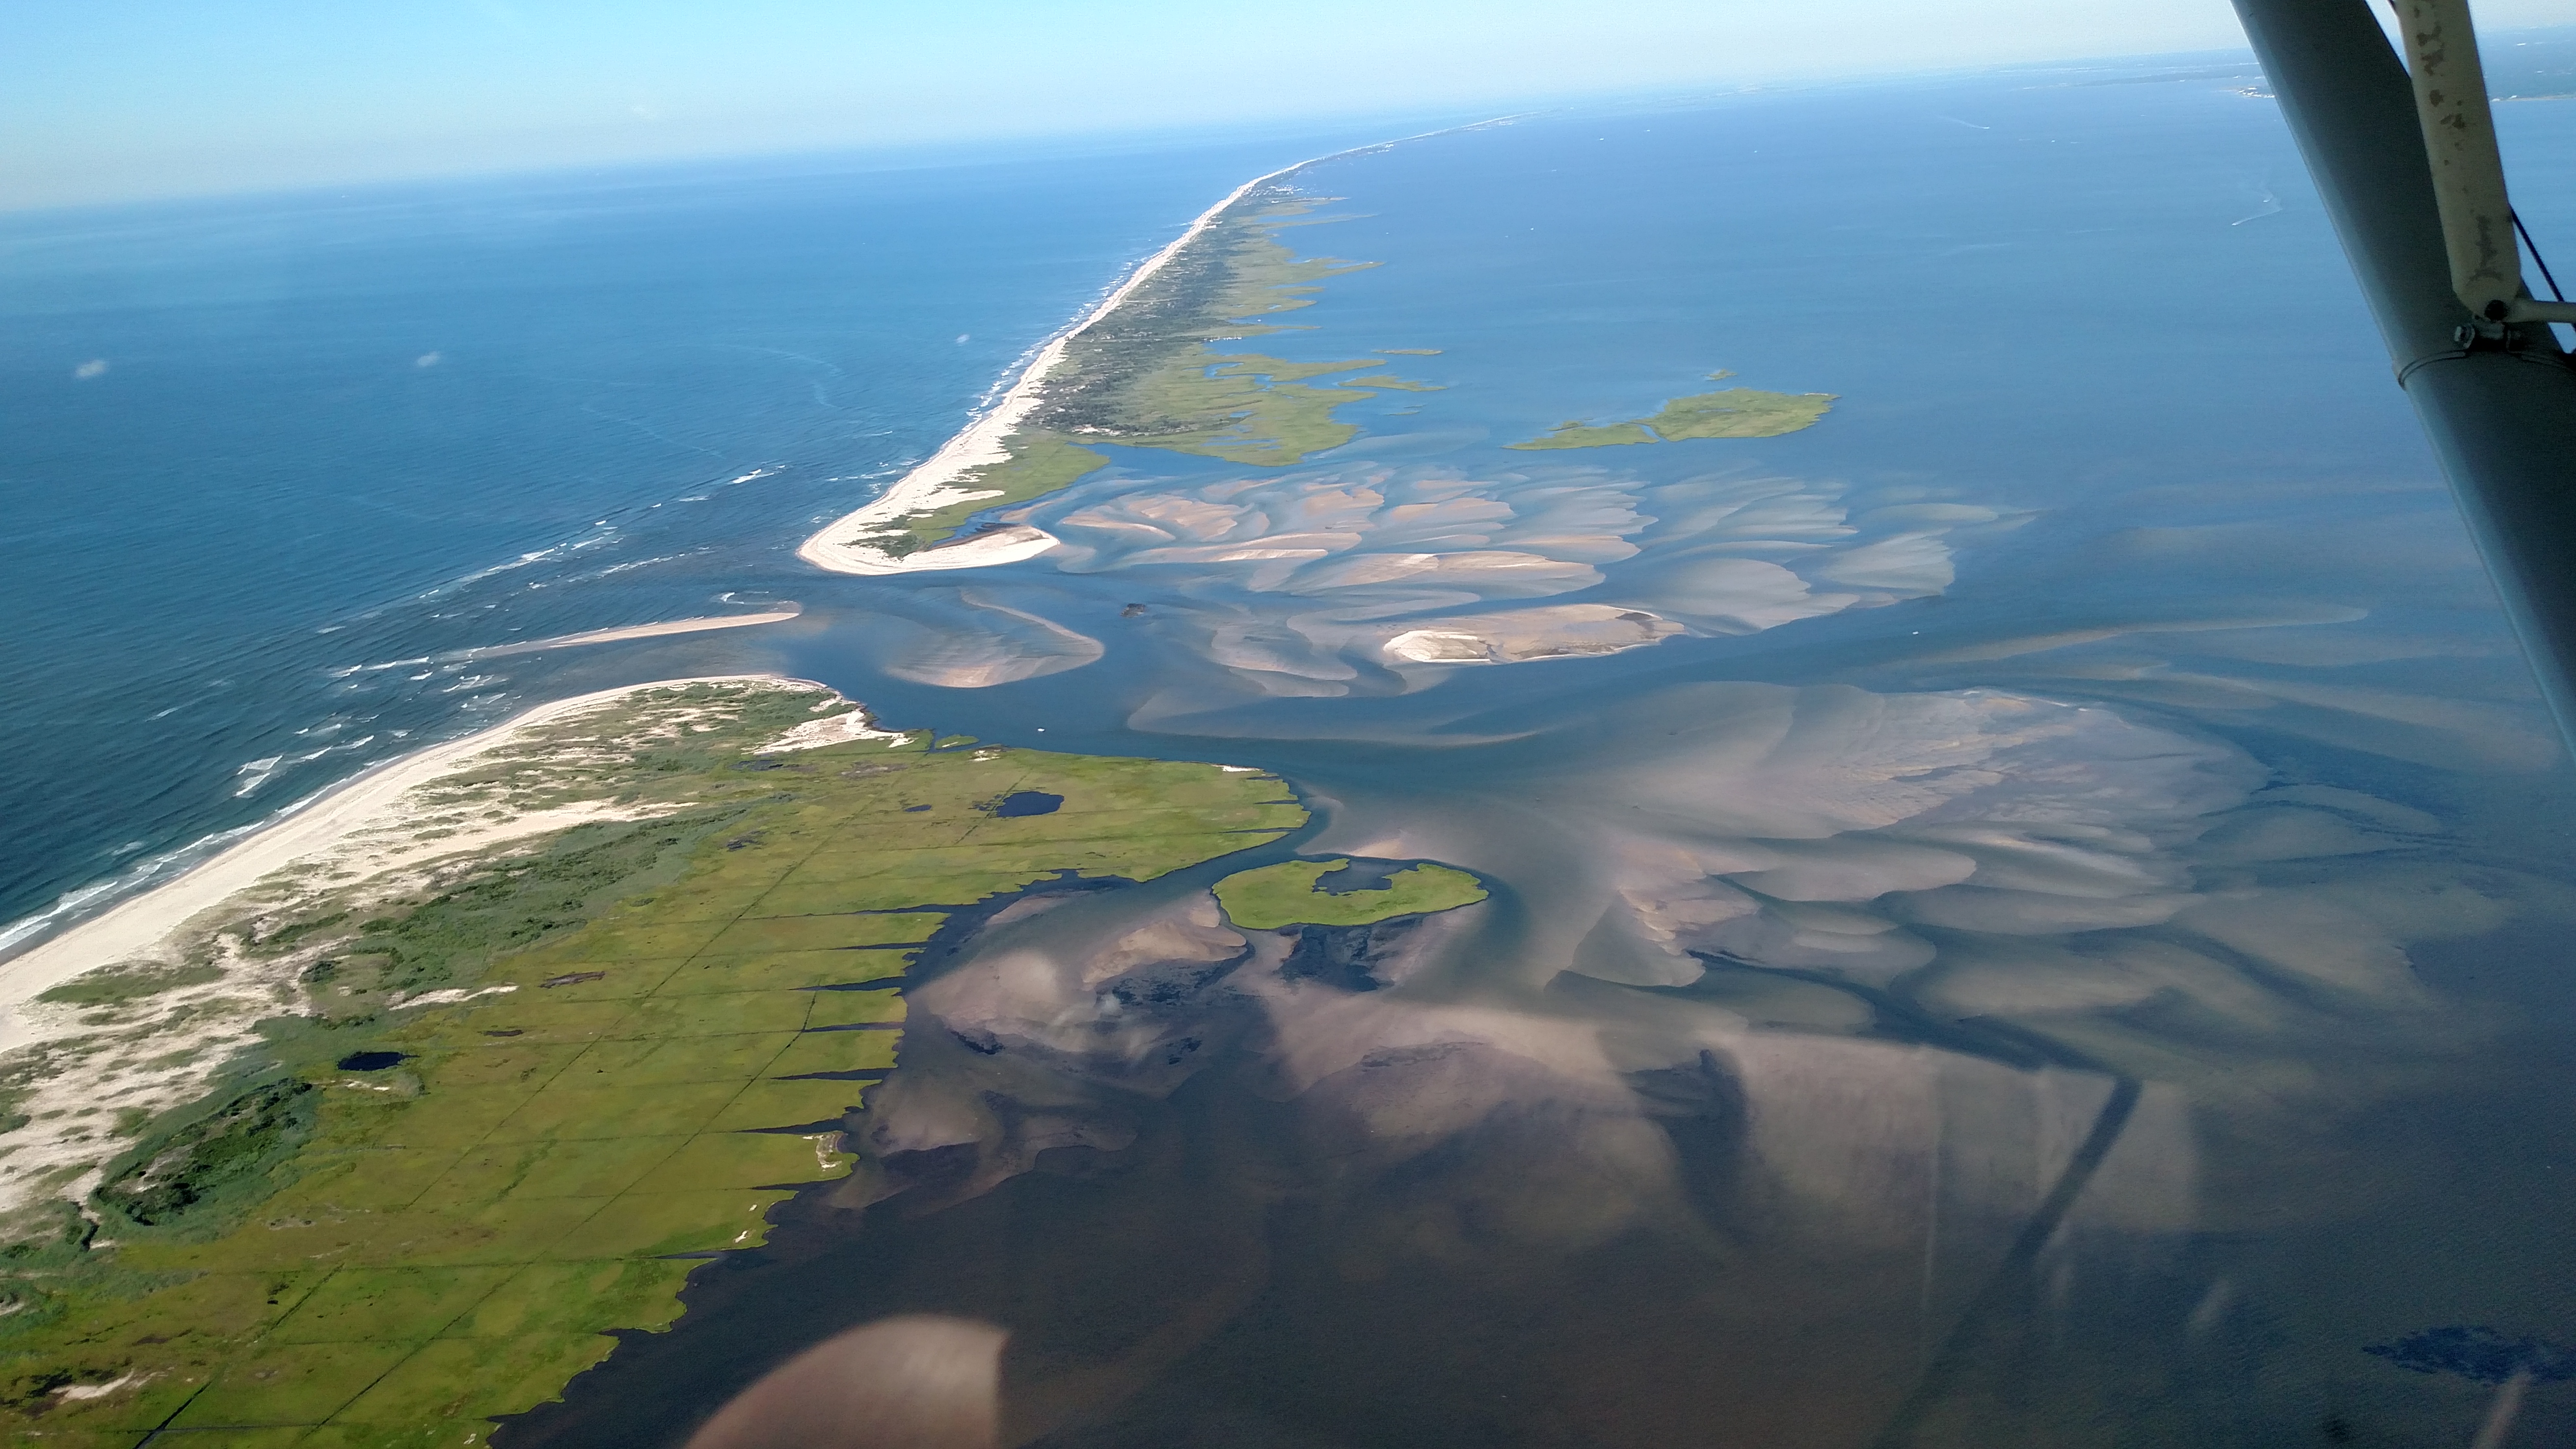 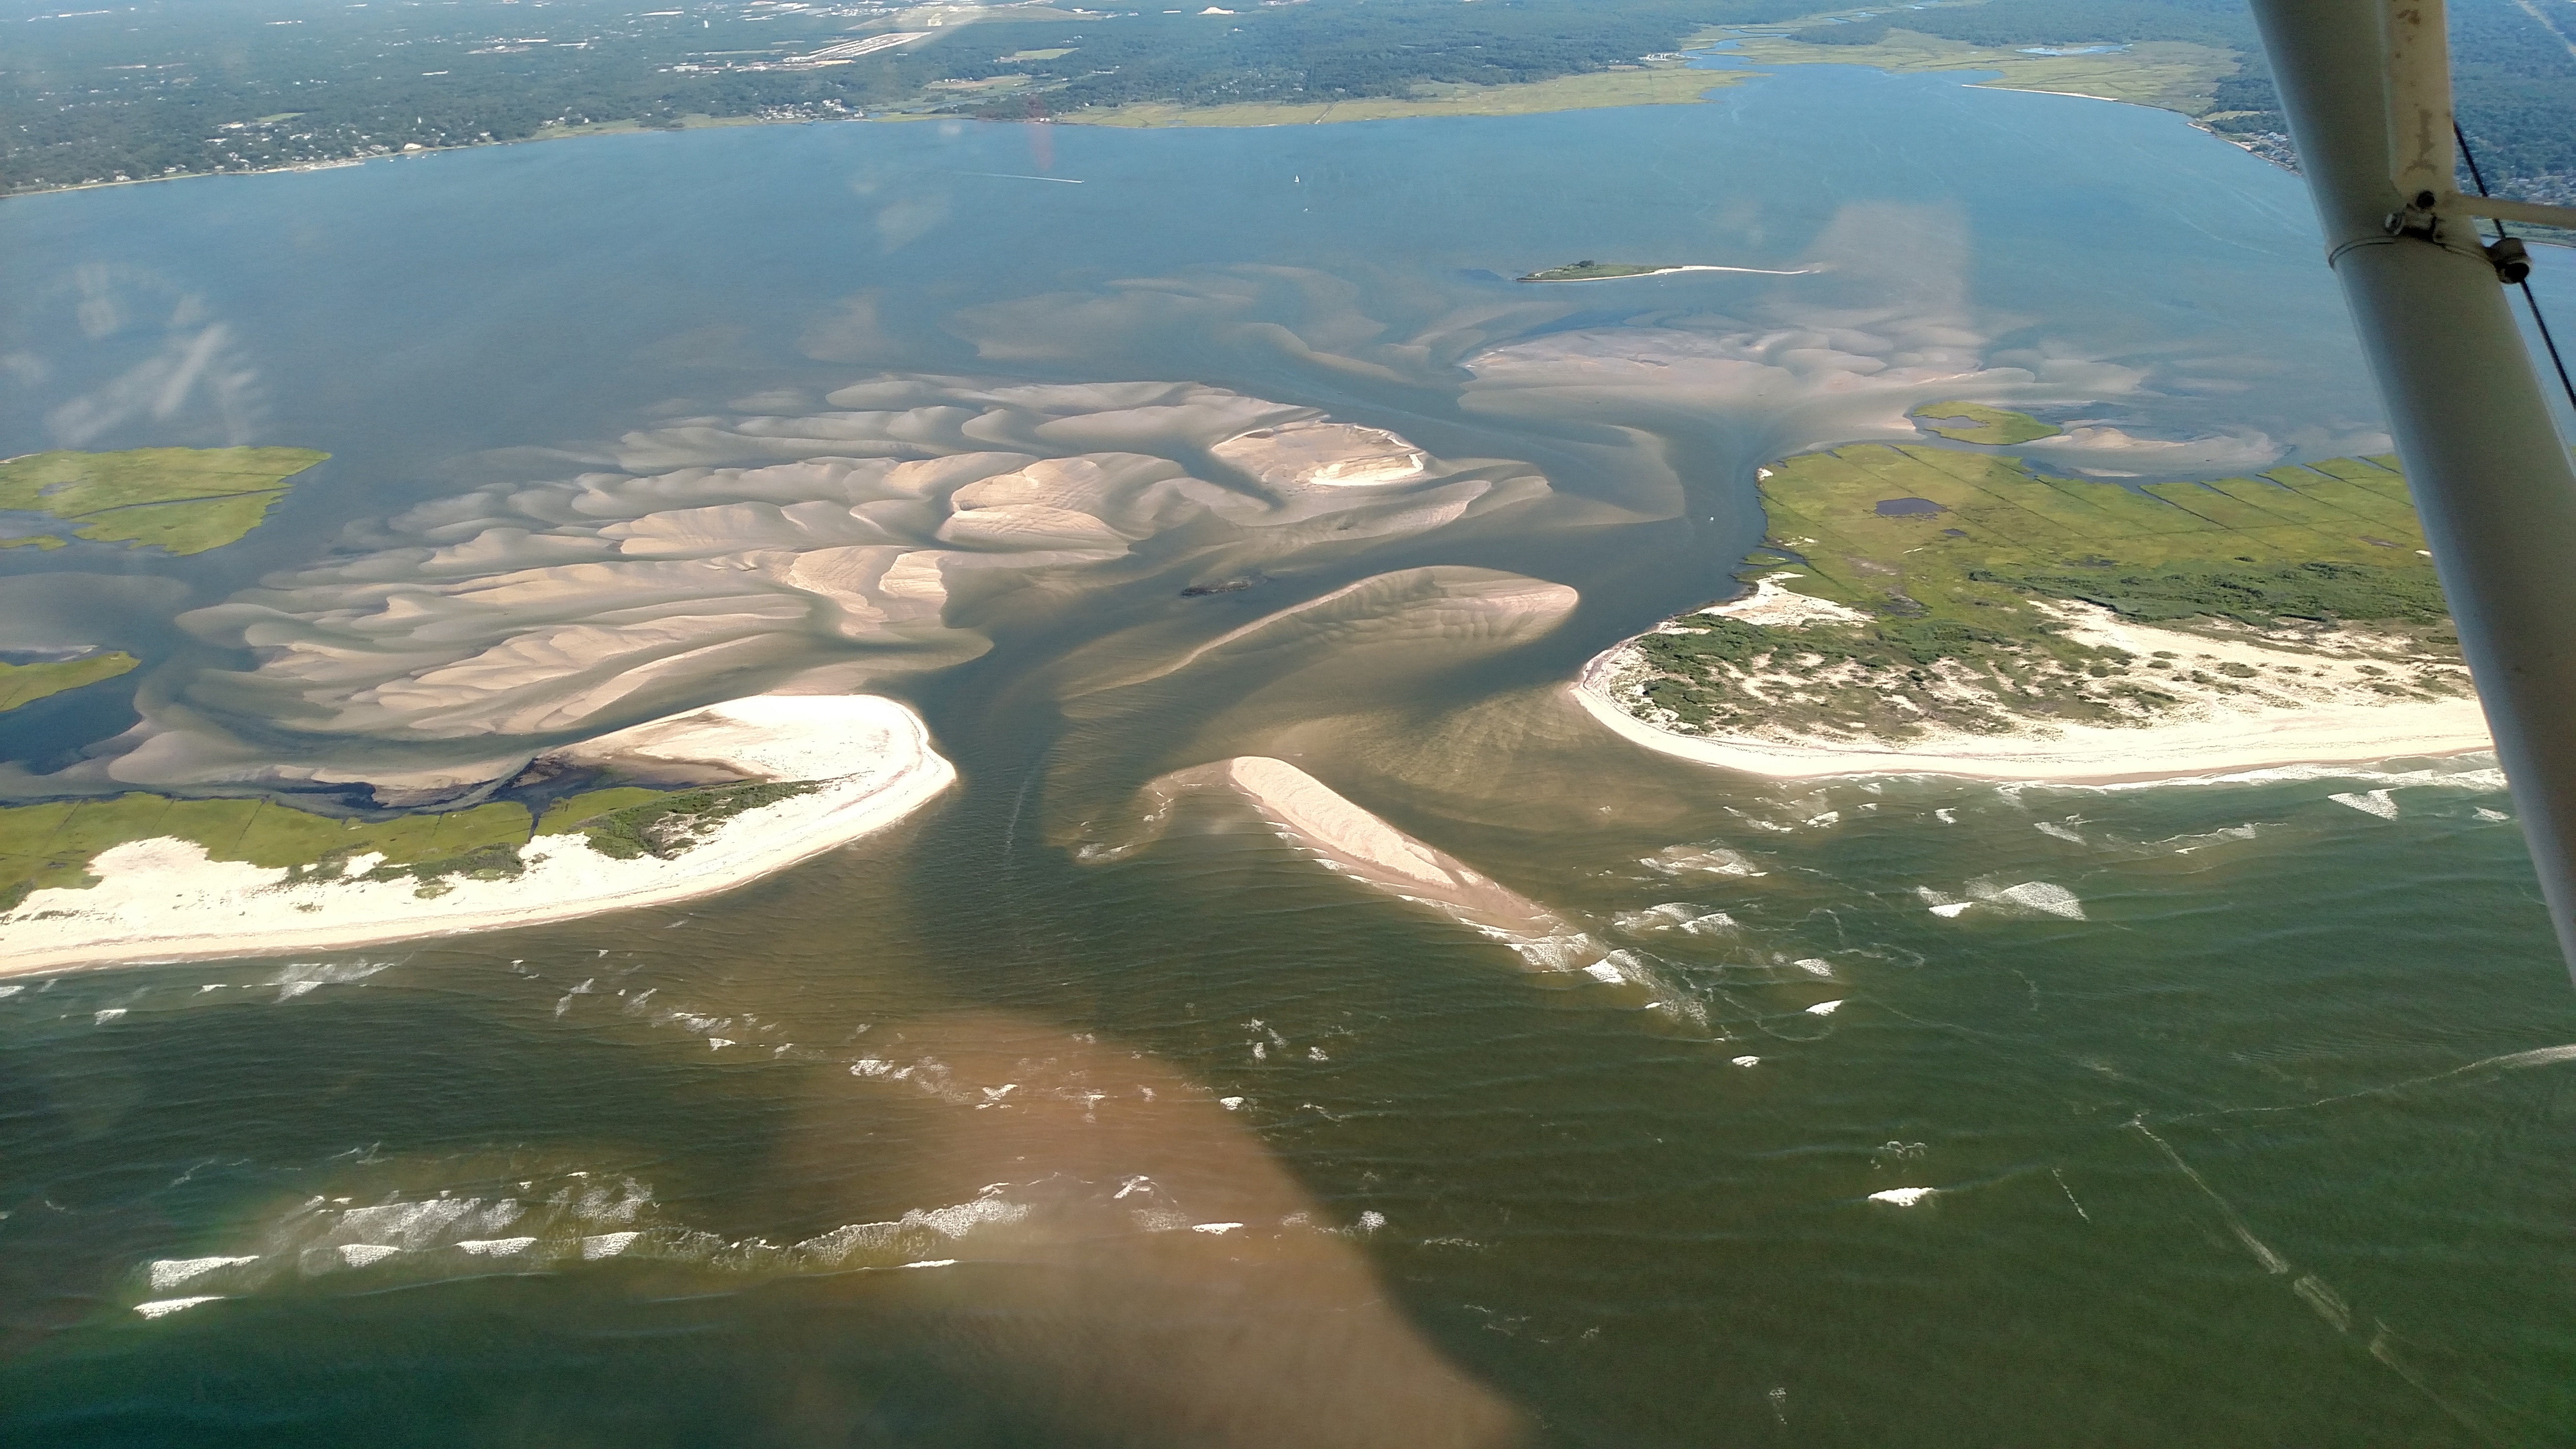 |
||||
July 30, 2017 (CF)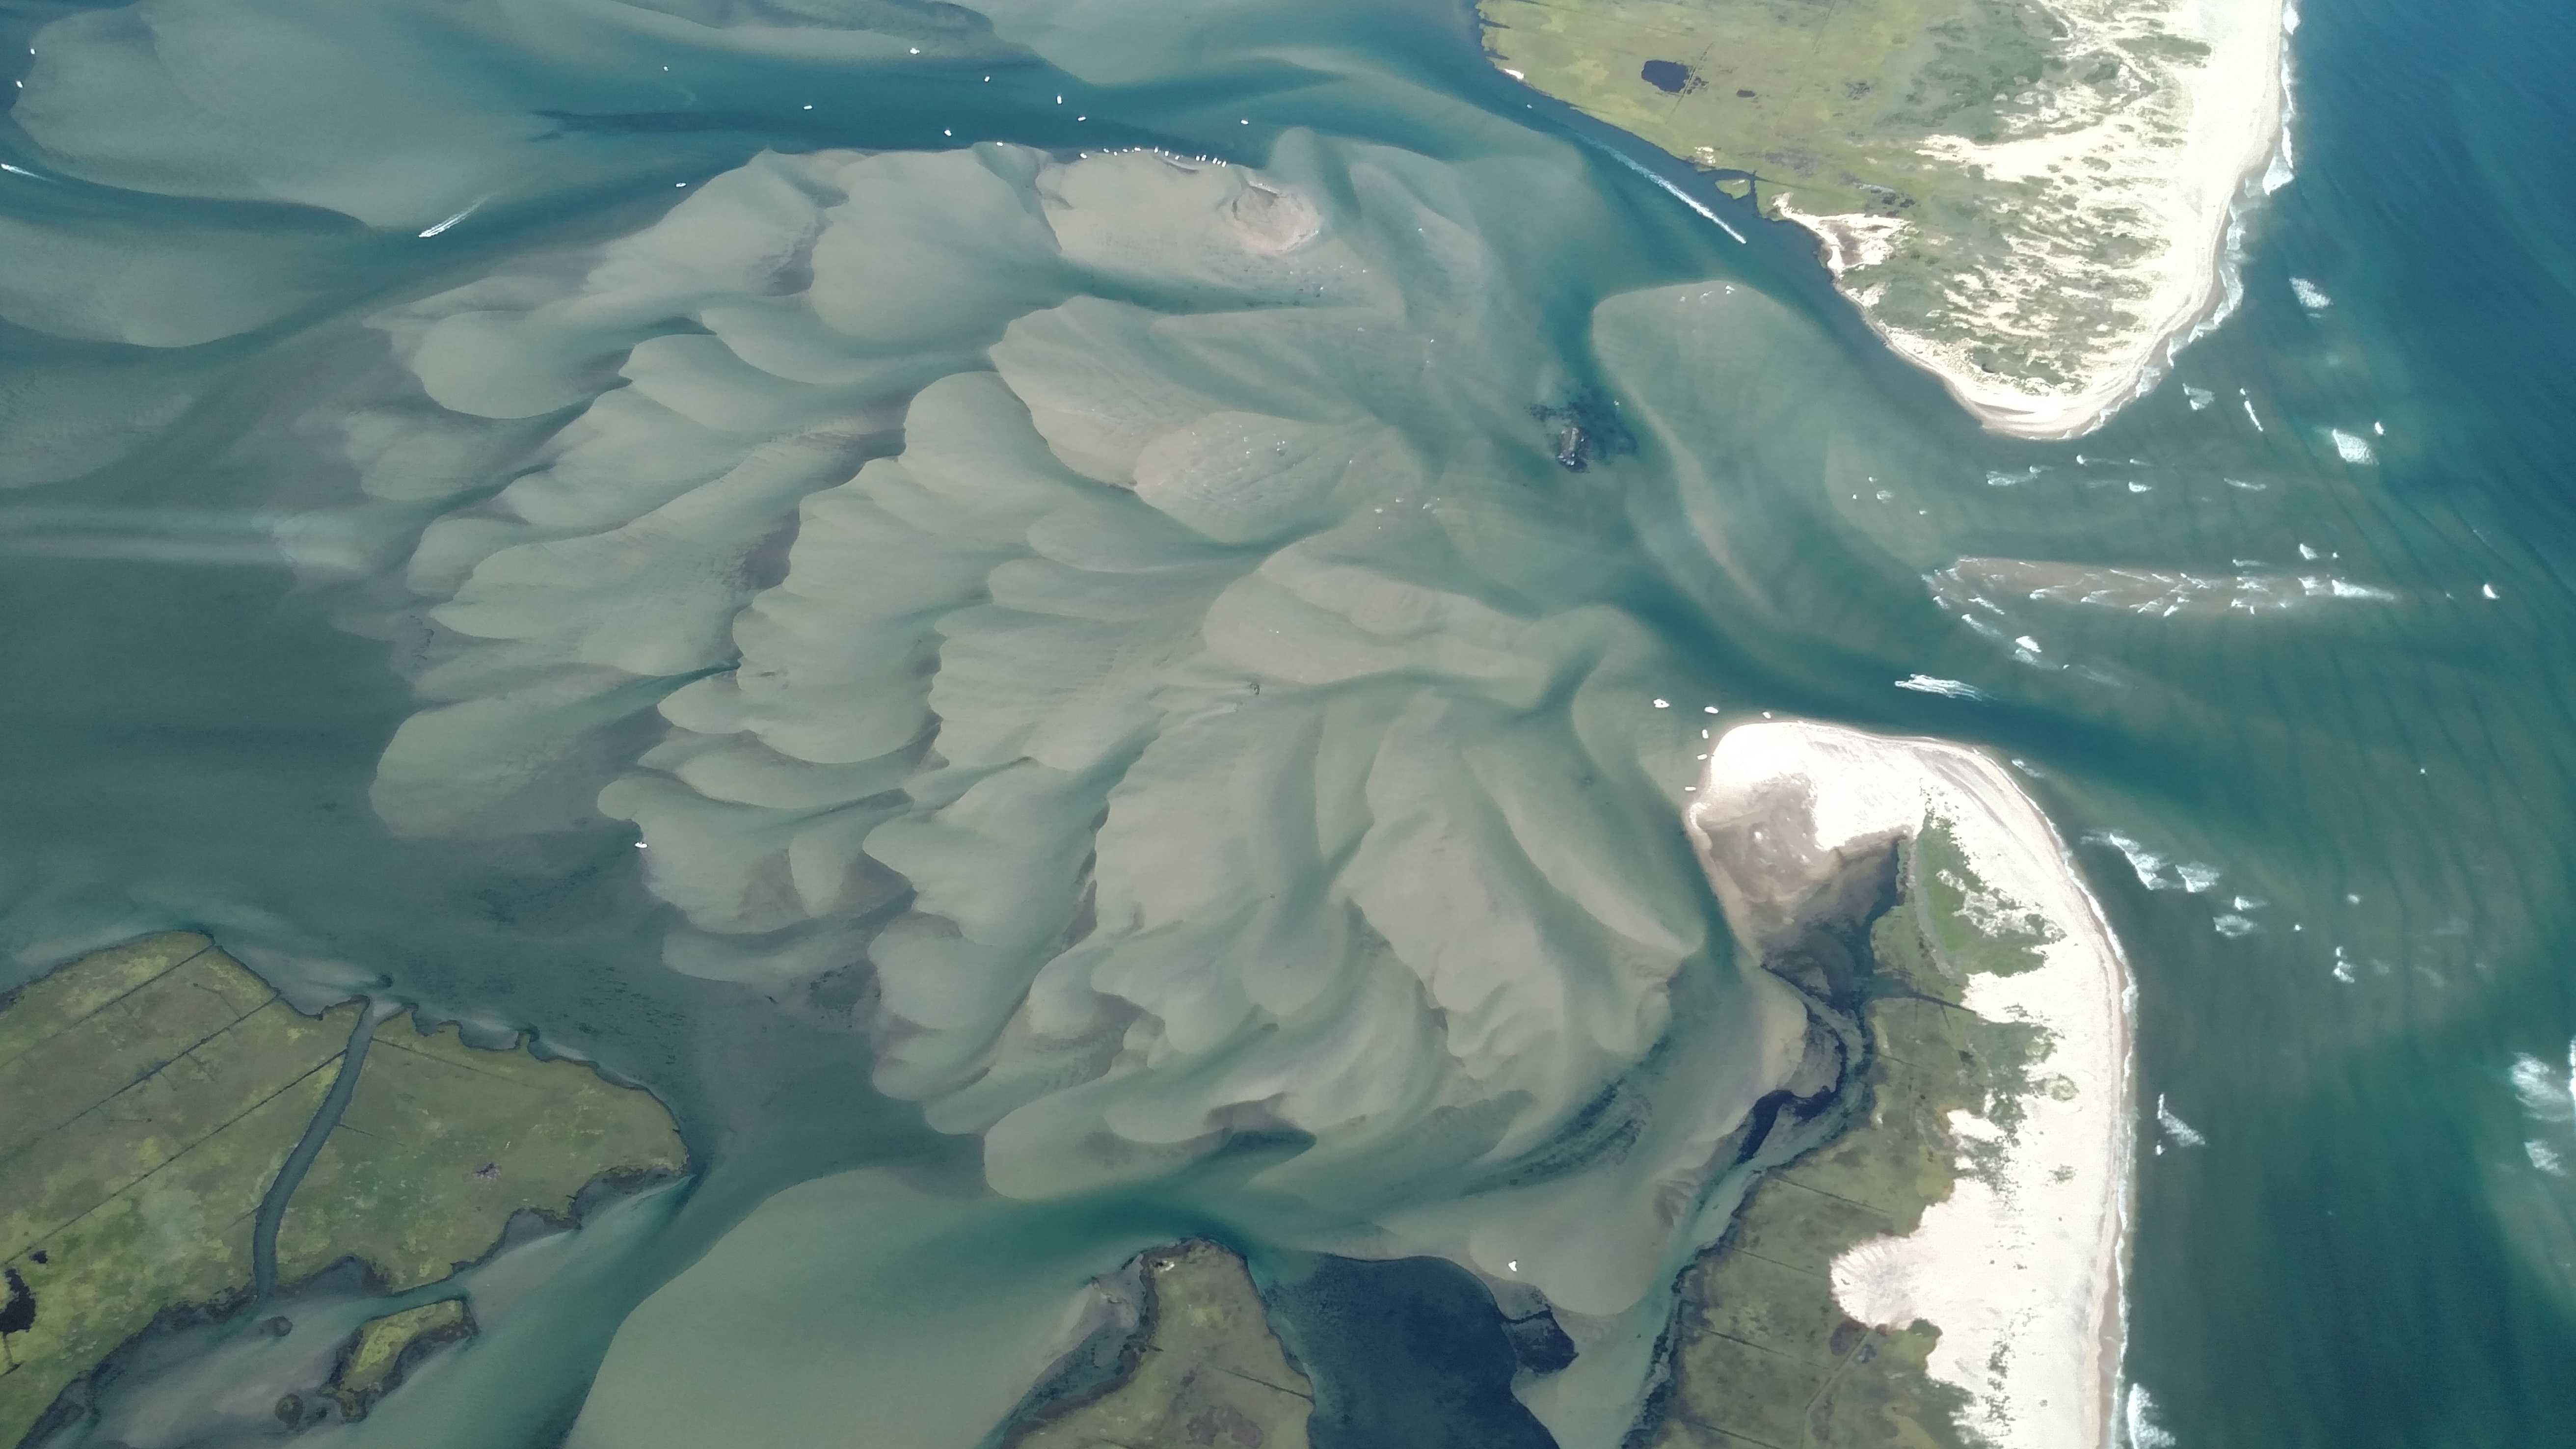 |
Aug 8, 2017 (AB)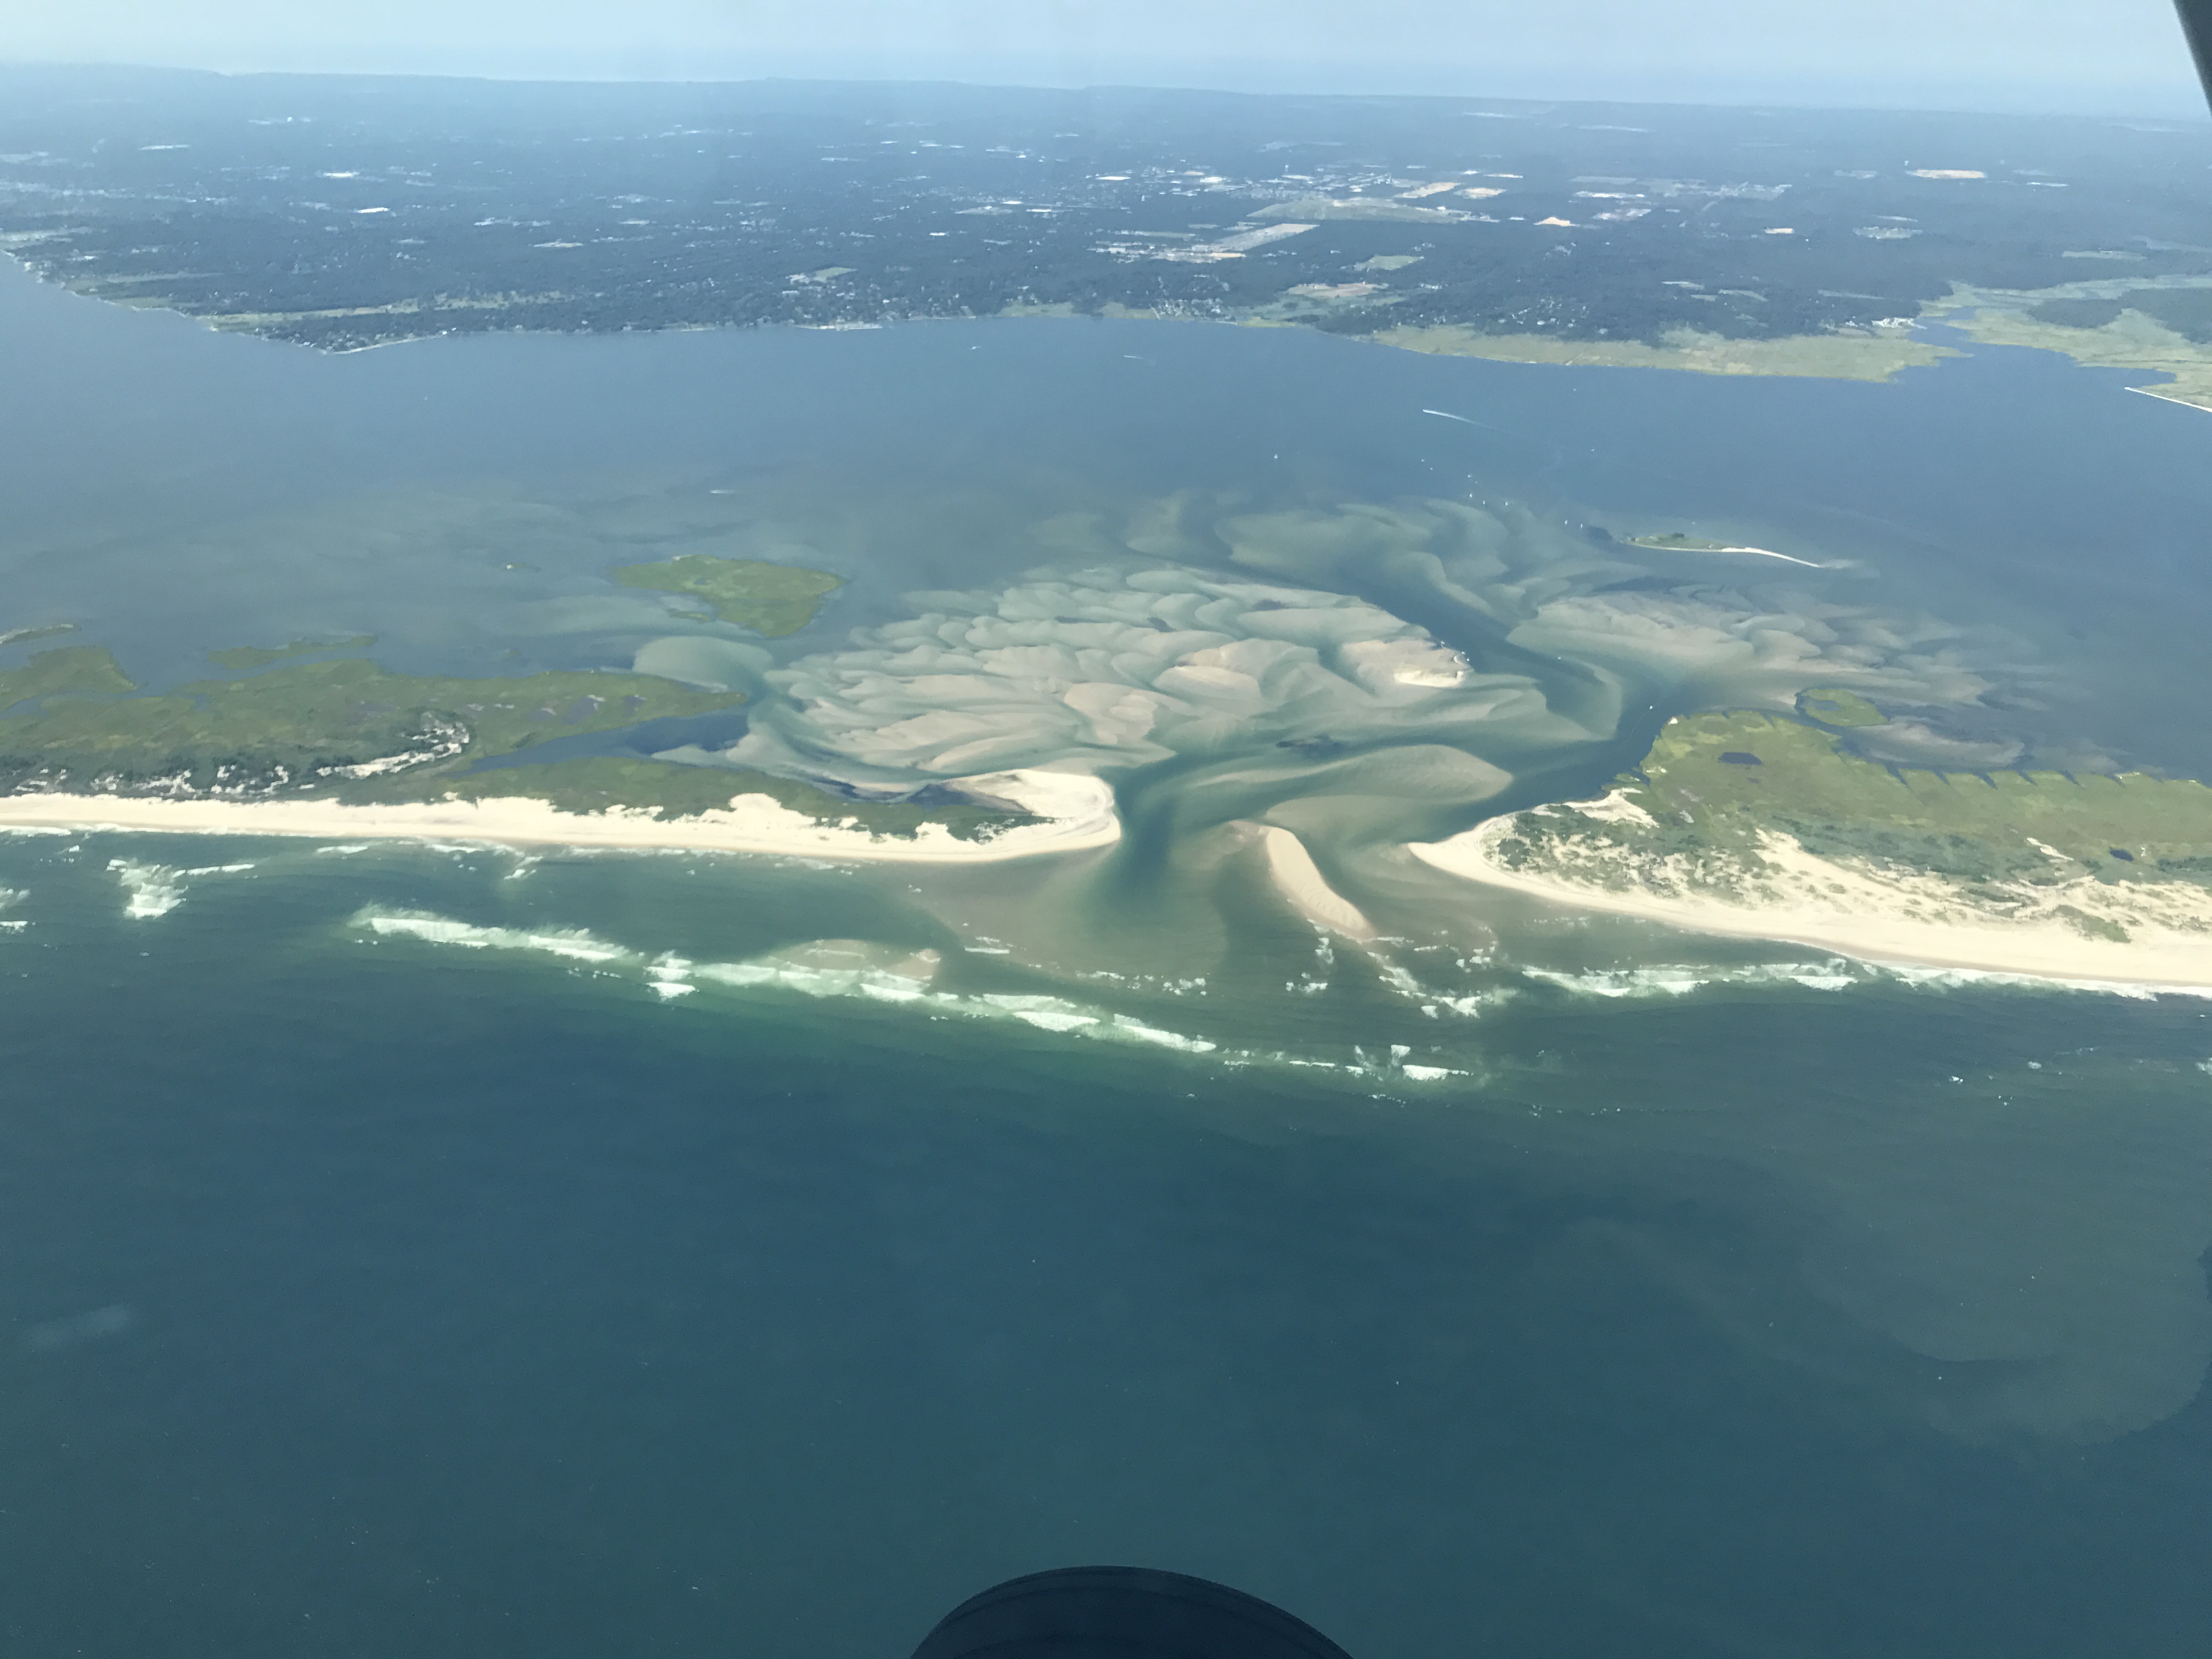 |
Aug 14, 2017 (CF)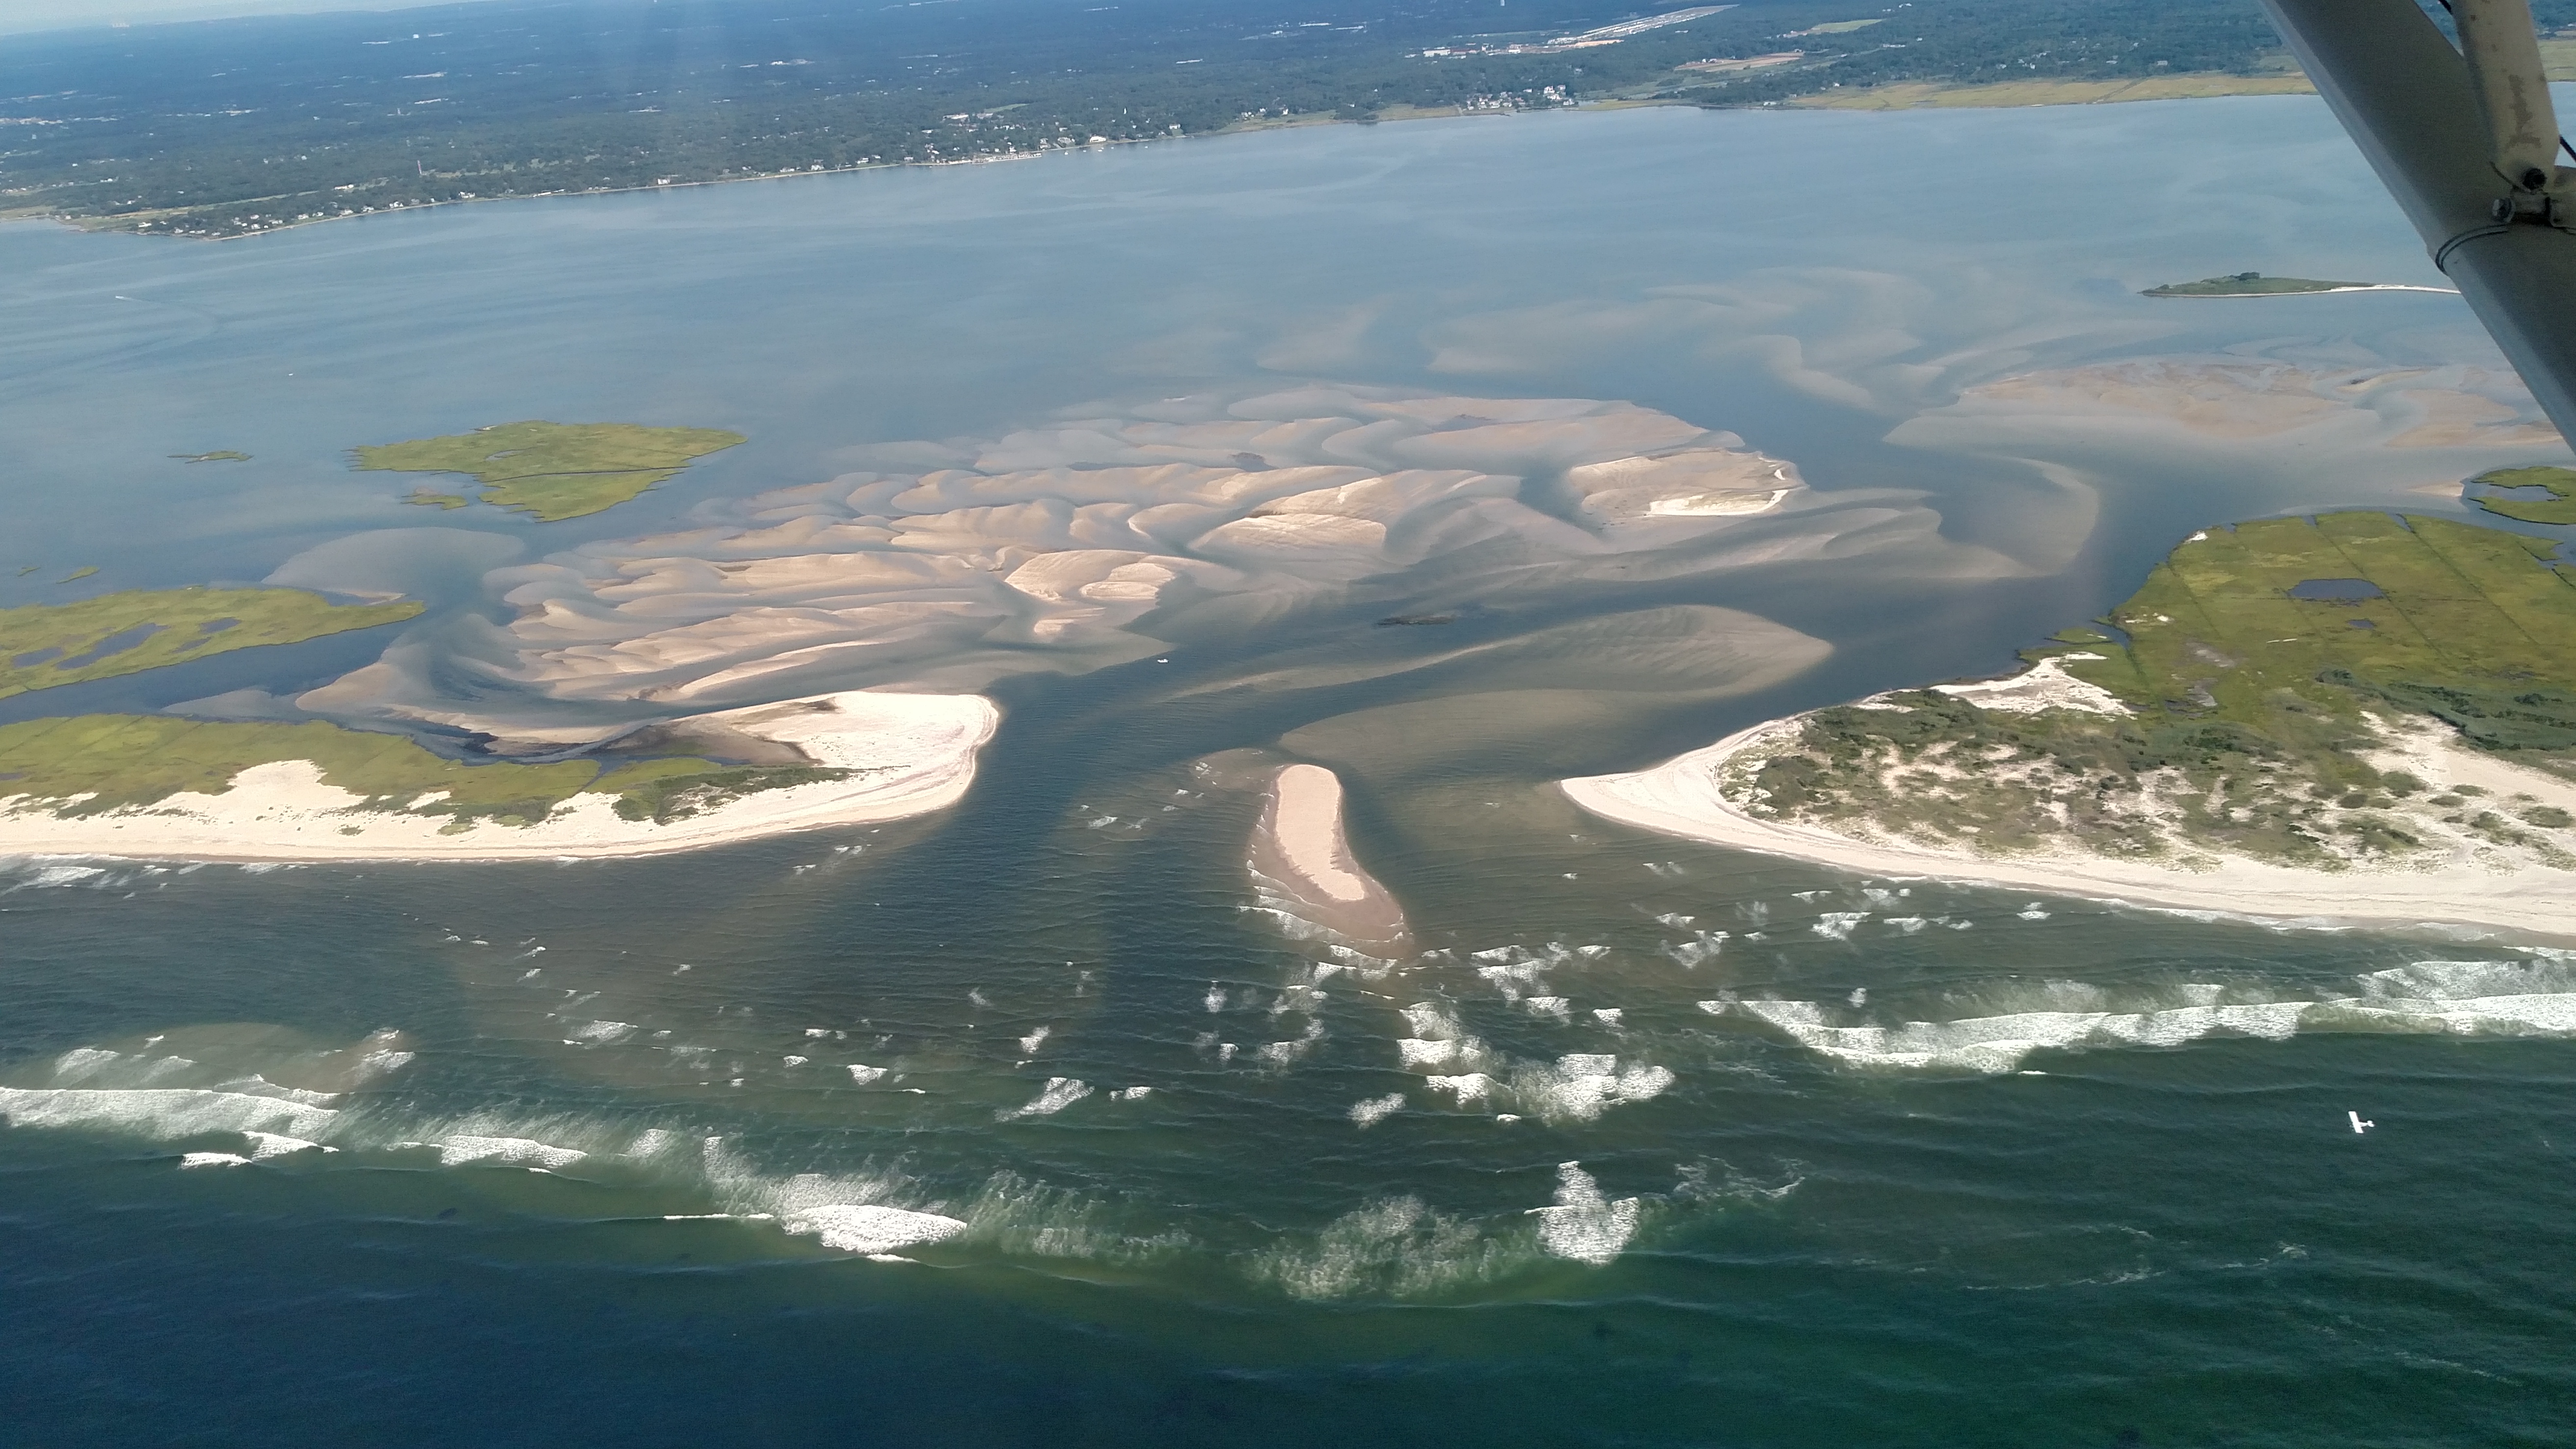 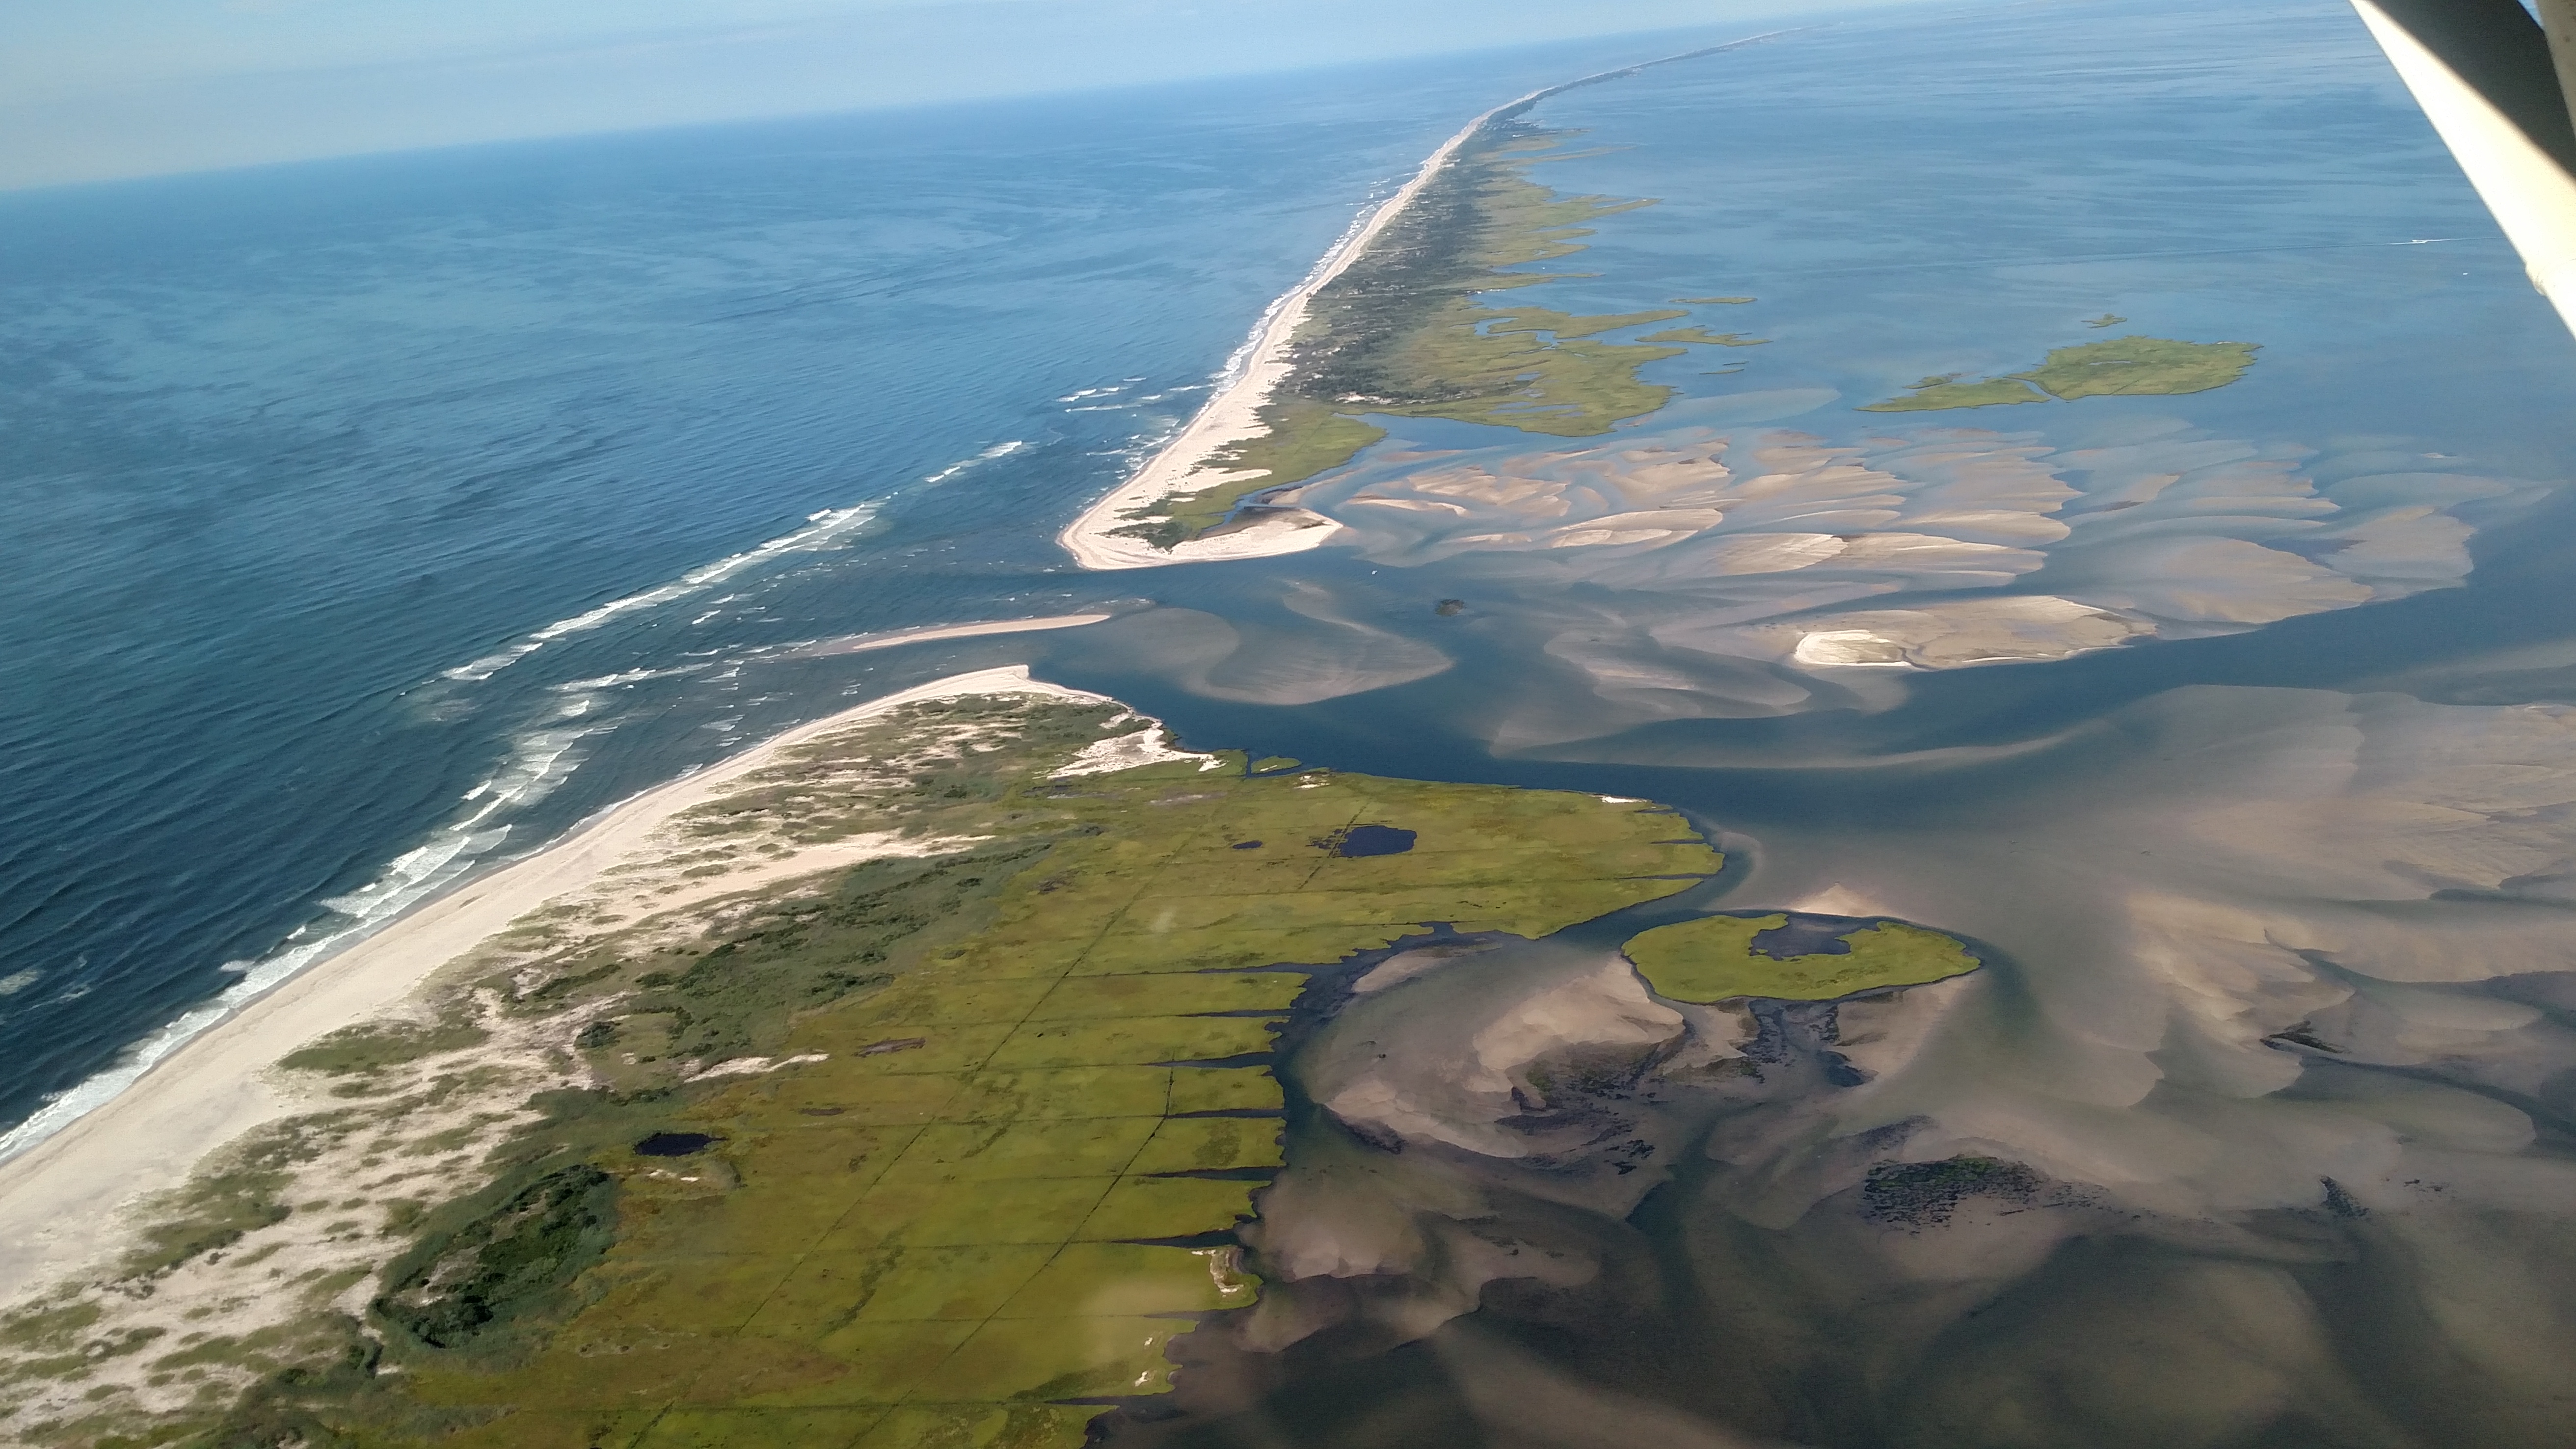 |
Sept 8, 2017 (CF)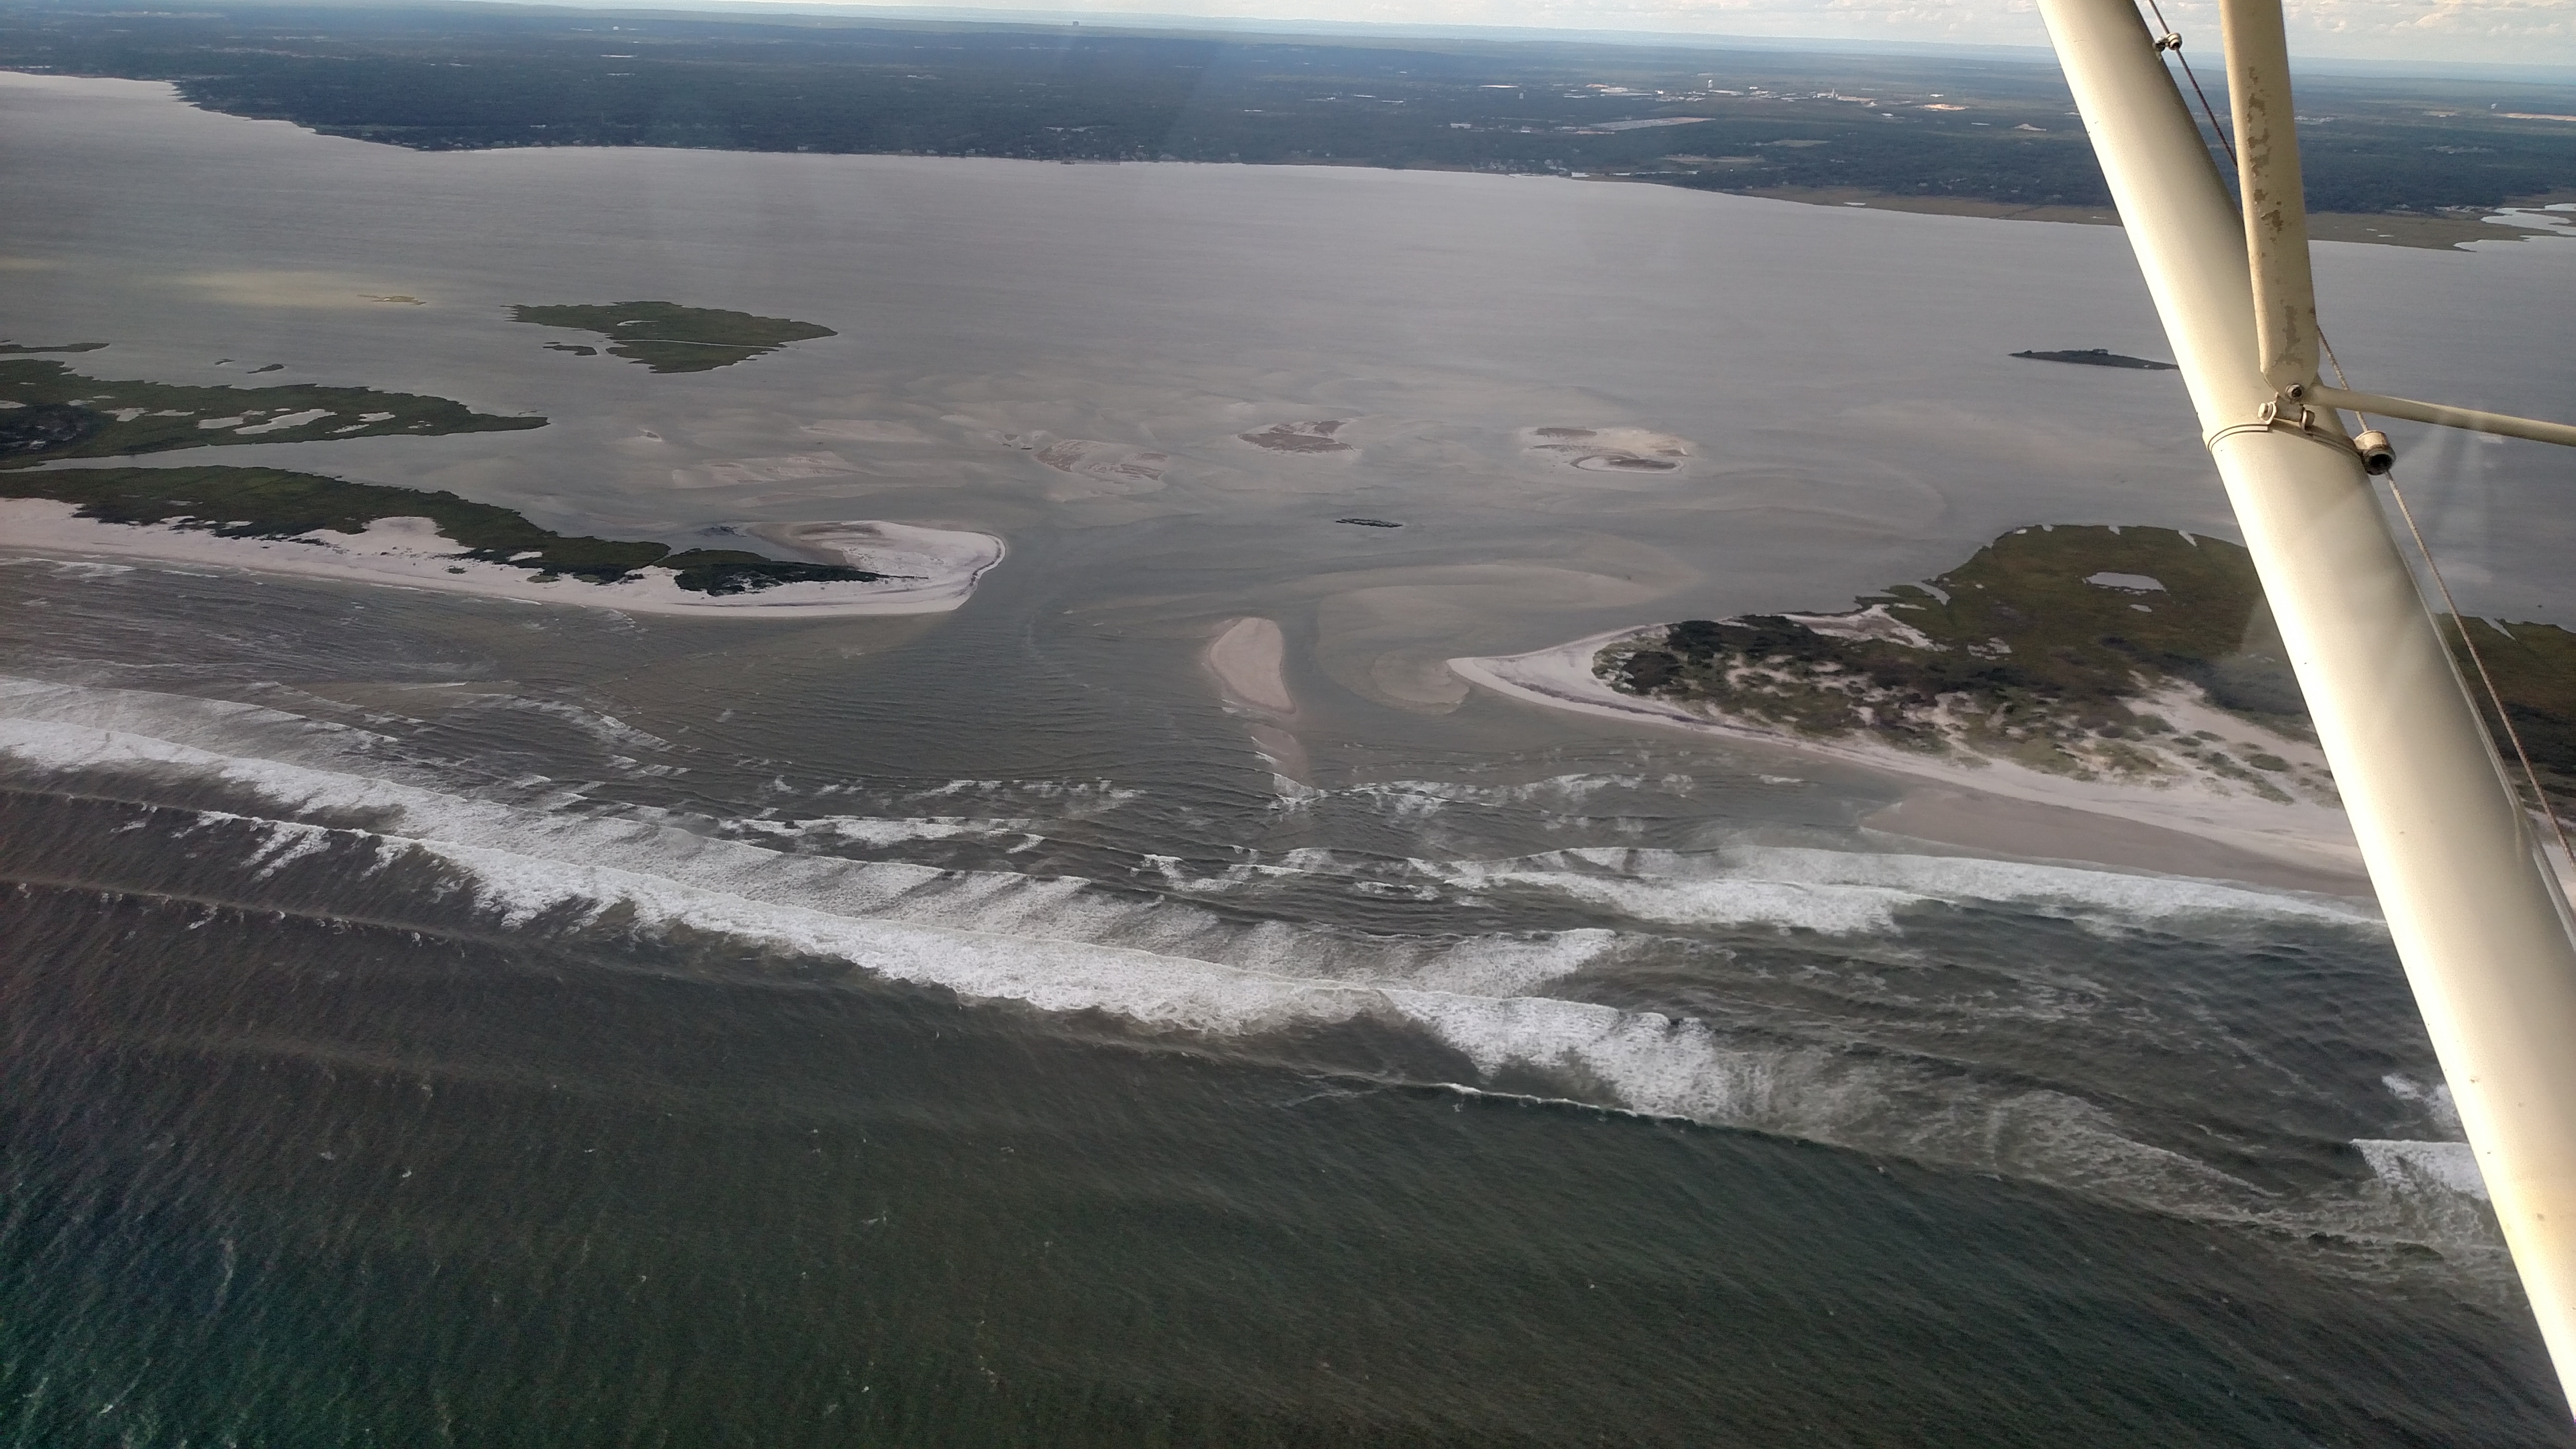 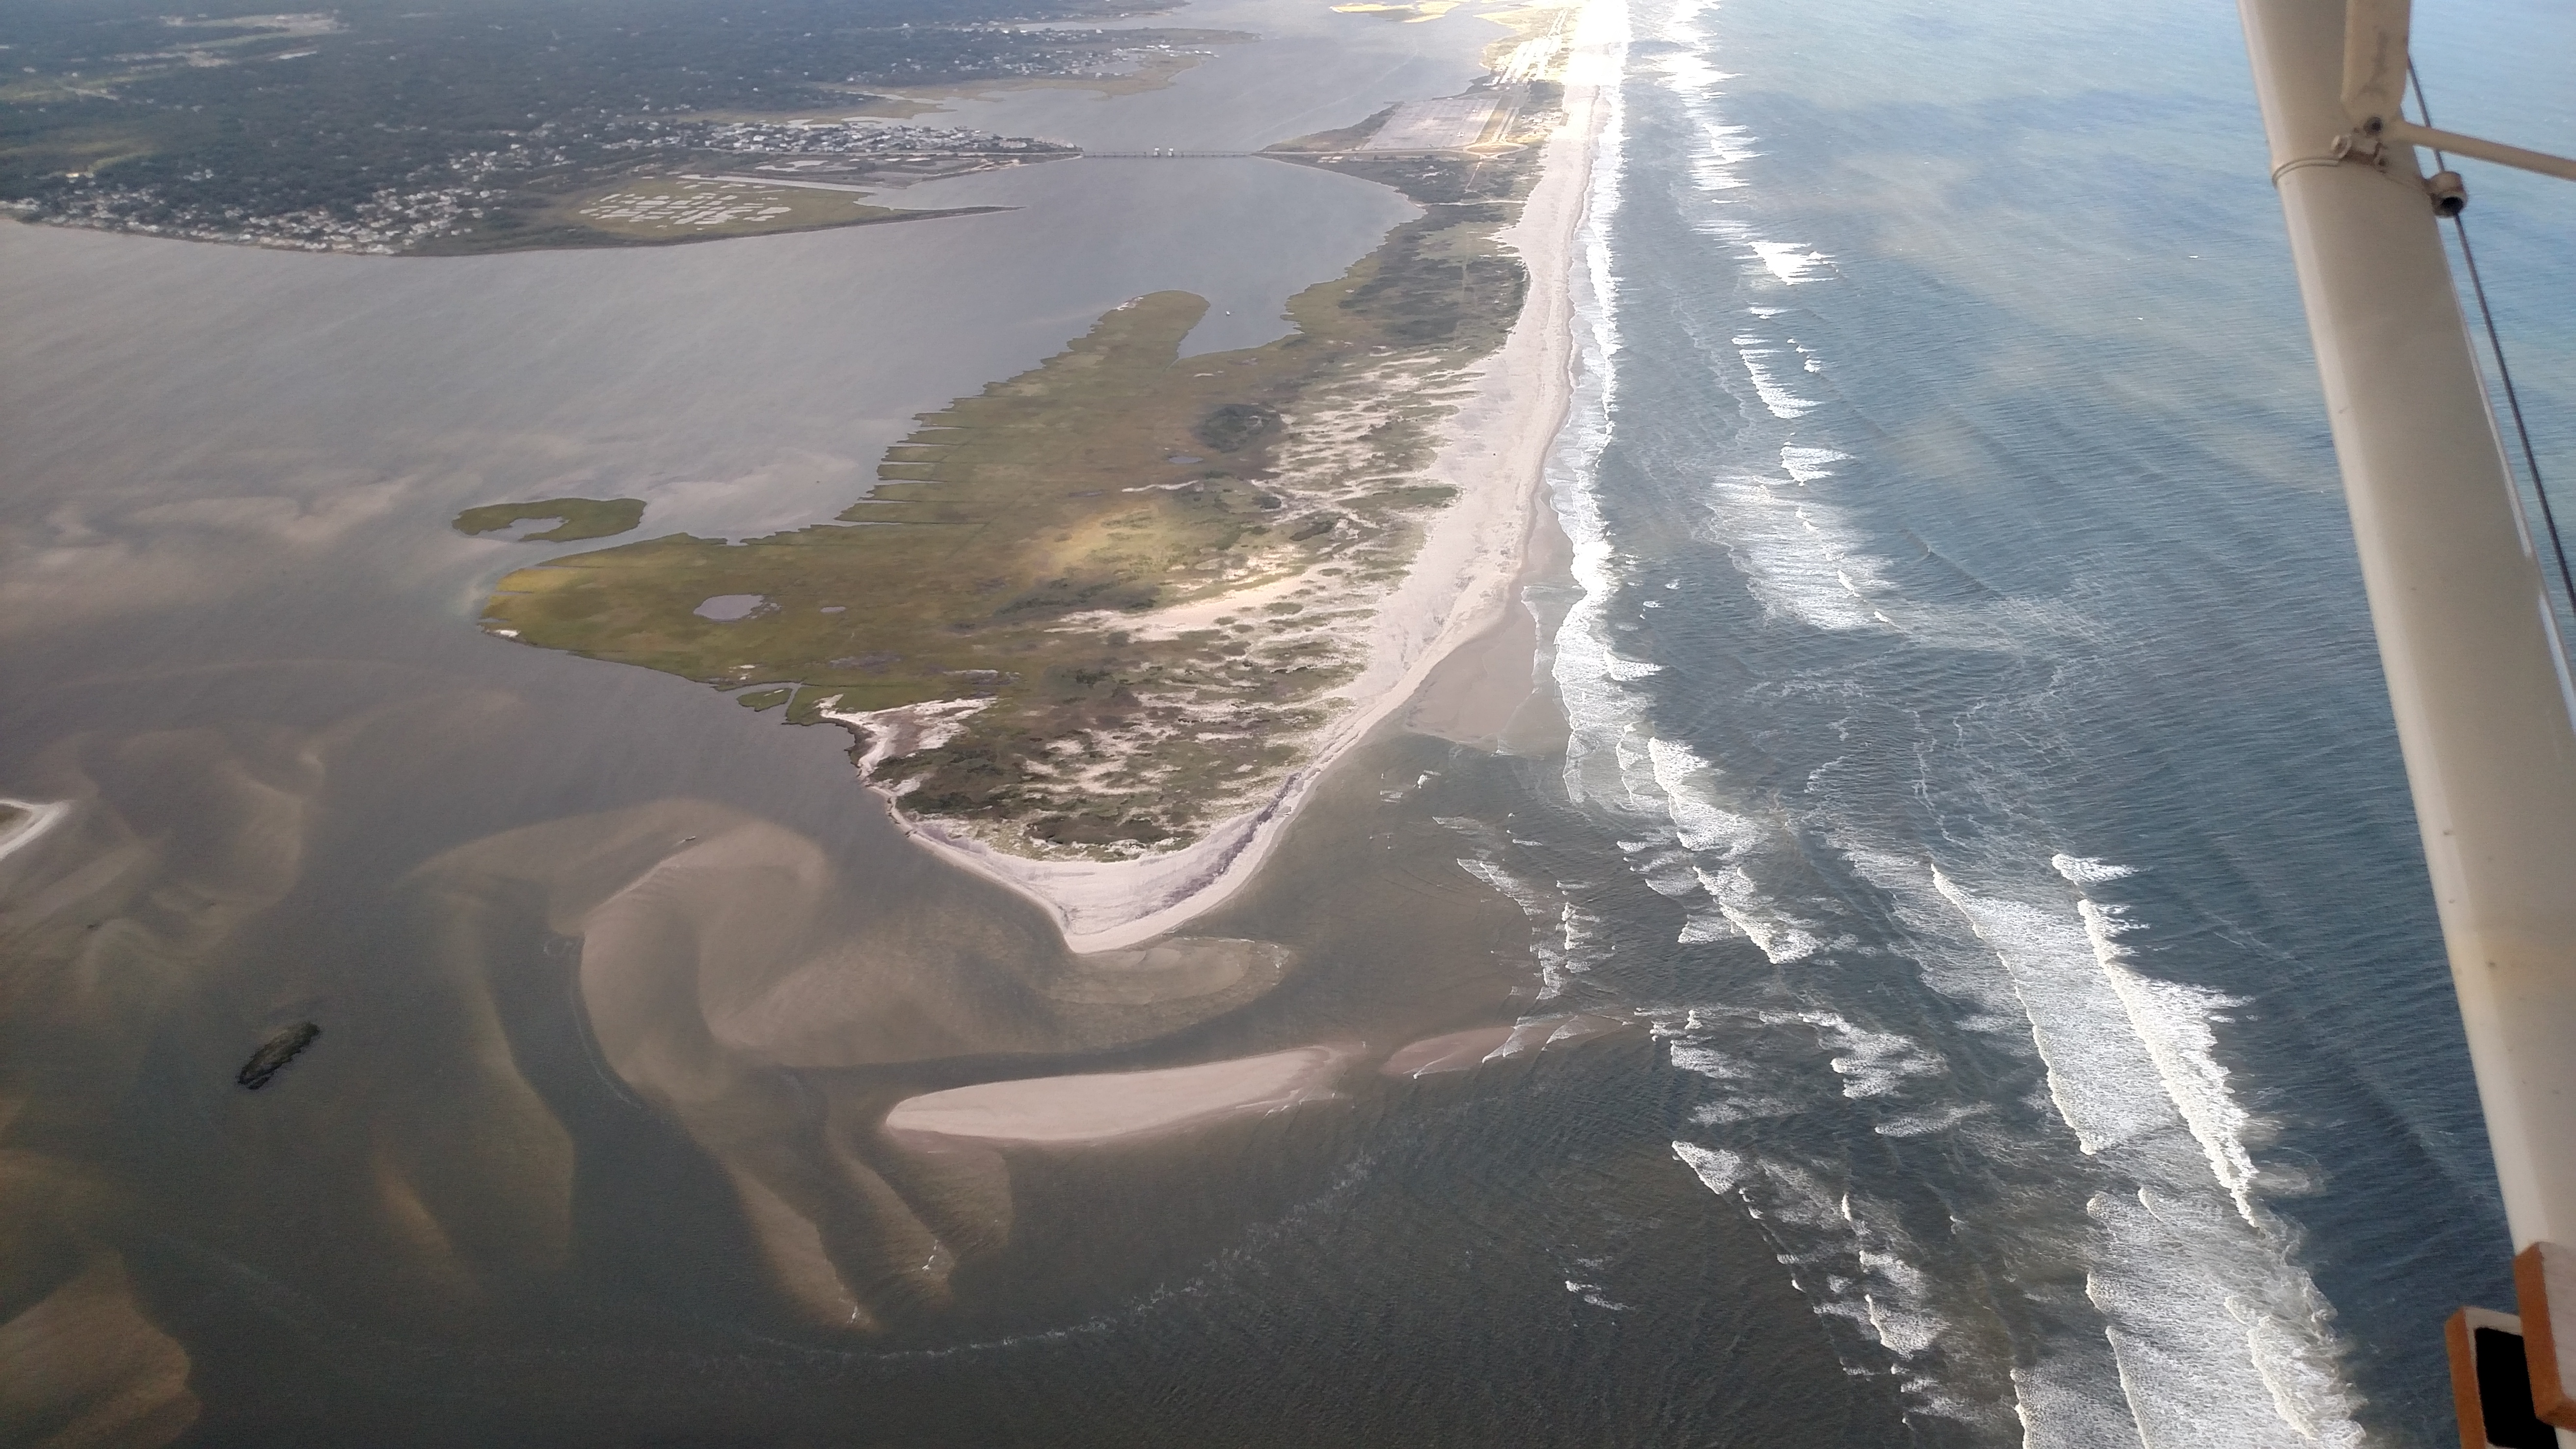 |
||||
Sept 20, 2017 (CF)  |
Sept 24, 2017 (CF)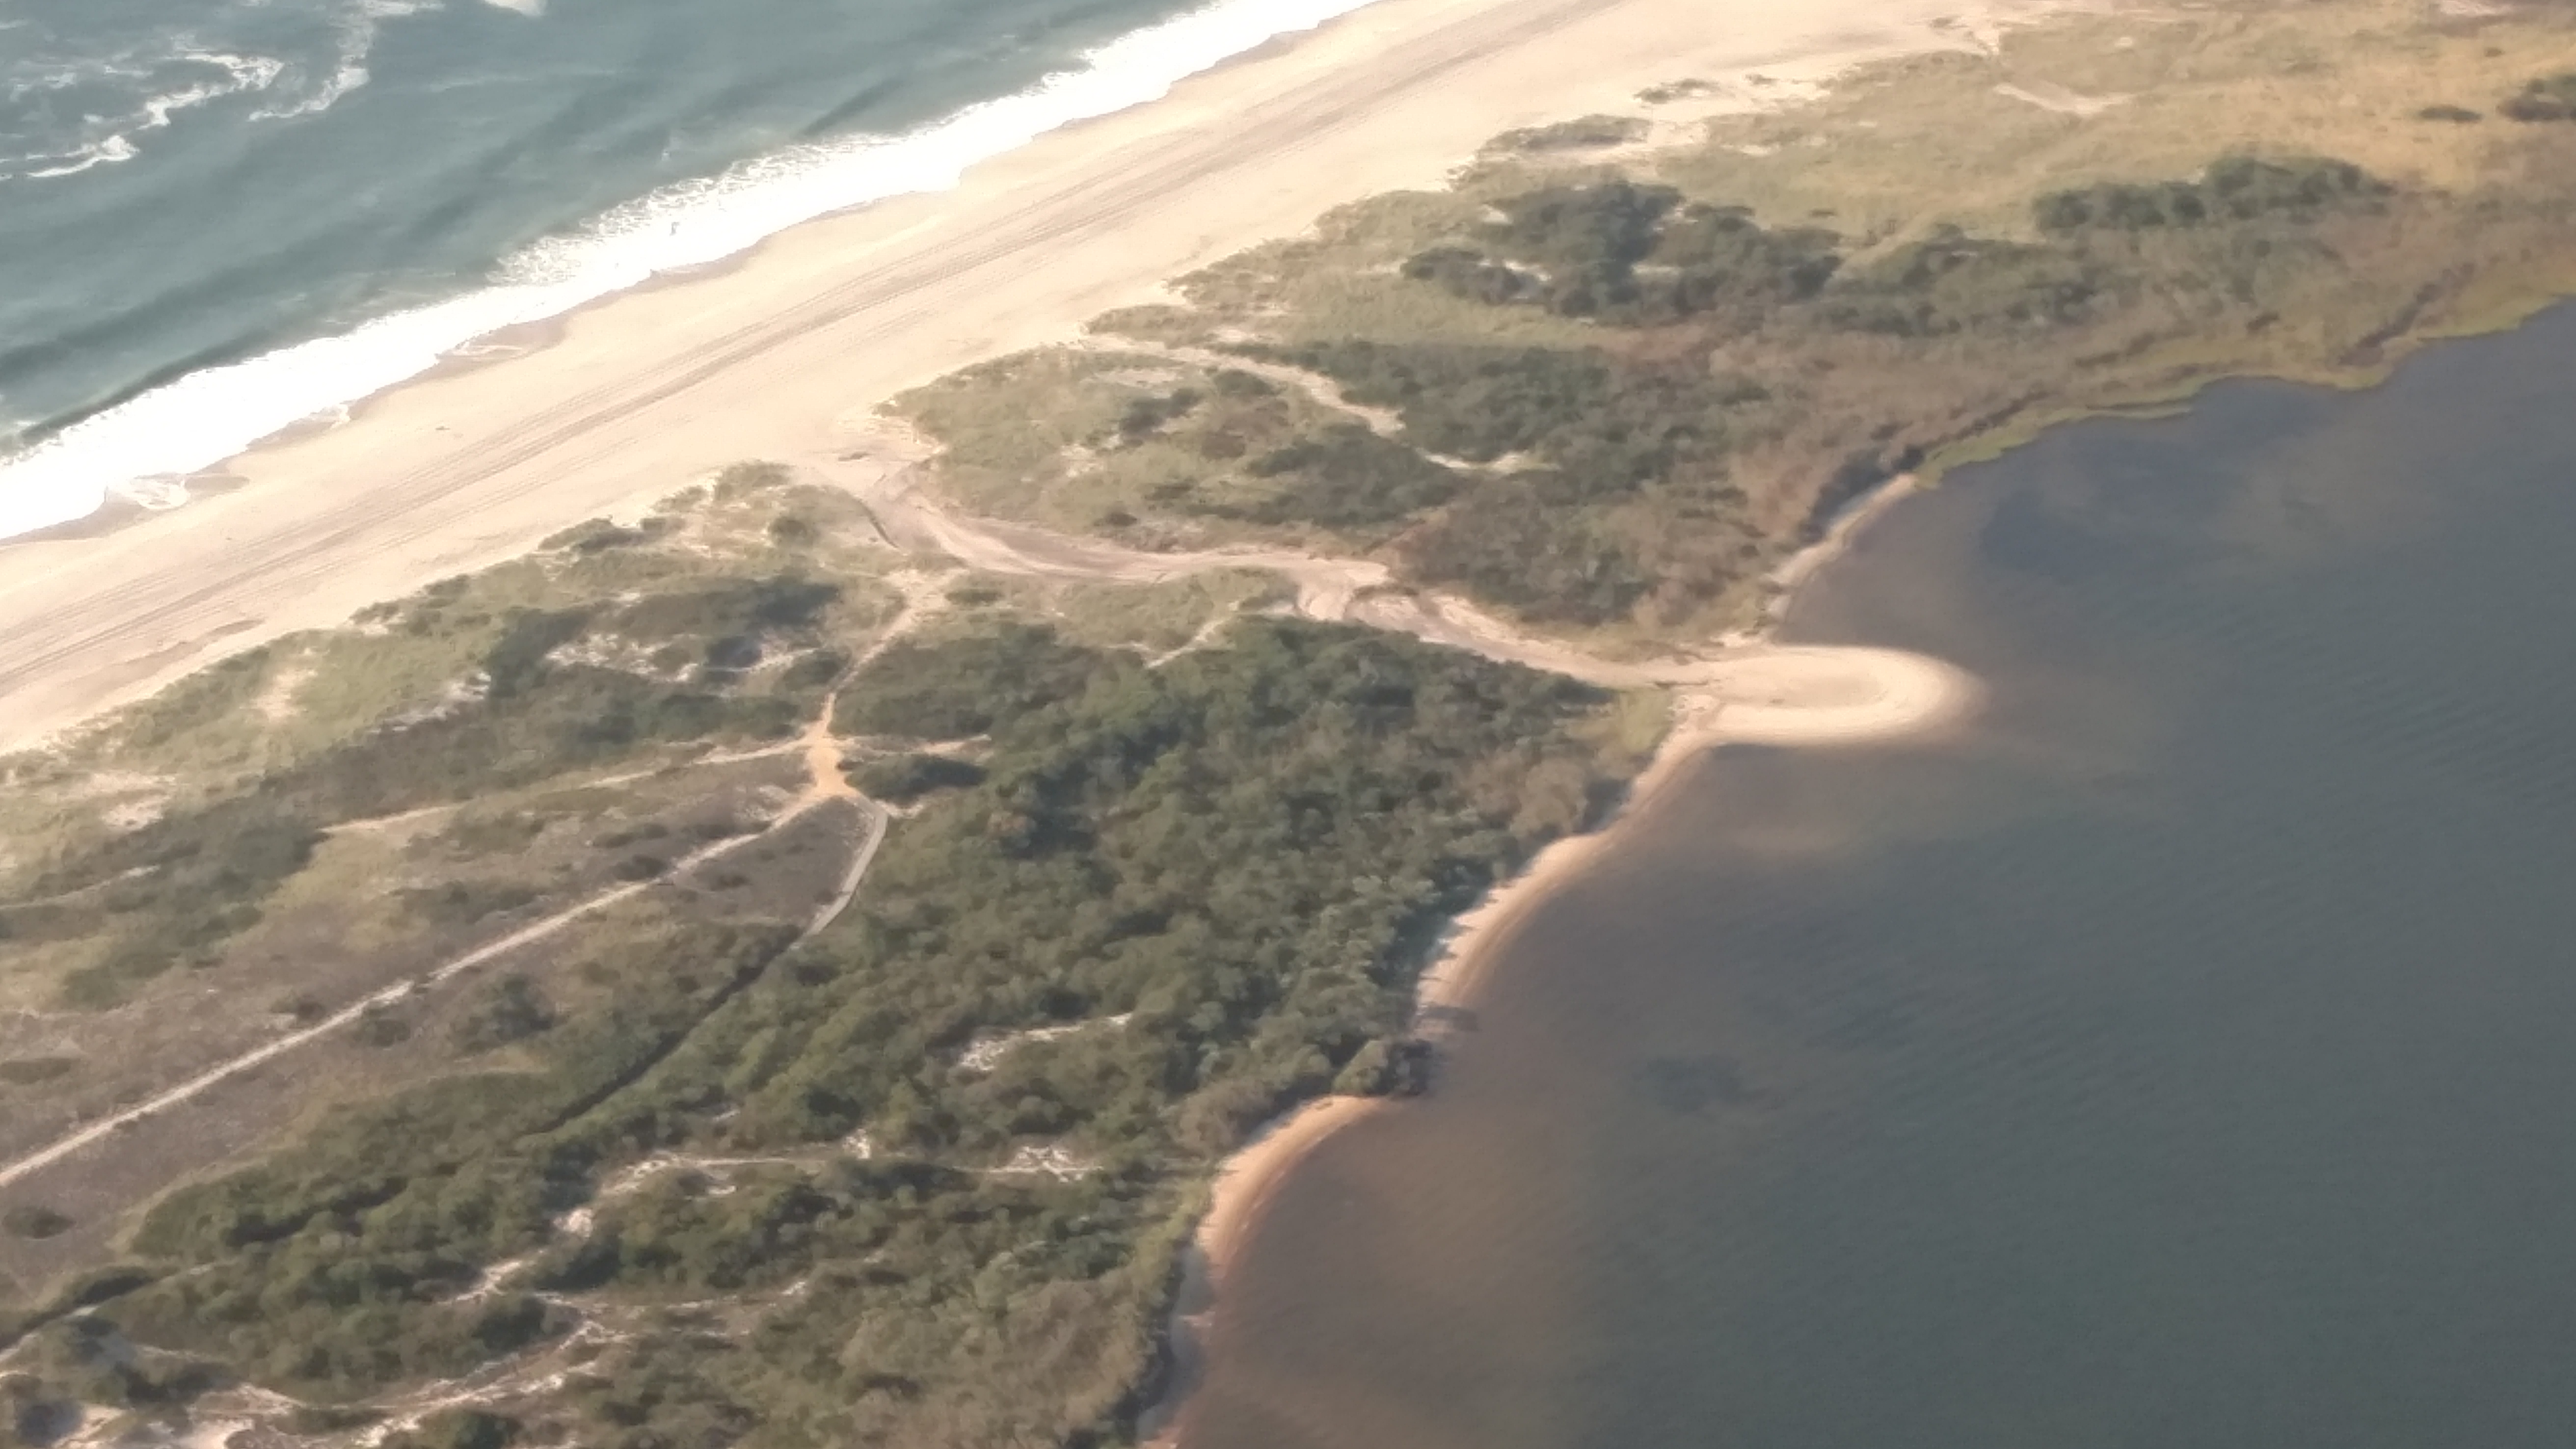 |
Sept 24, 2017 (CF)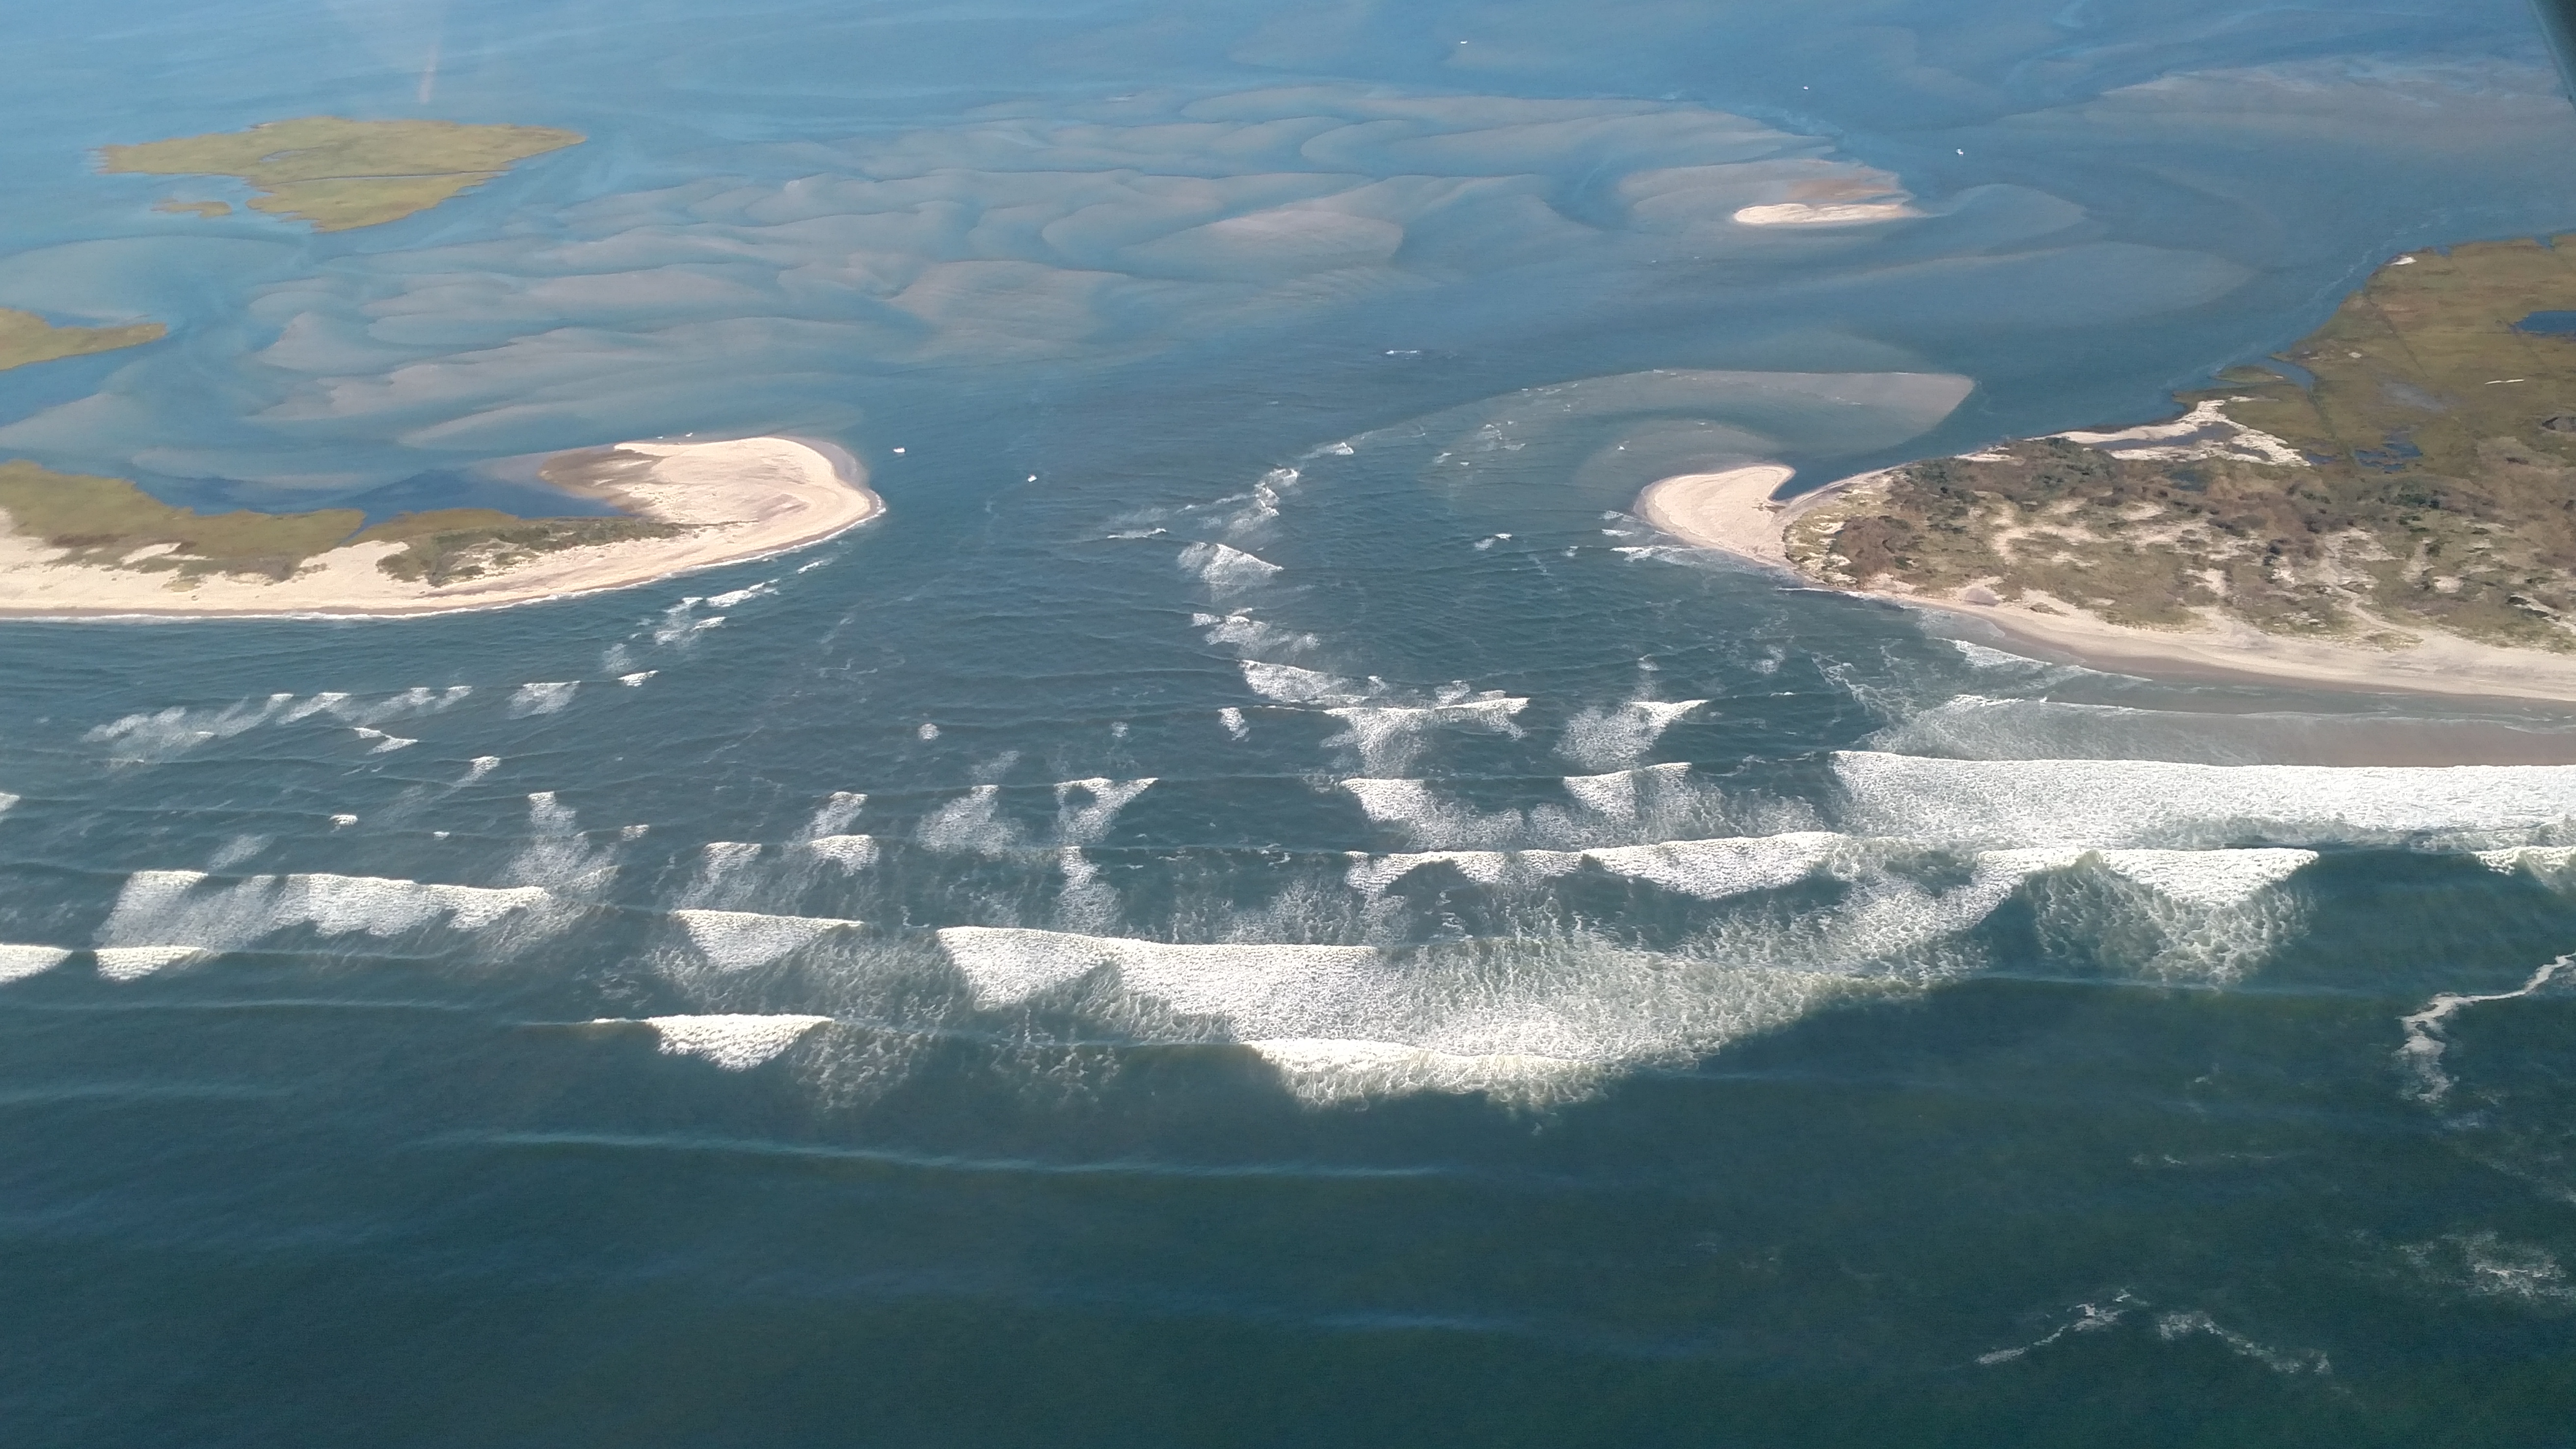 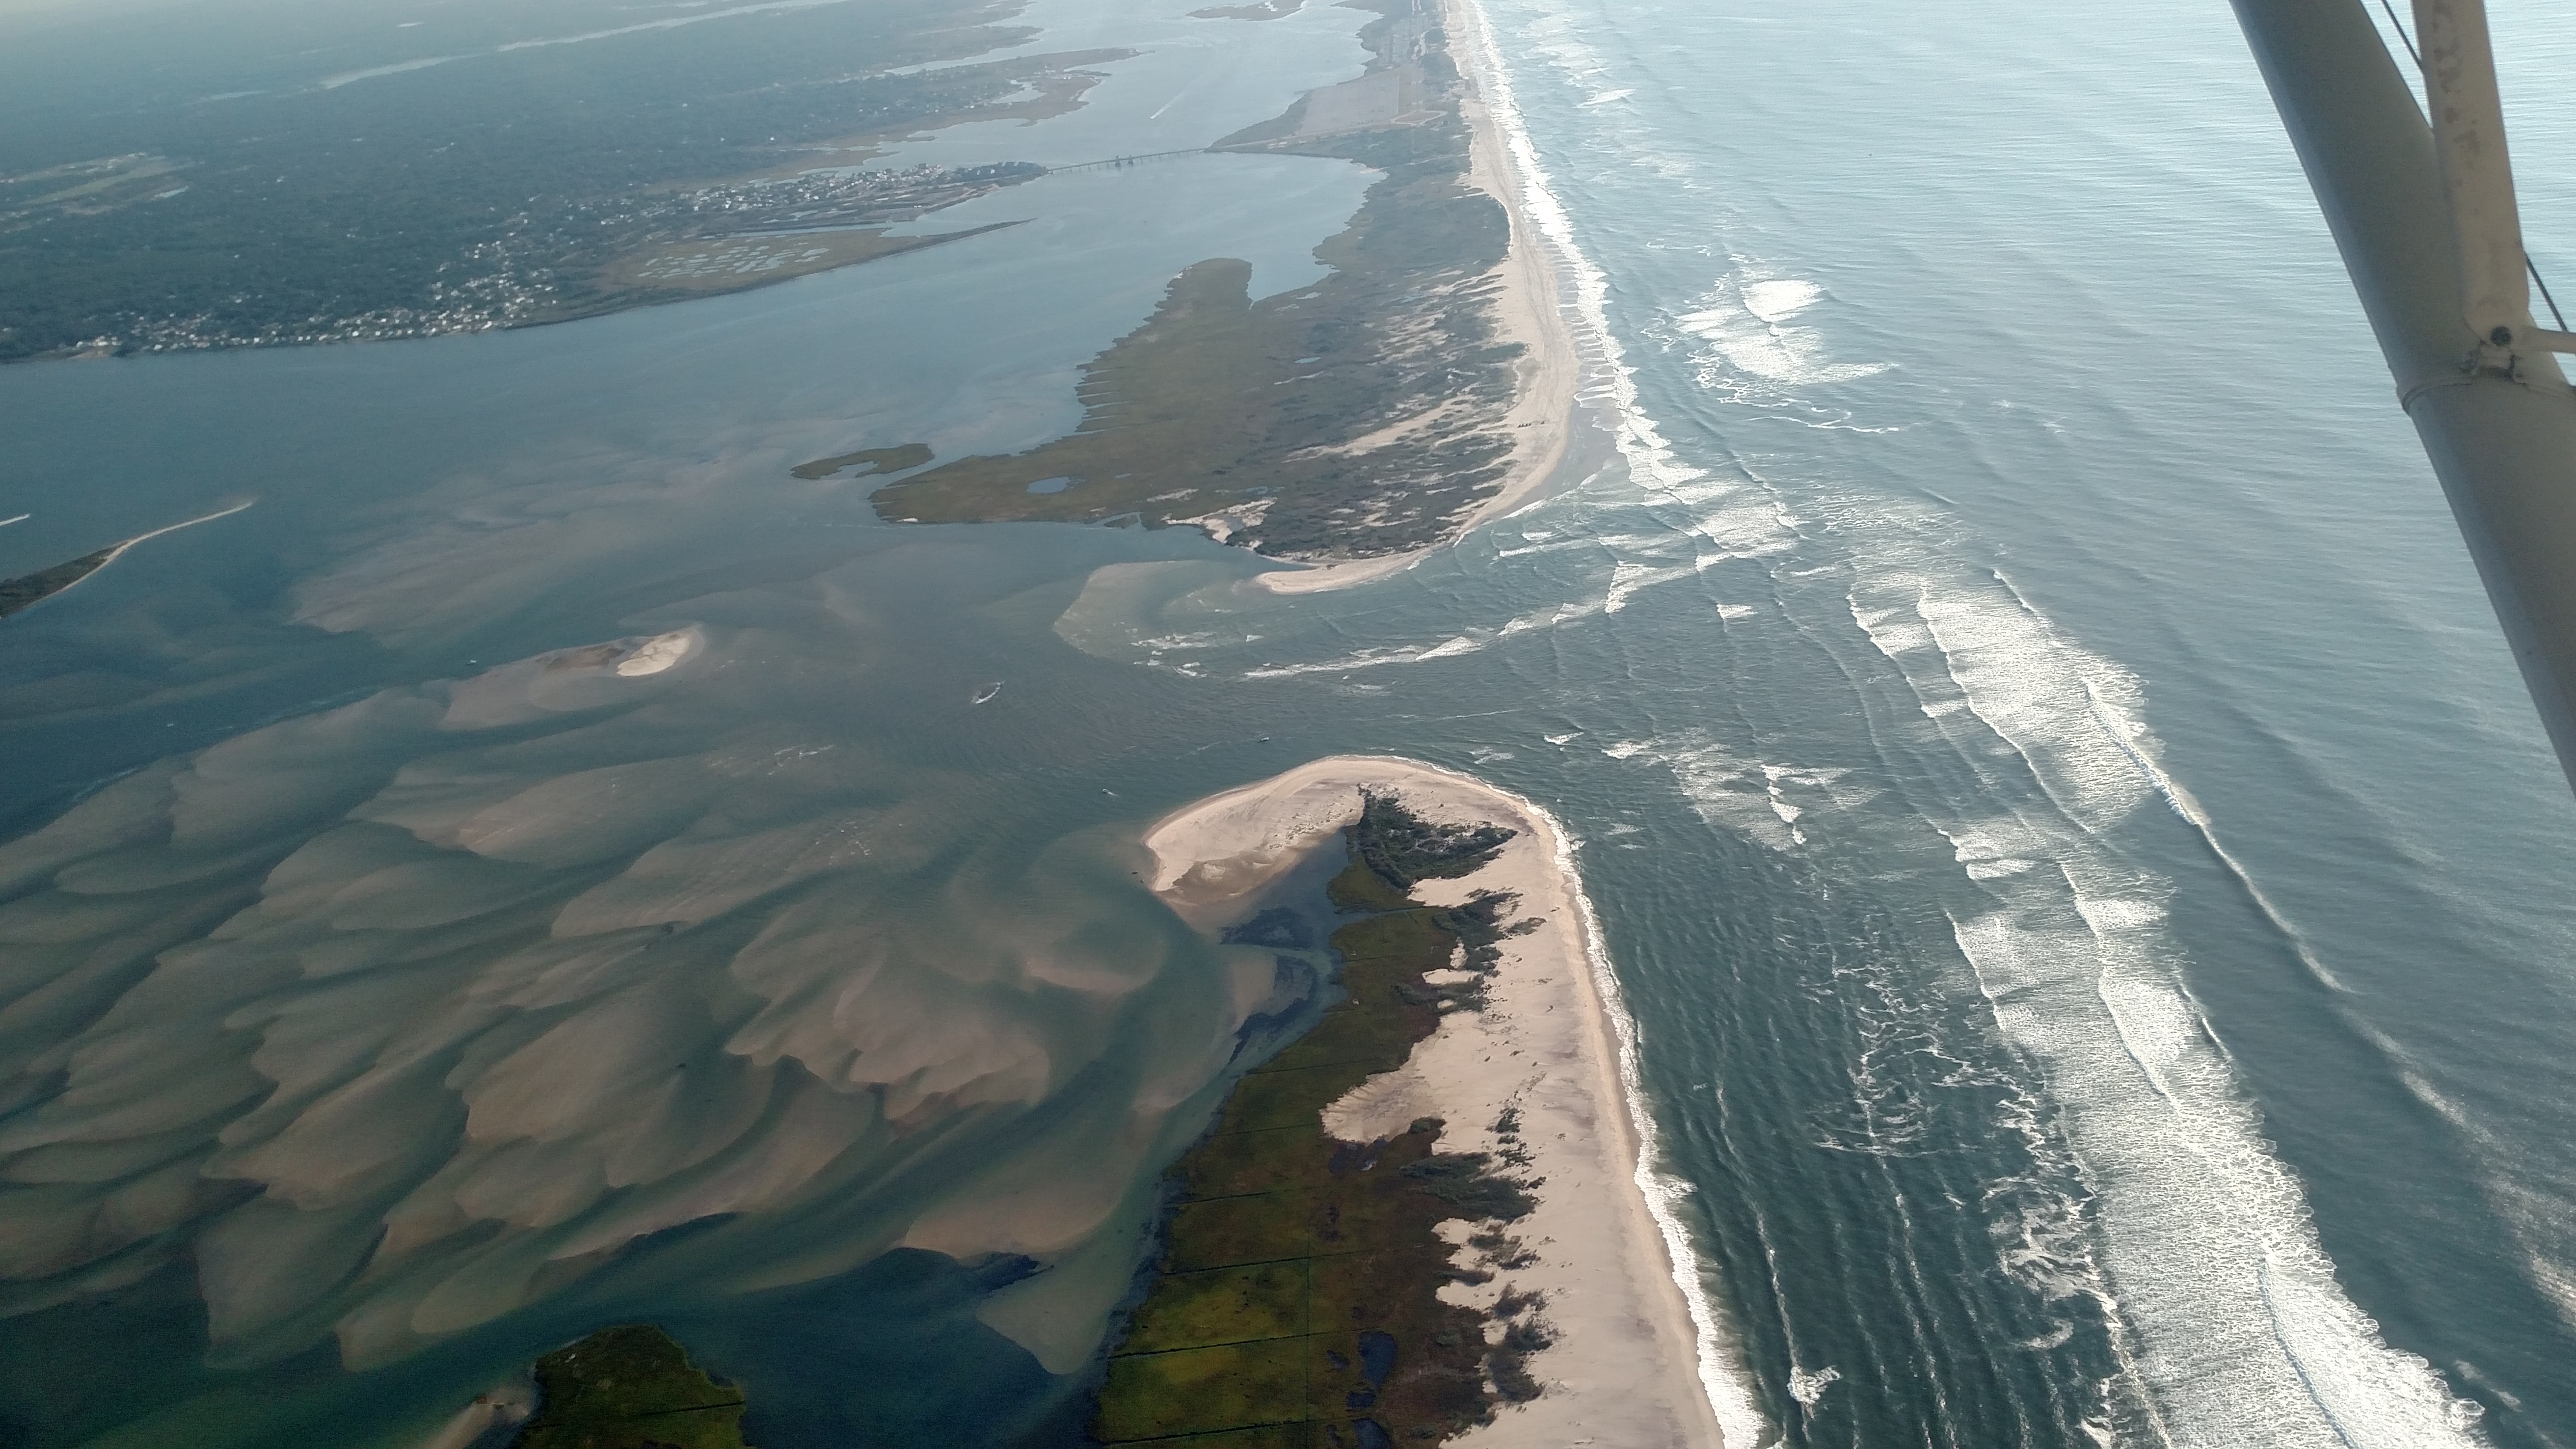 |
Oct 20, 2017 (CF)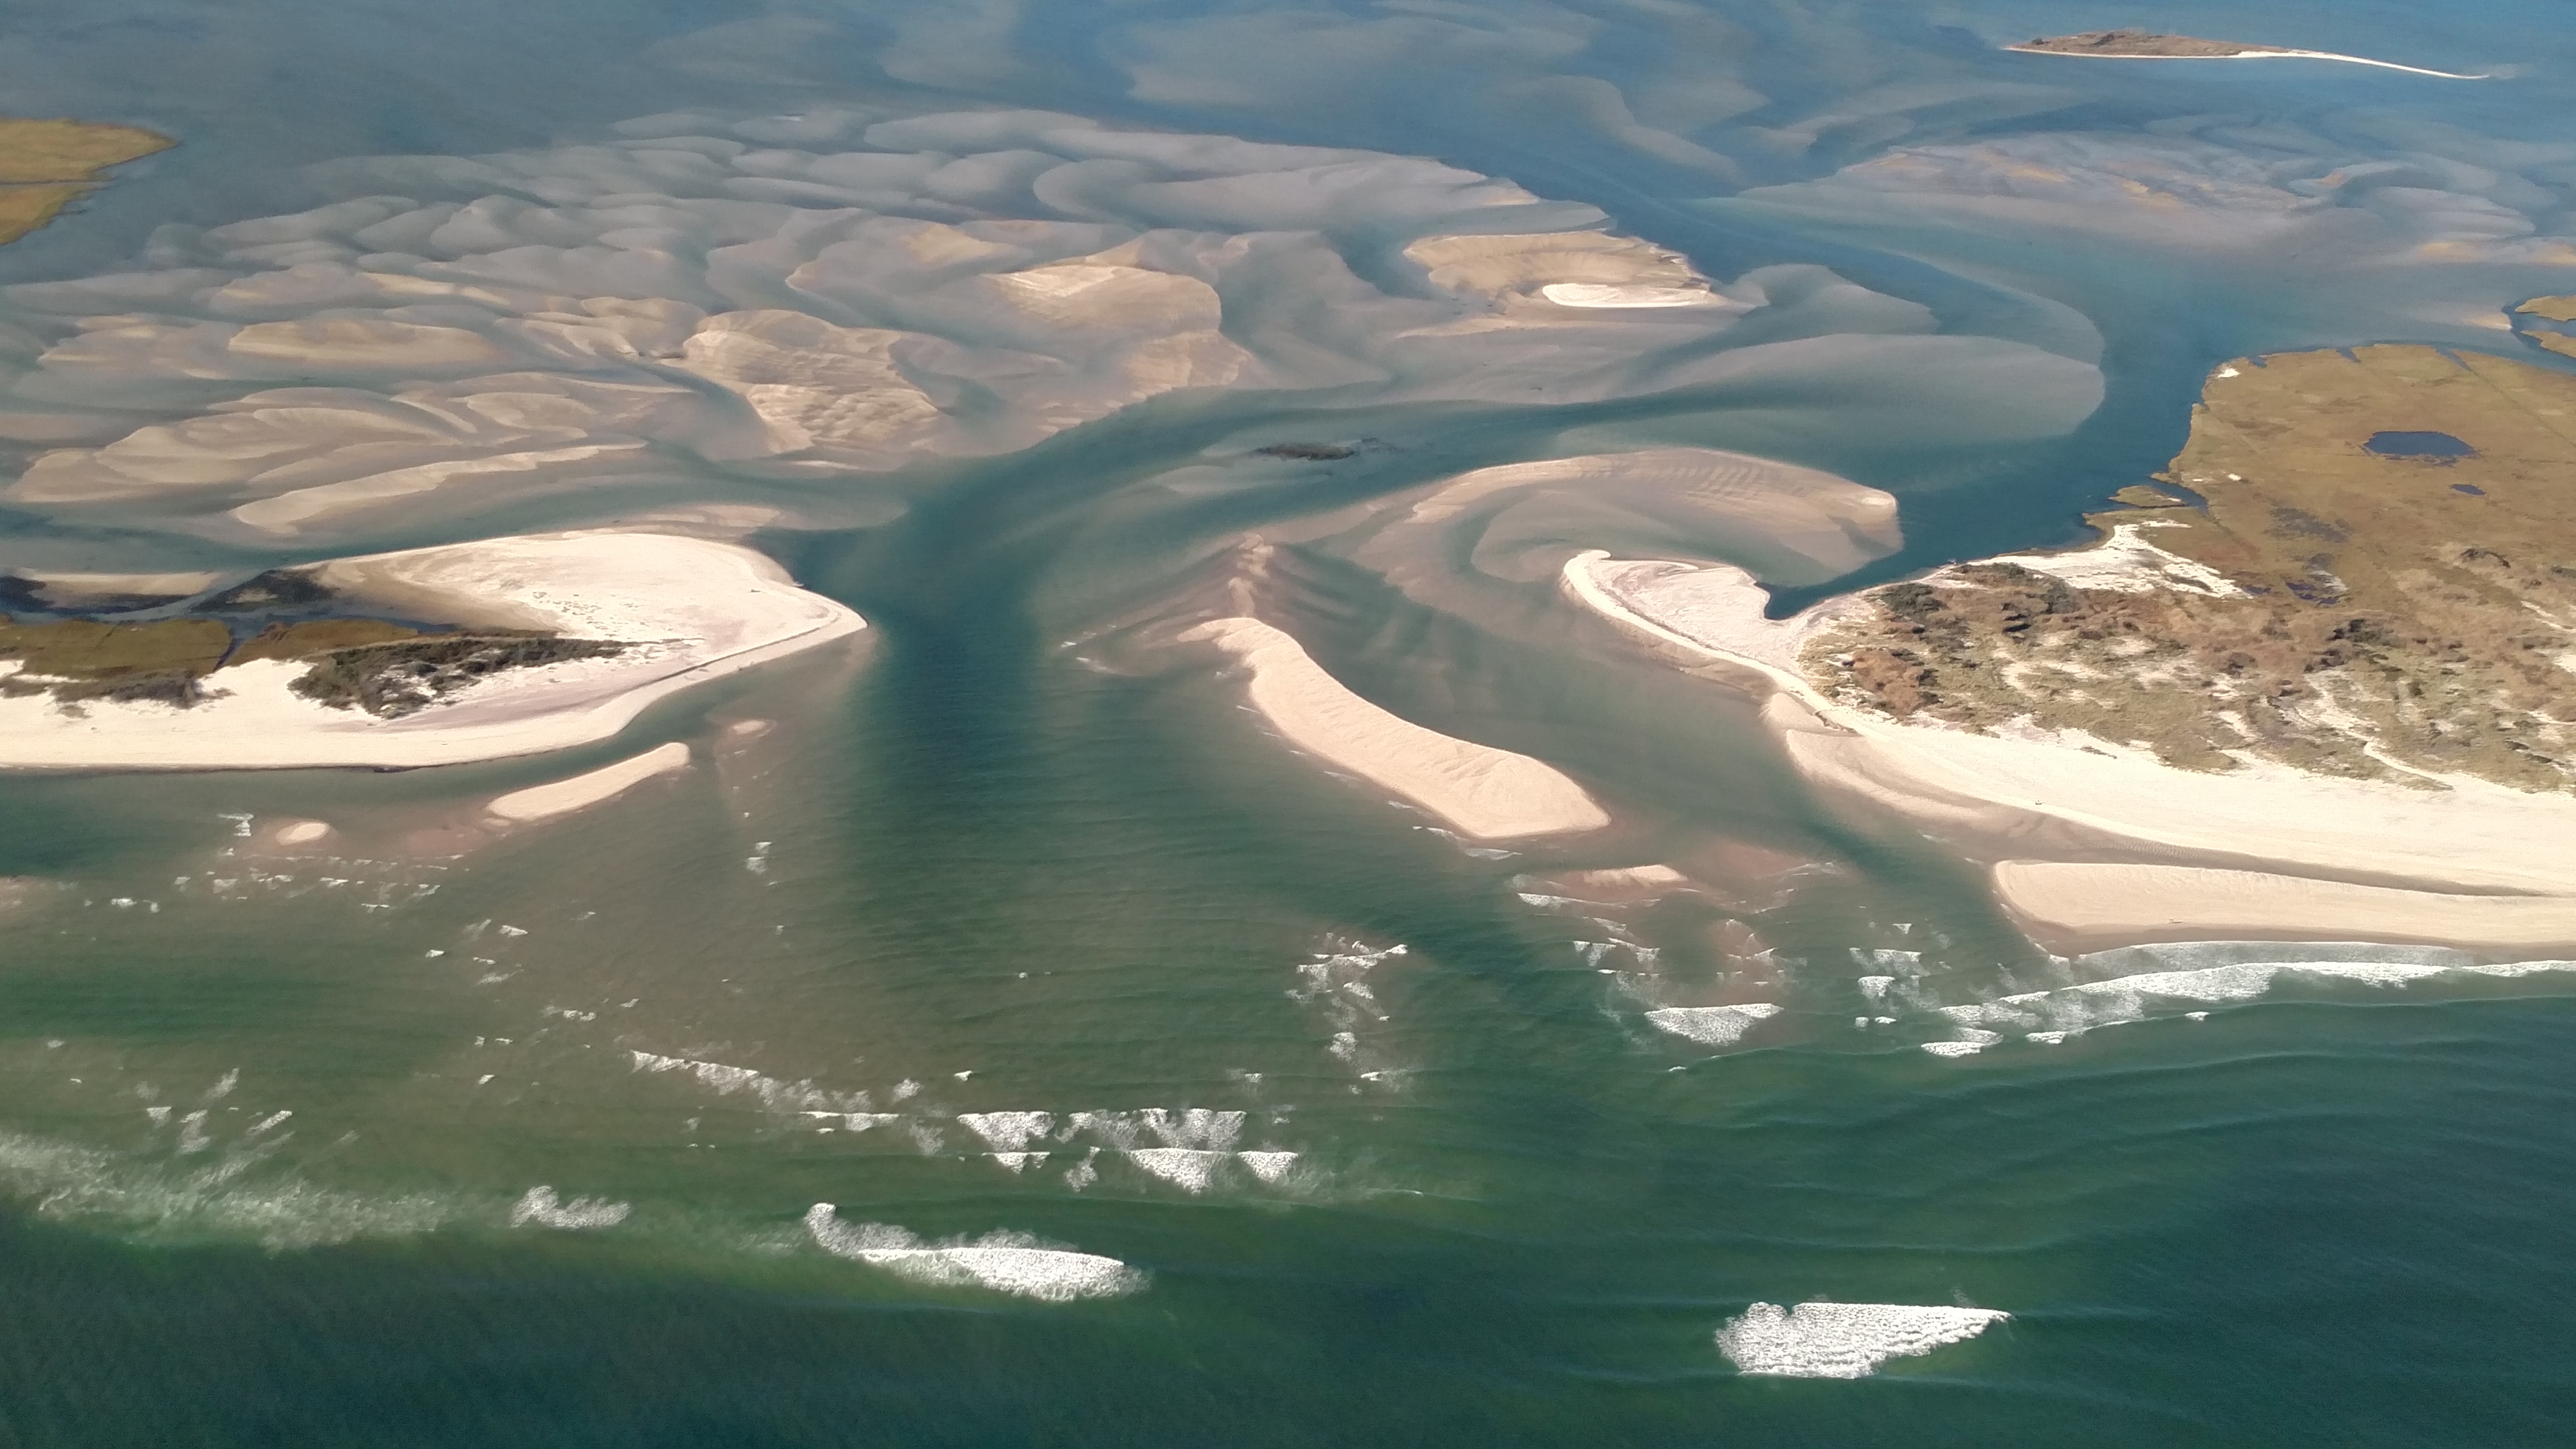 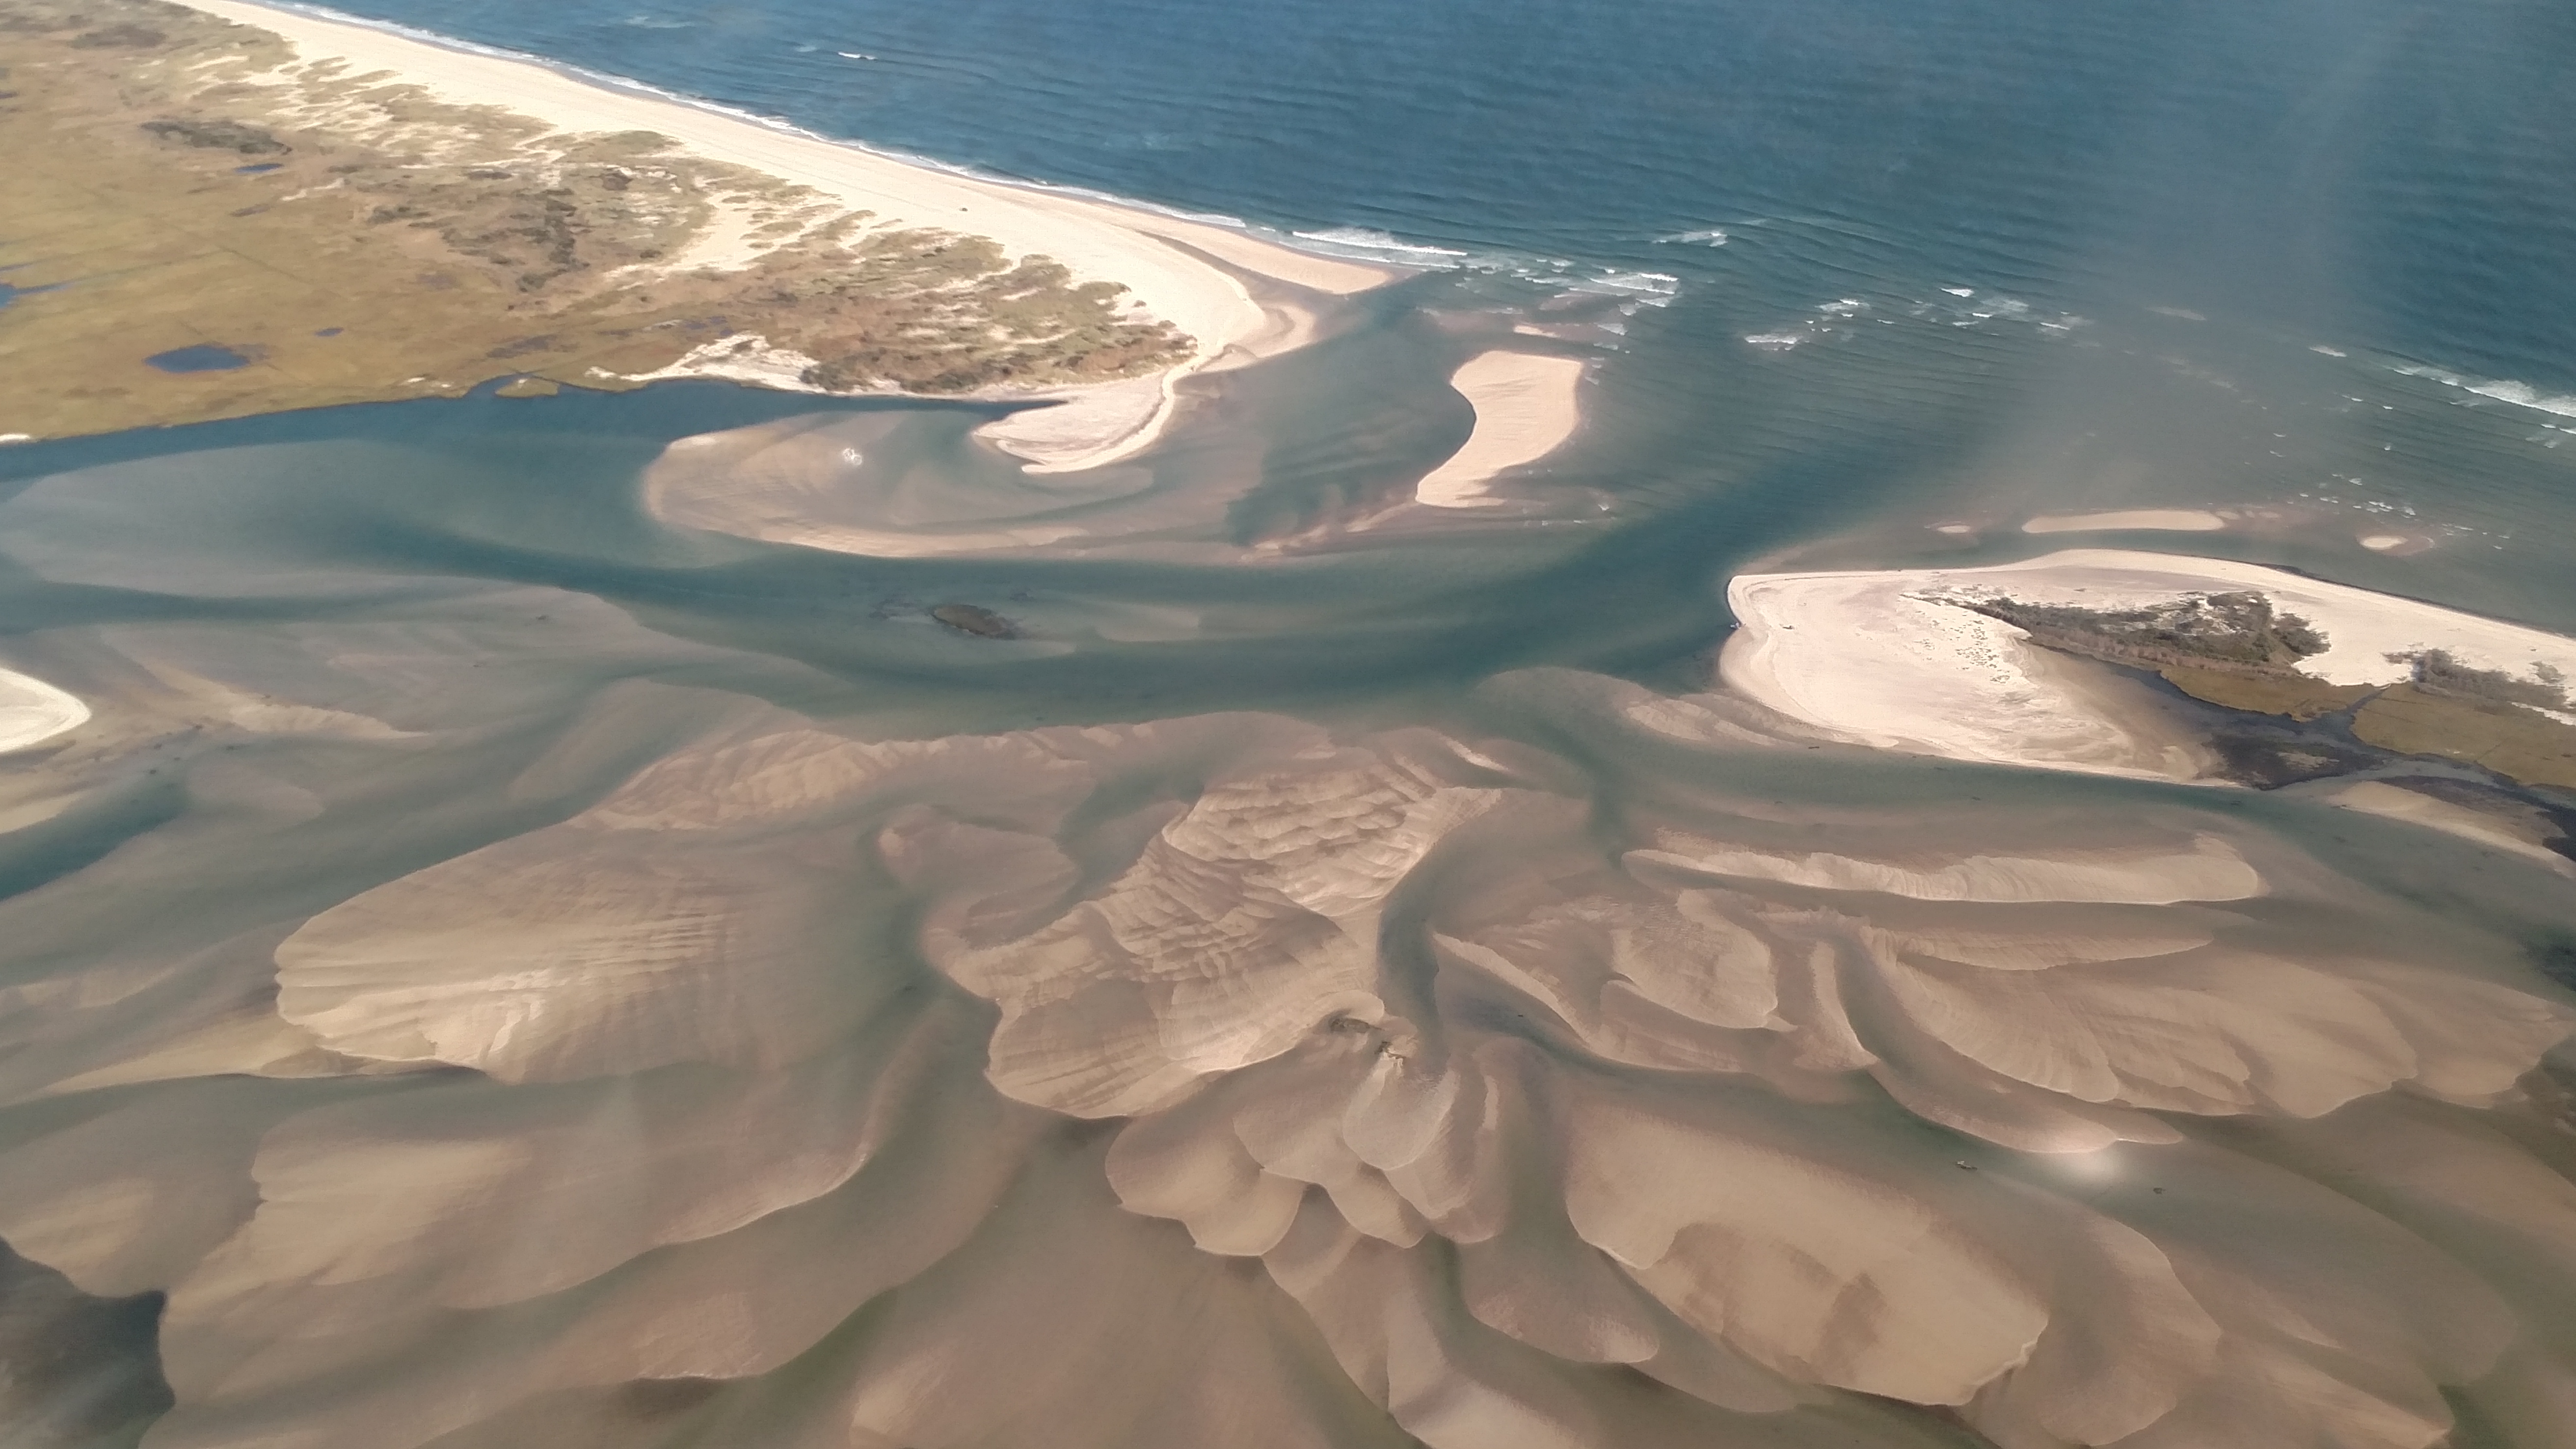 |
||||
Nov 20, 2017 (CF)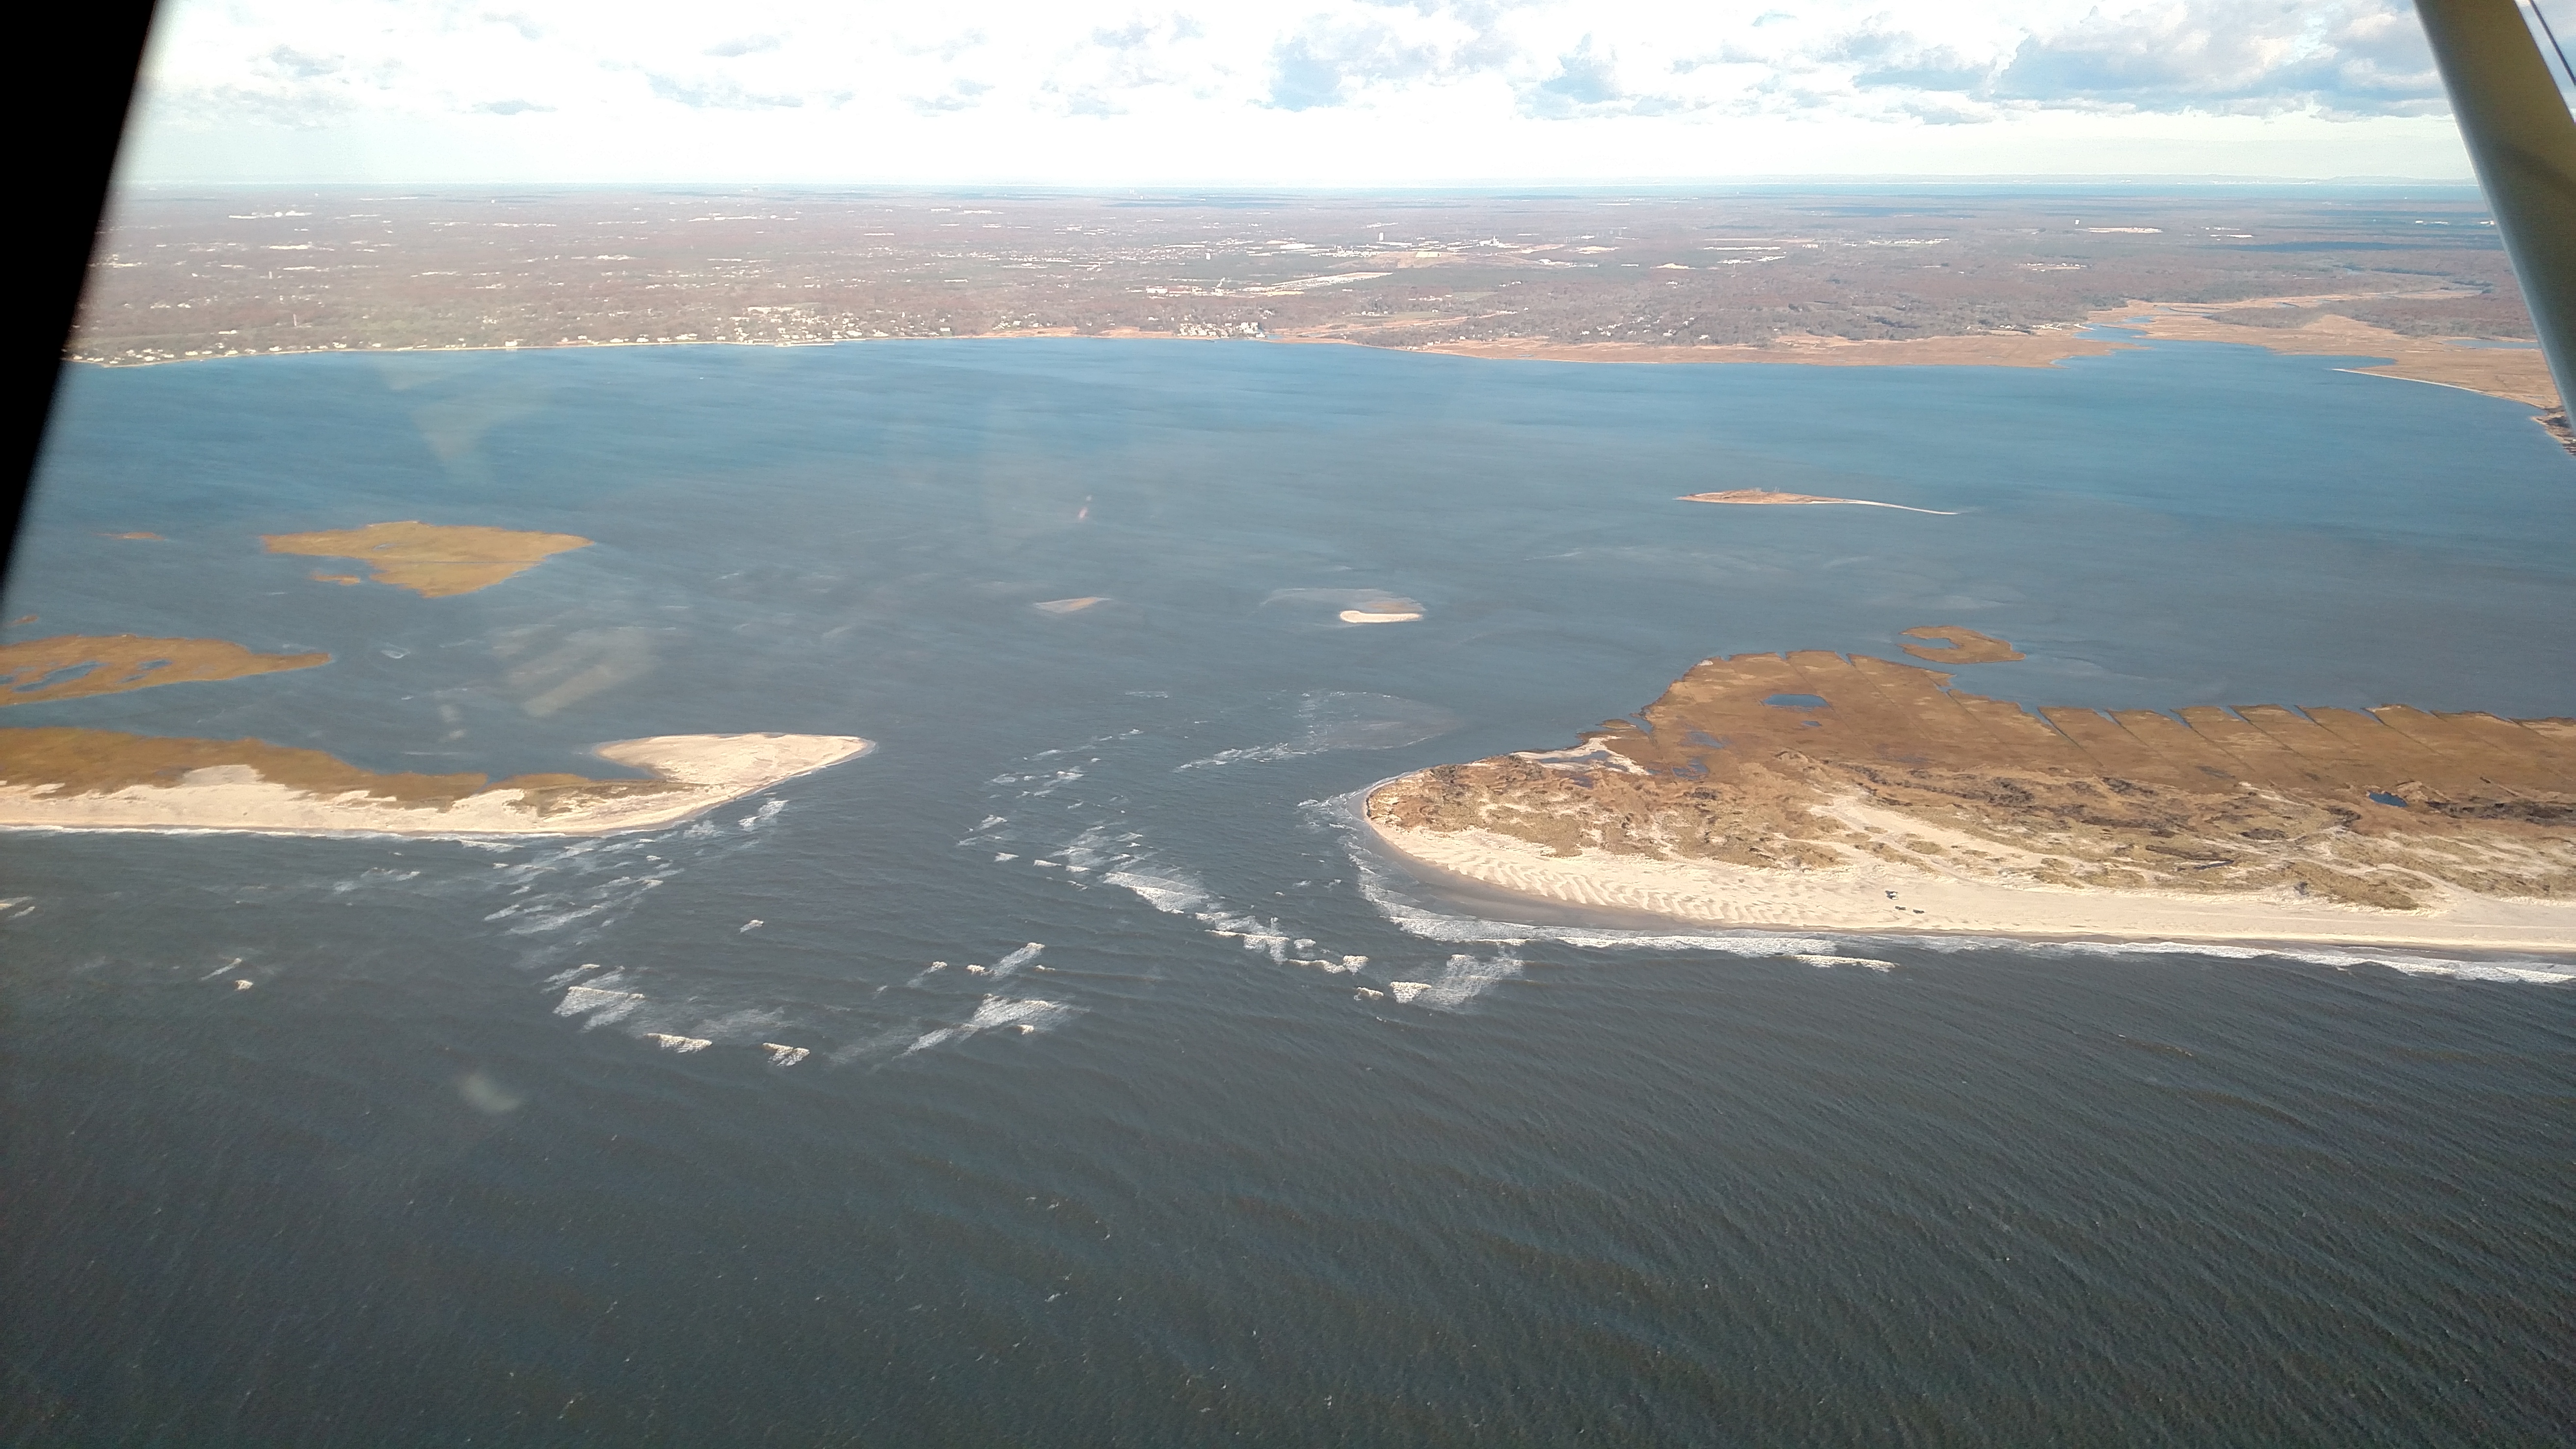 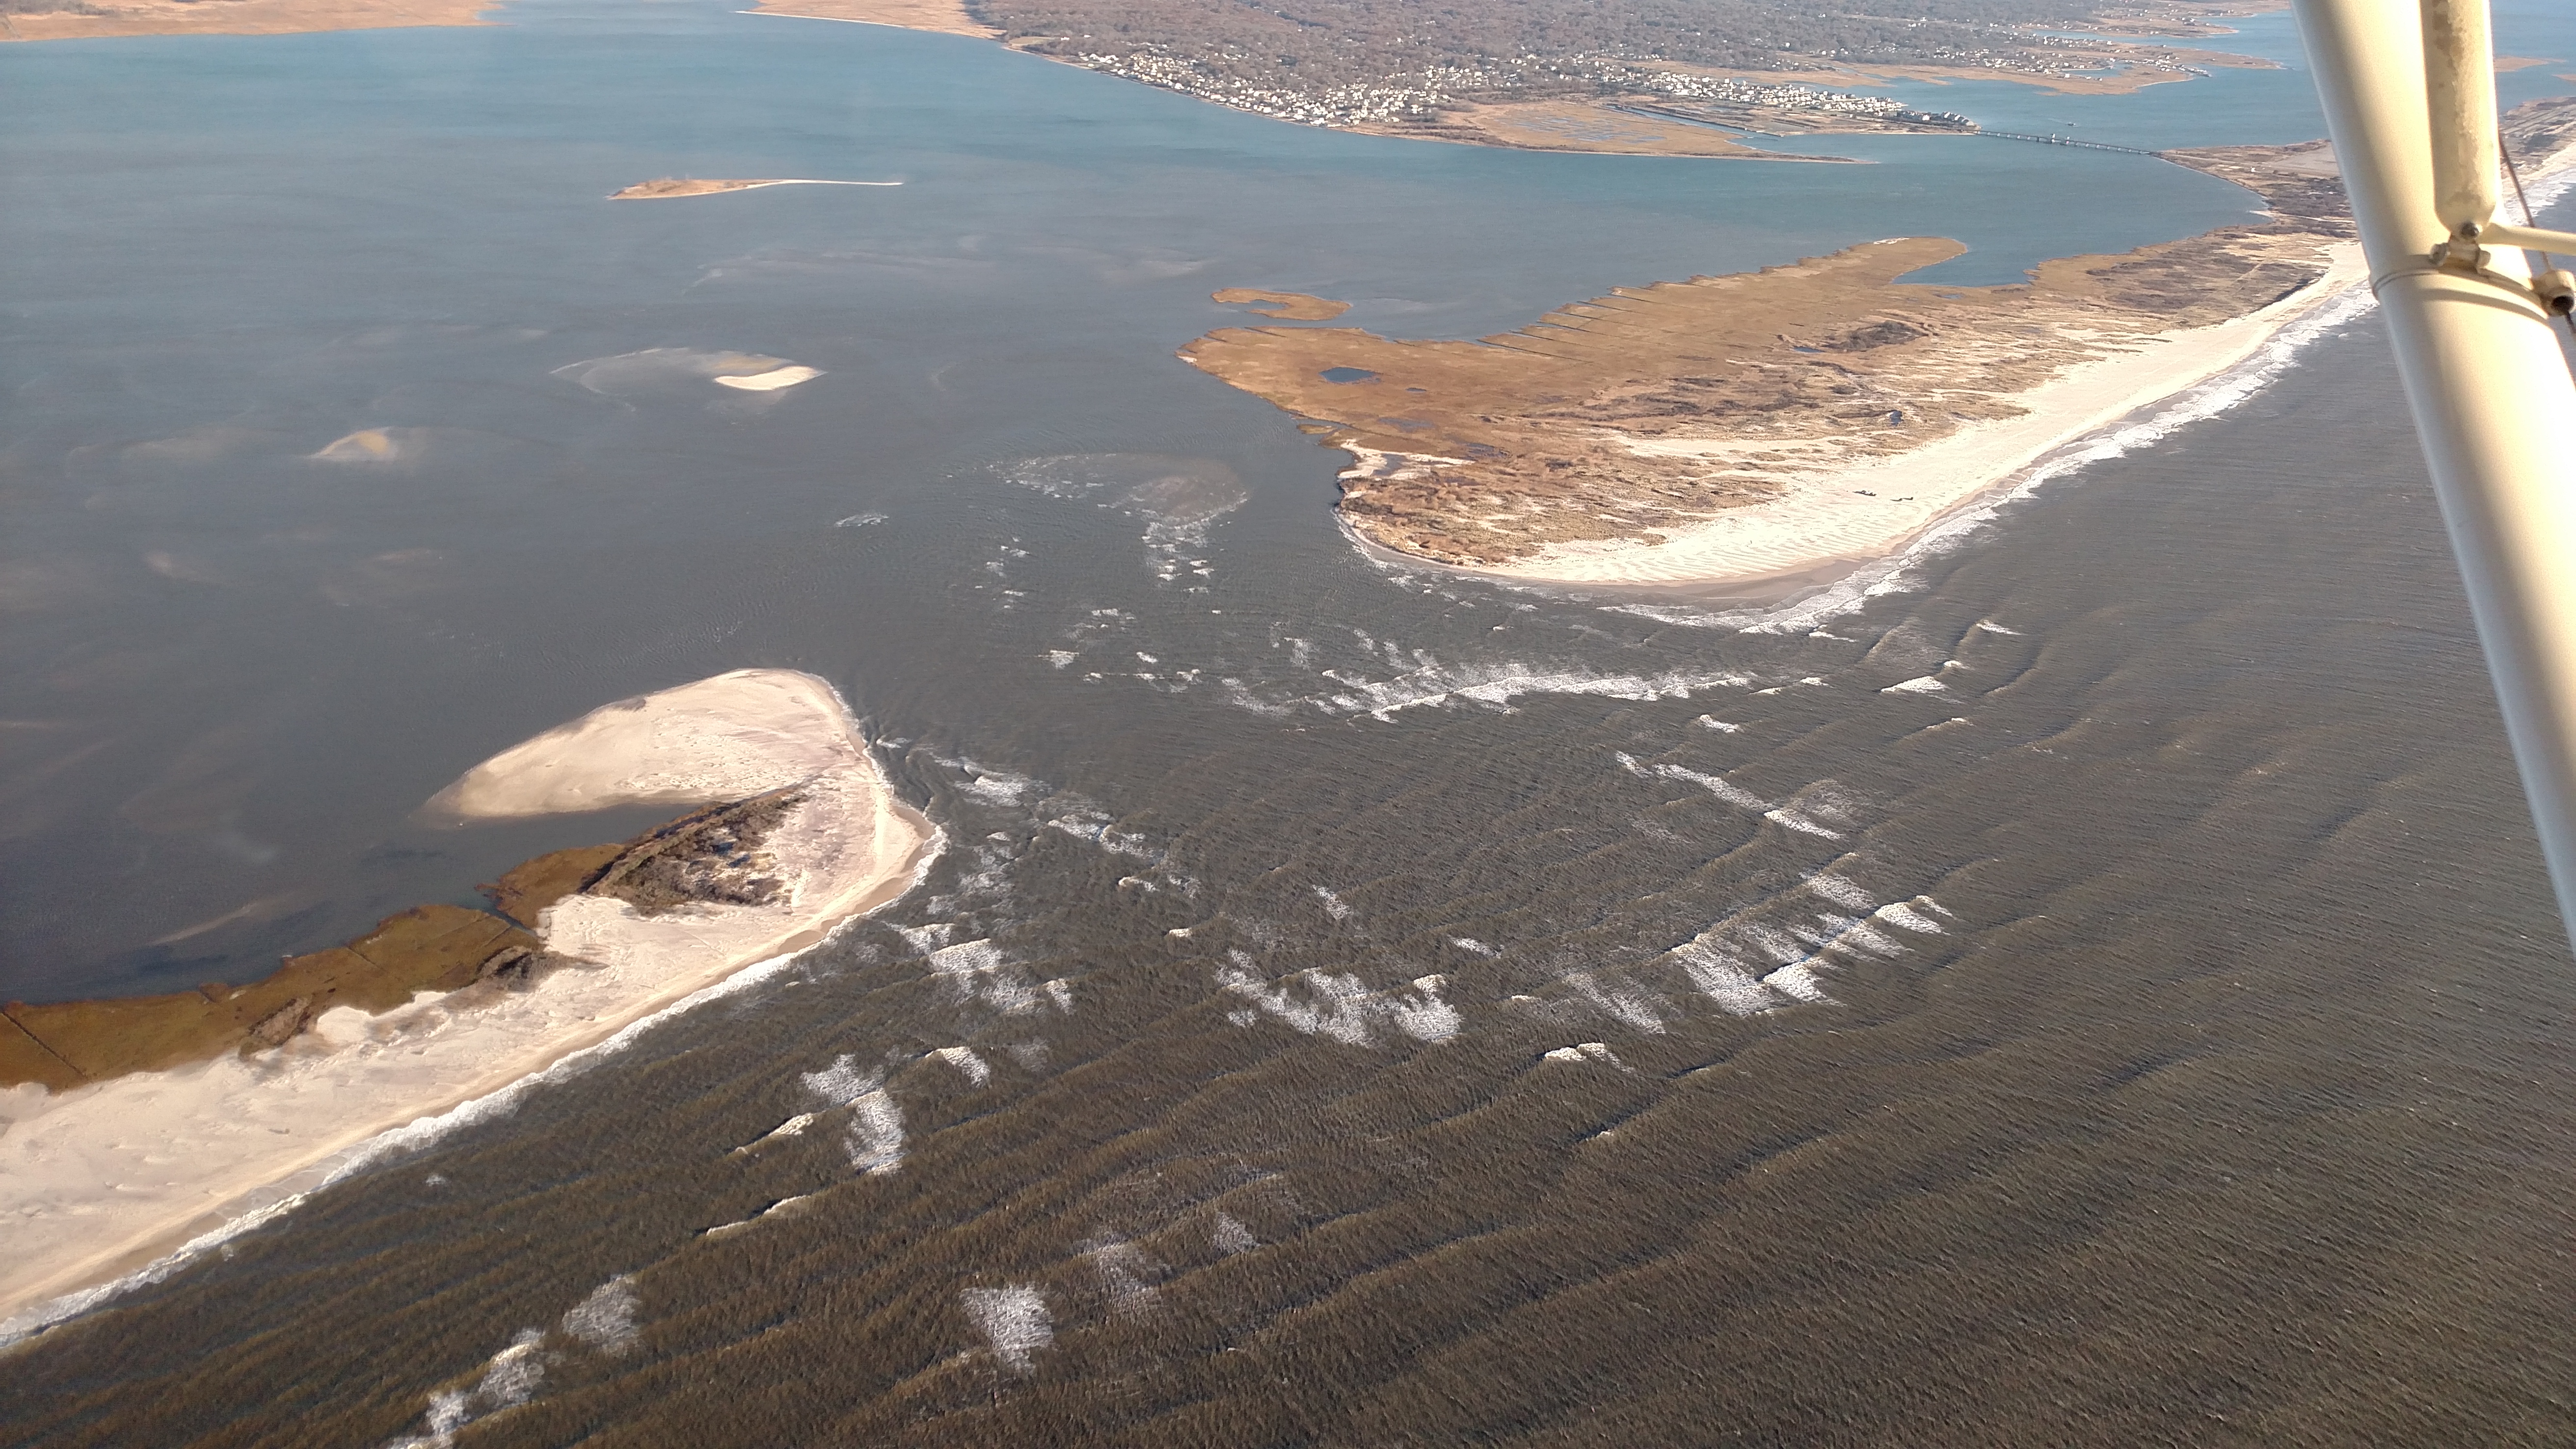 |
Nov 28, 2017 (CF)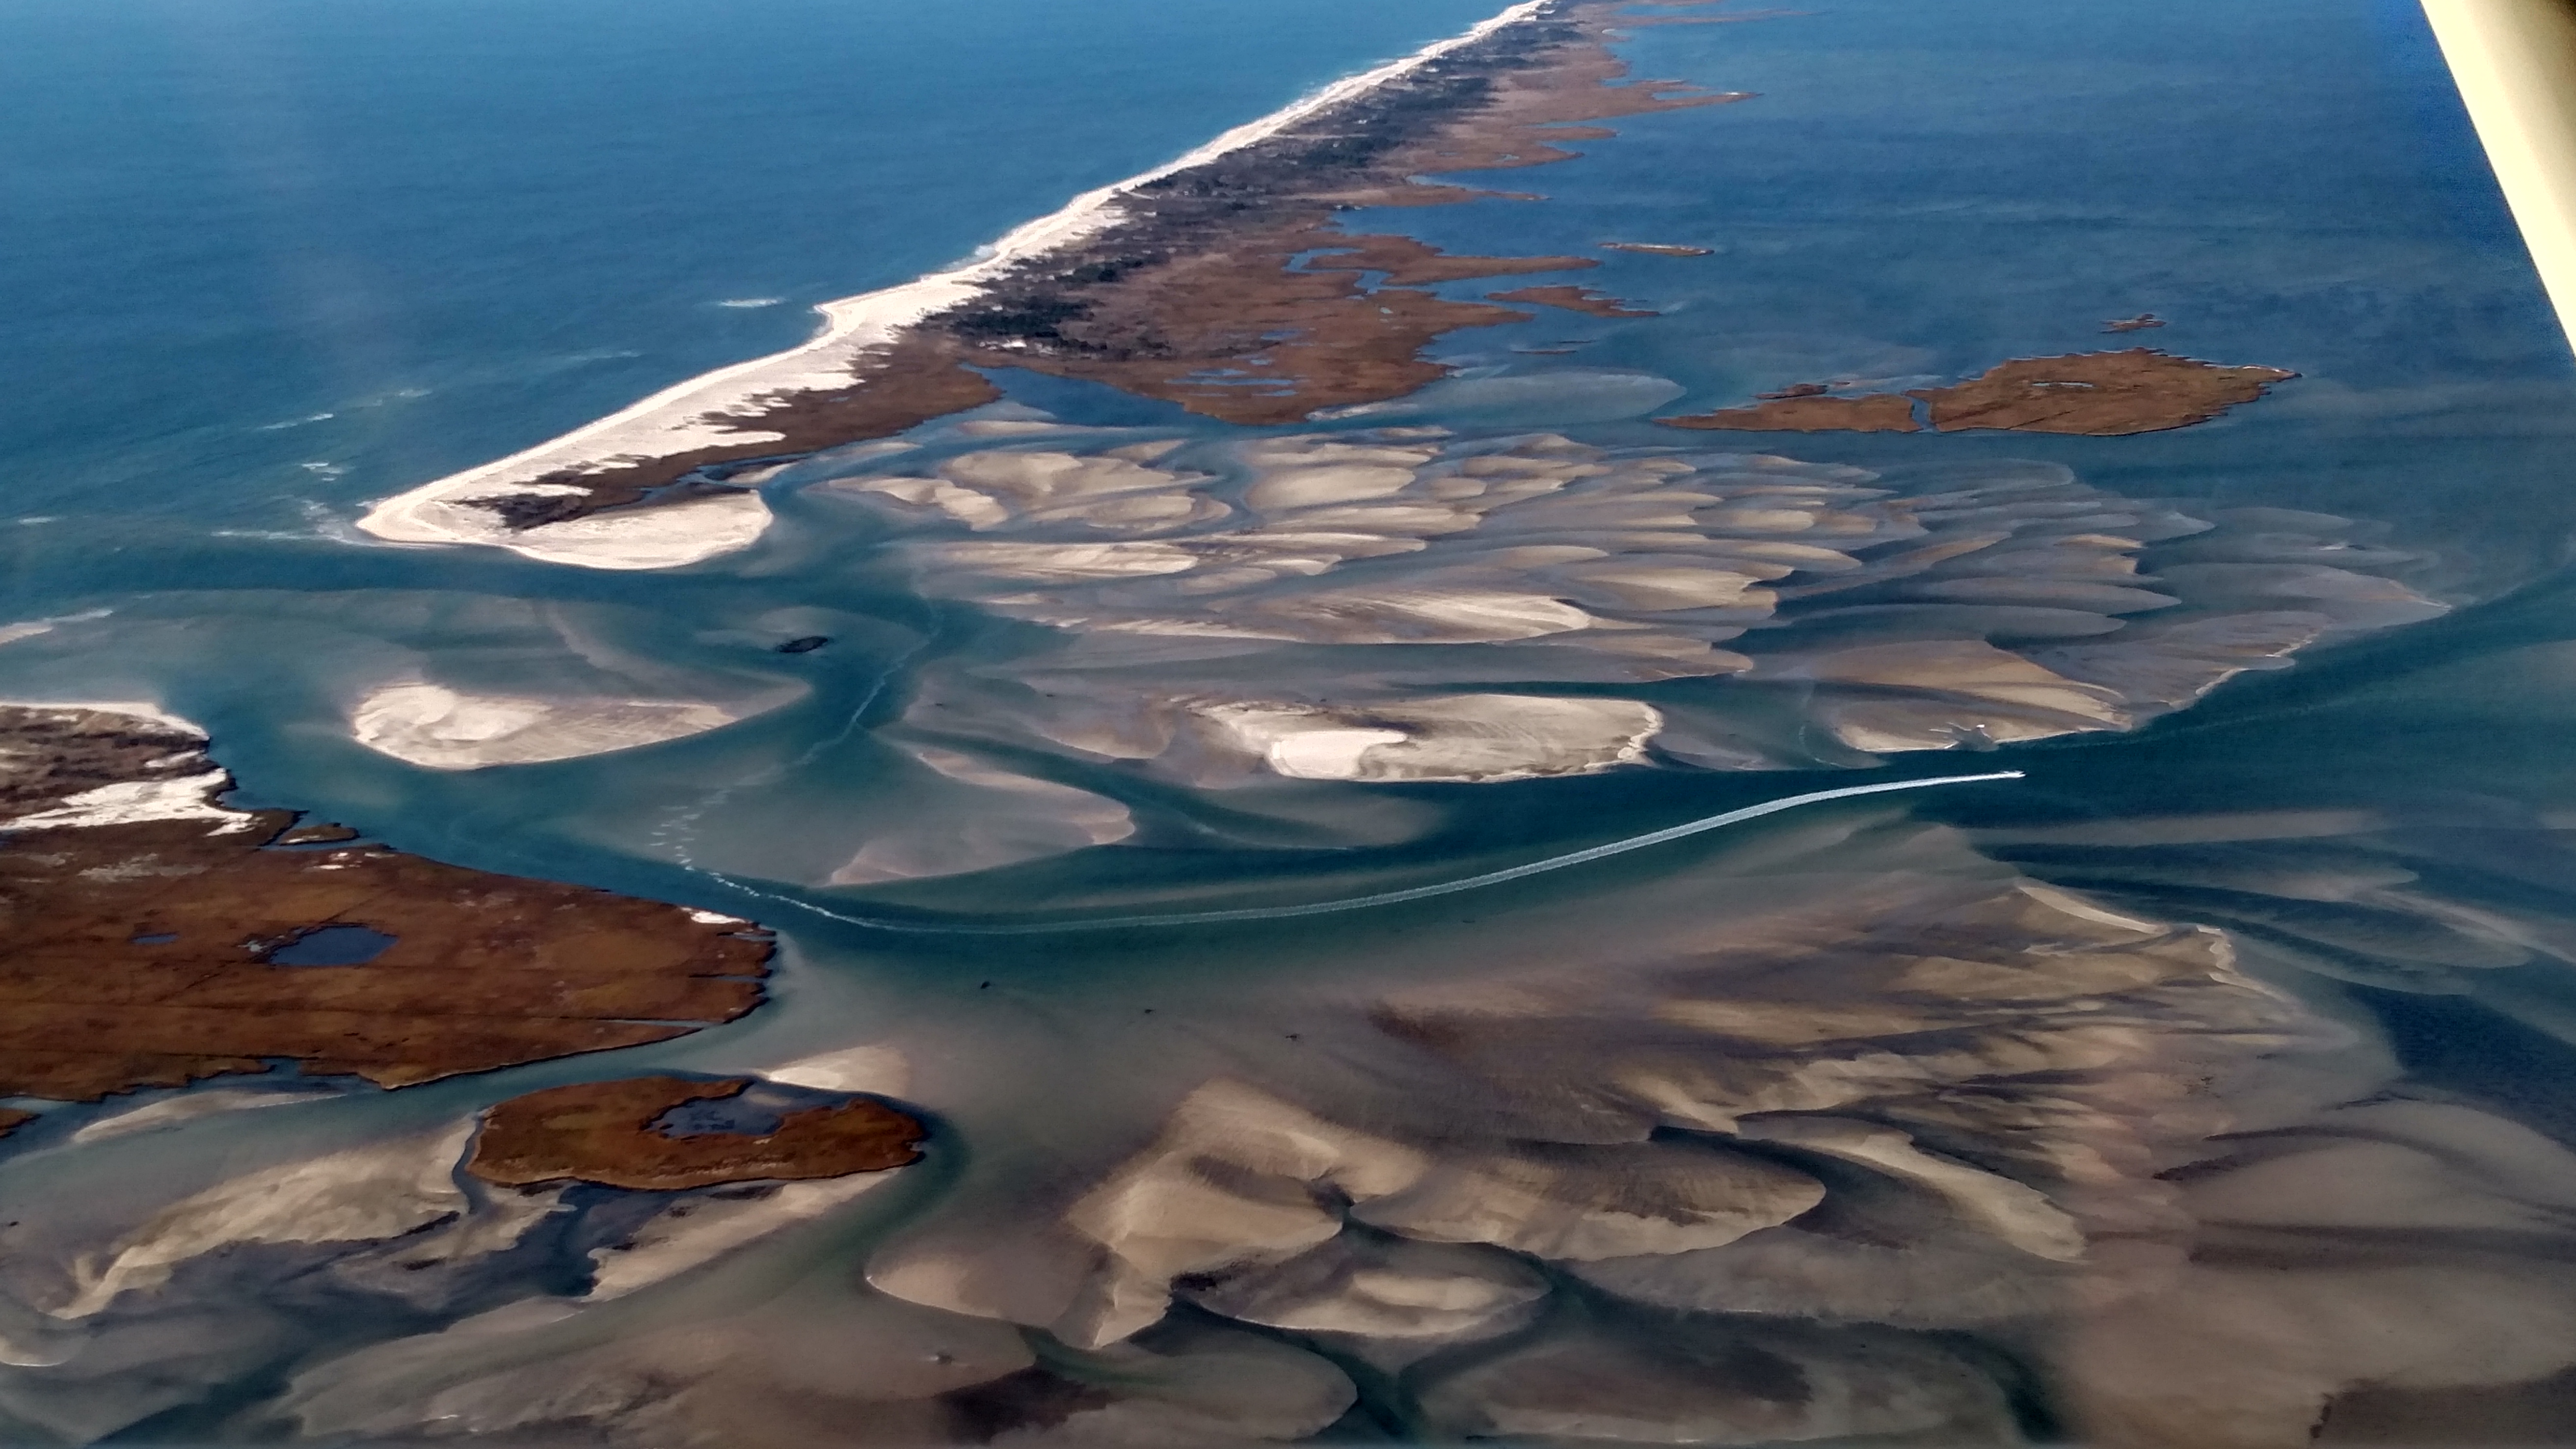 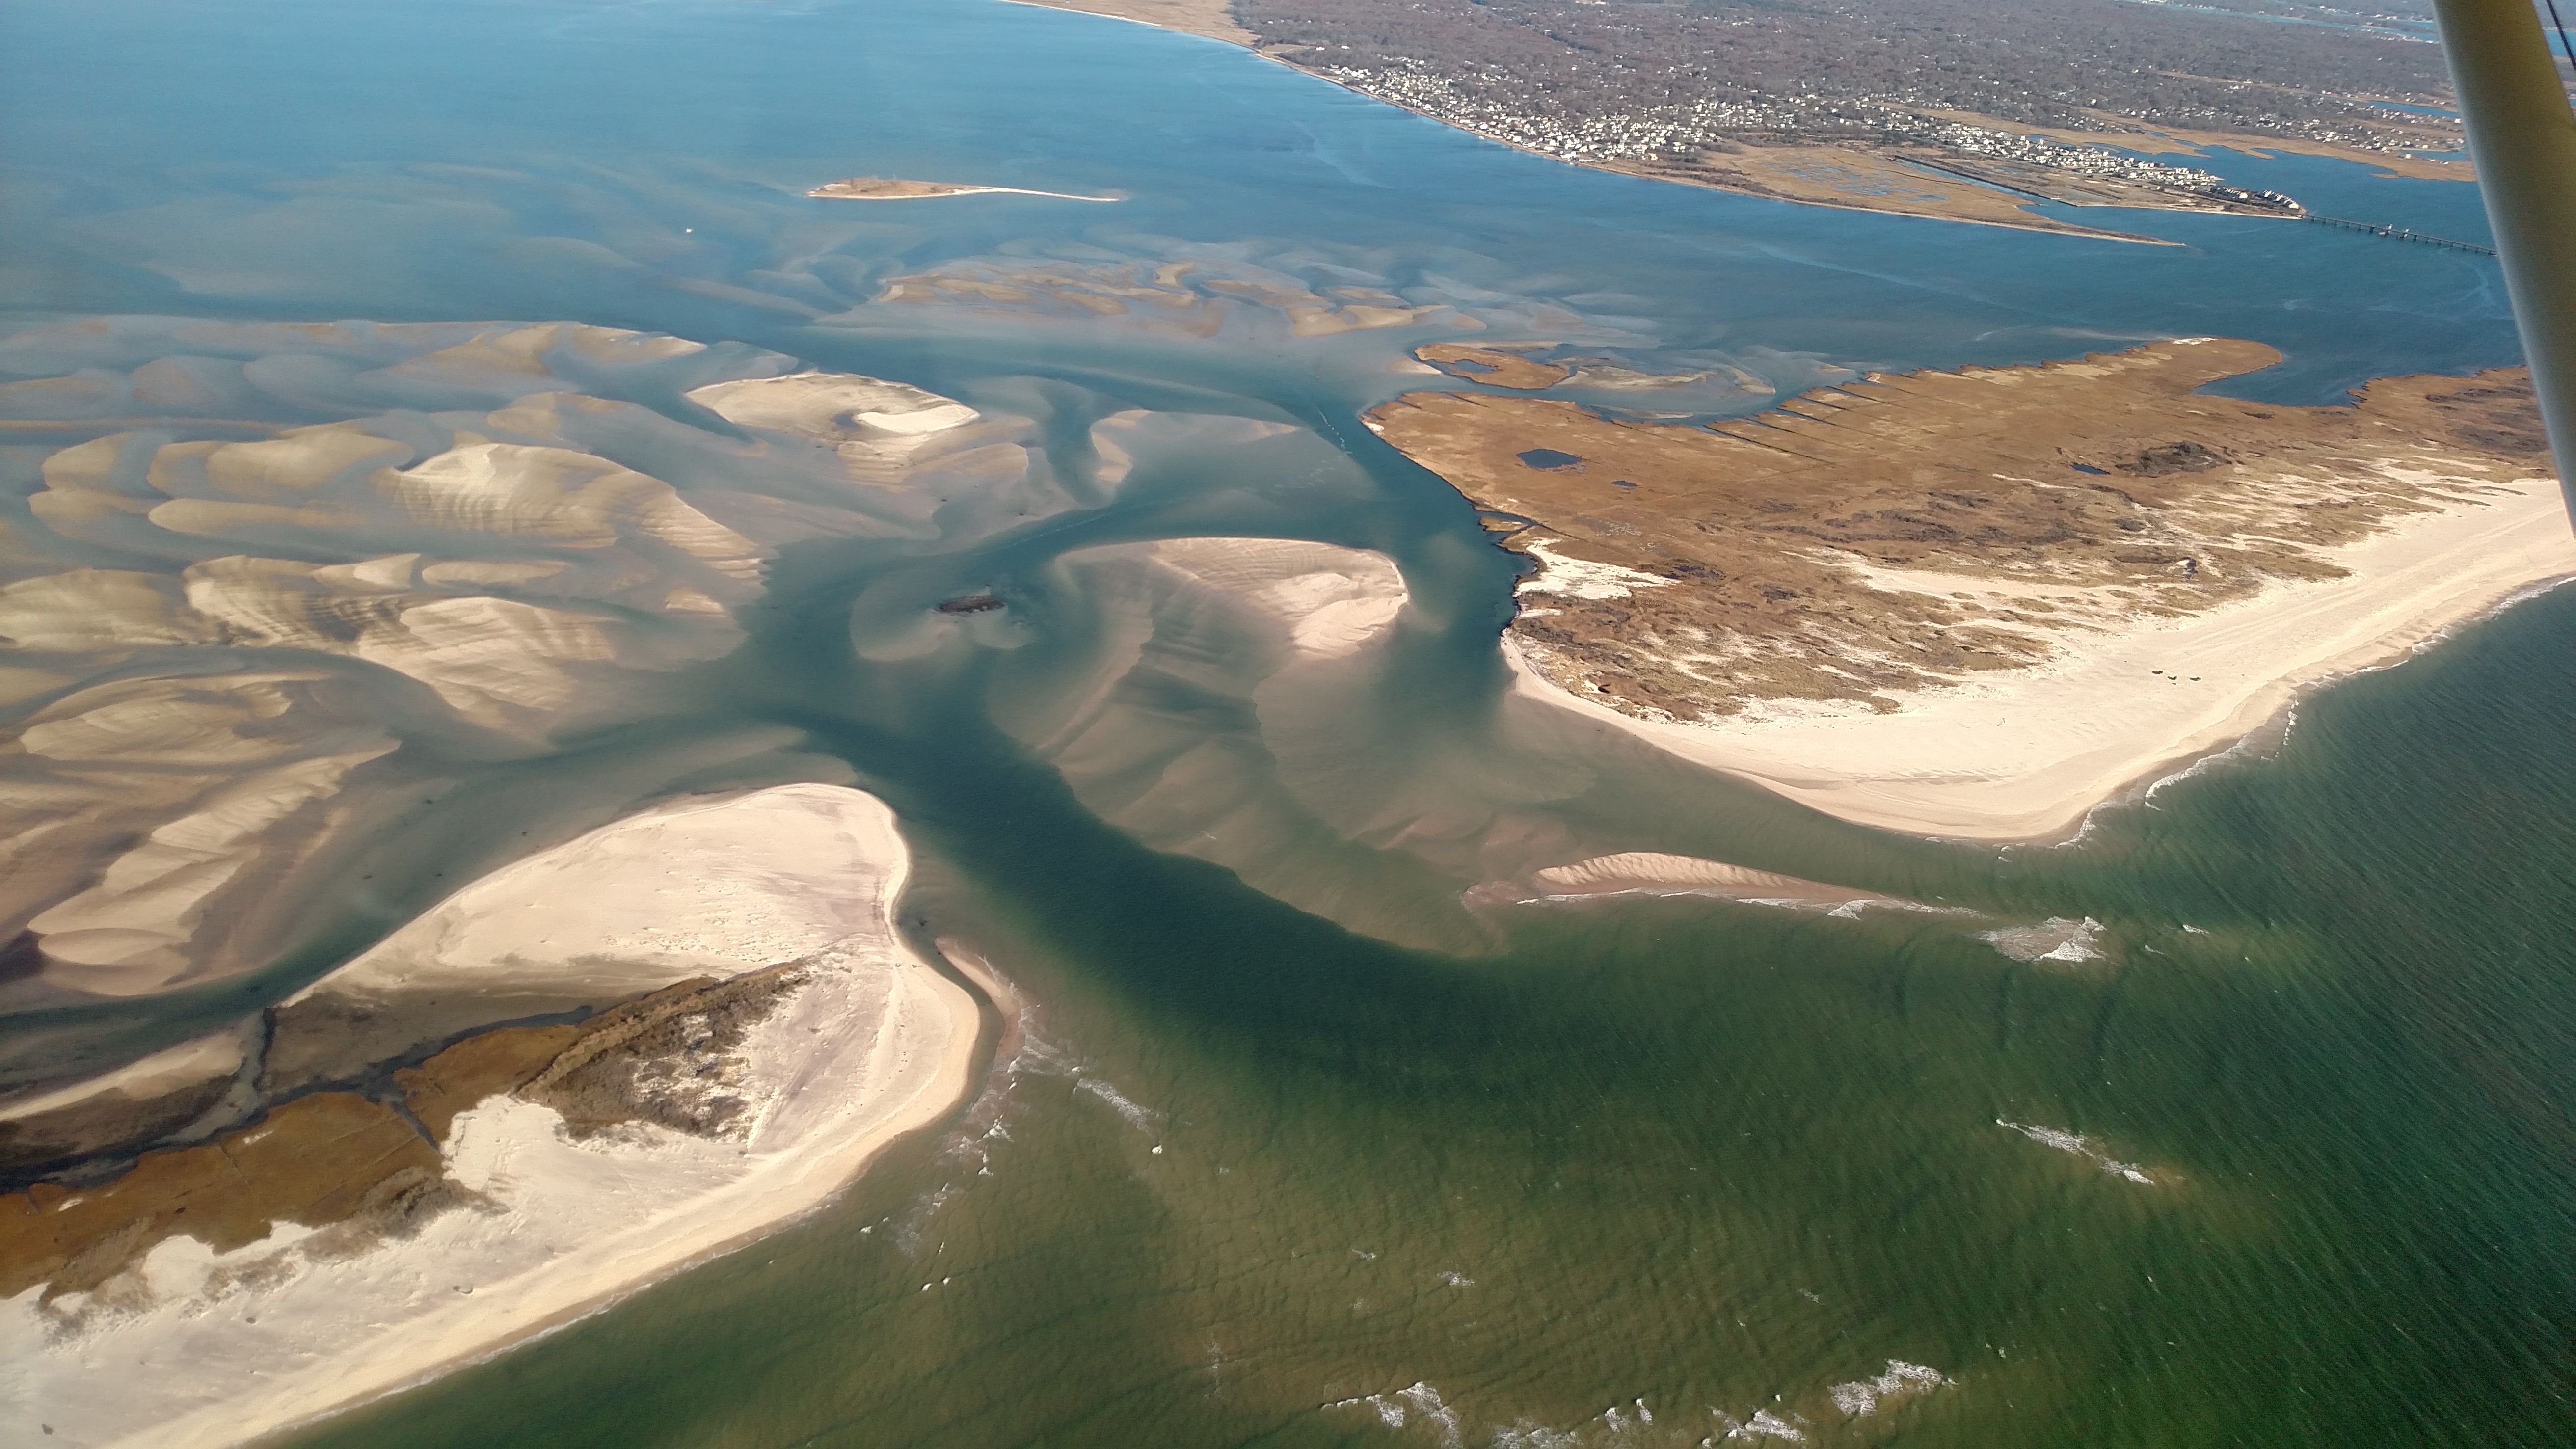 |
Jan 27, 2018 (CF)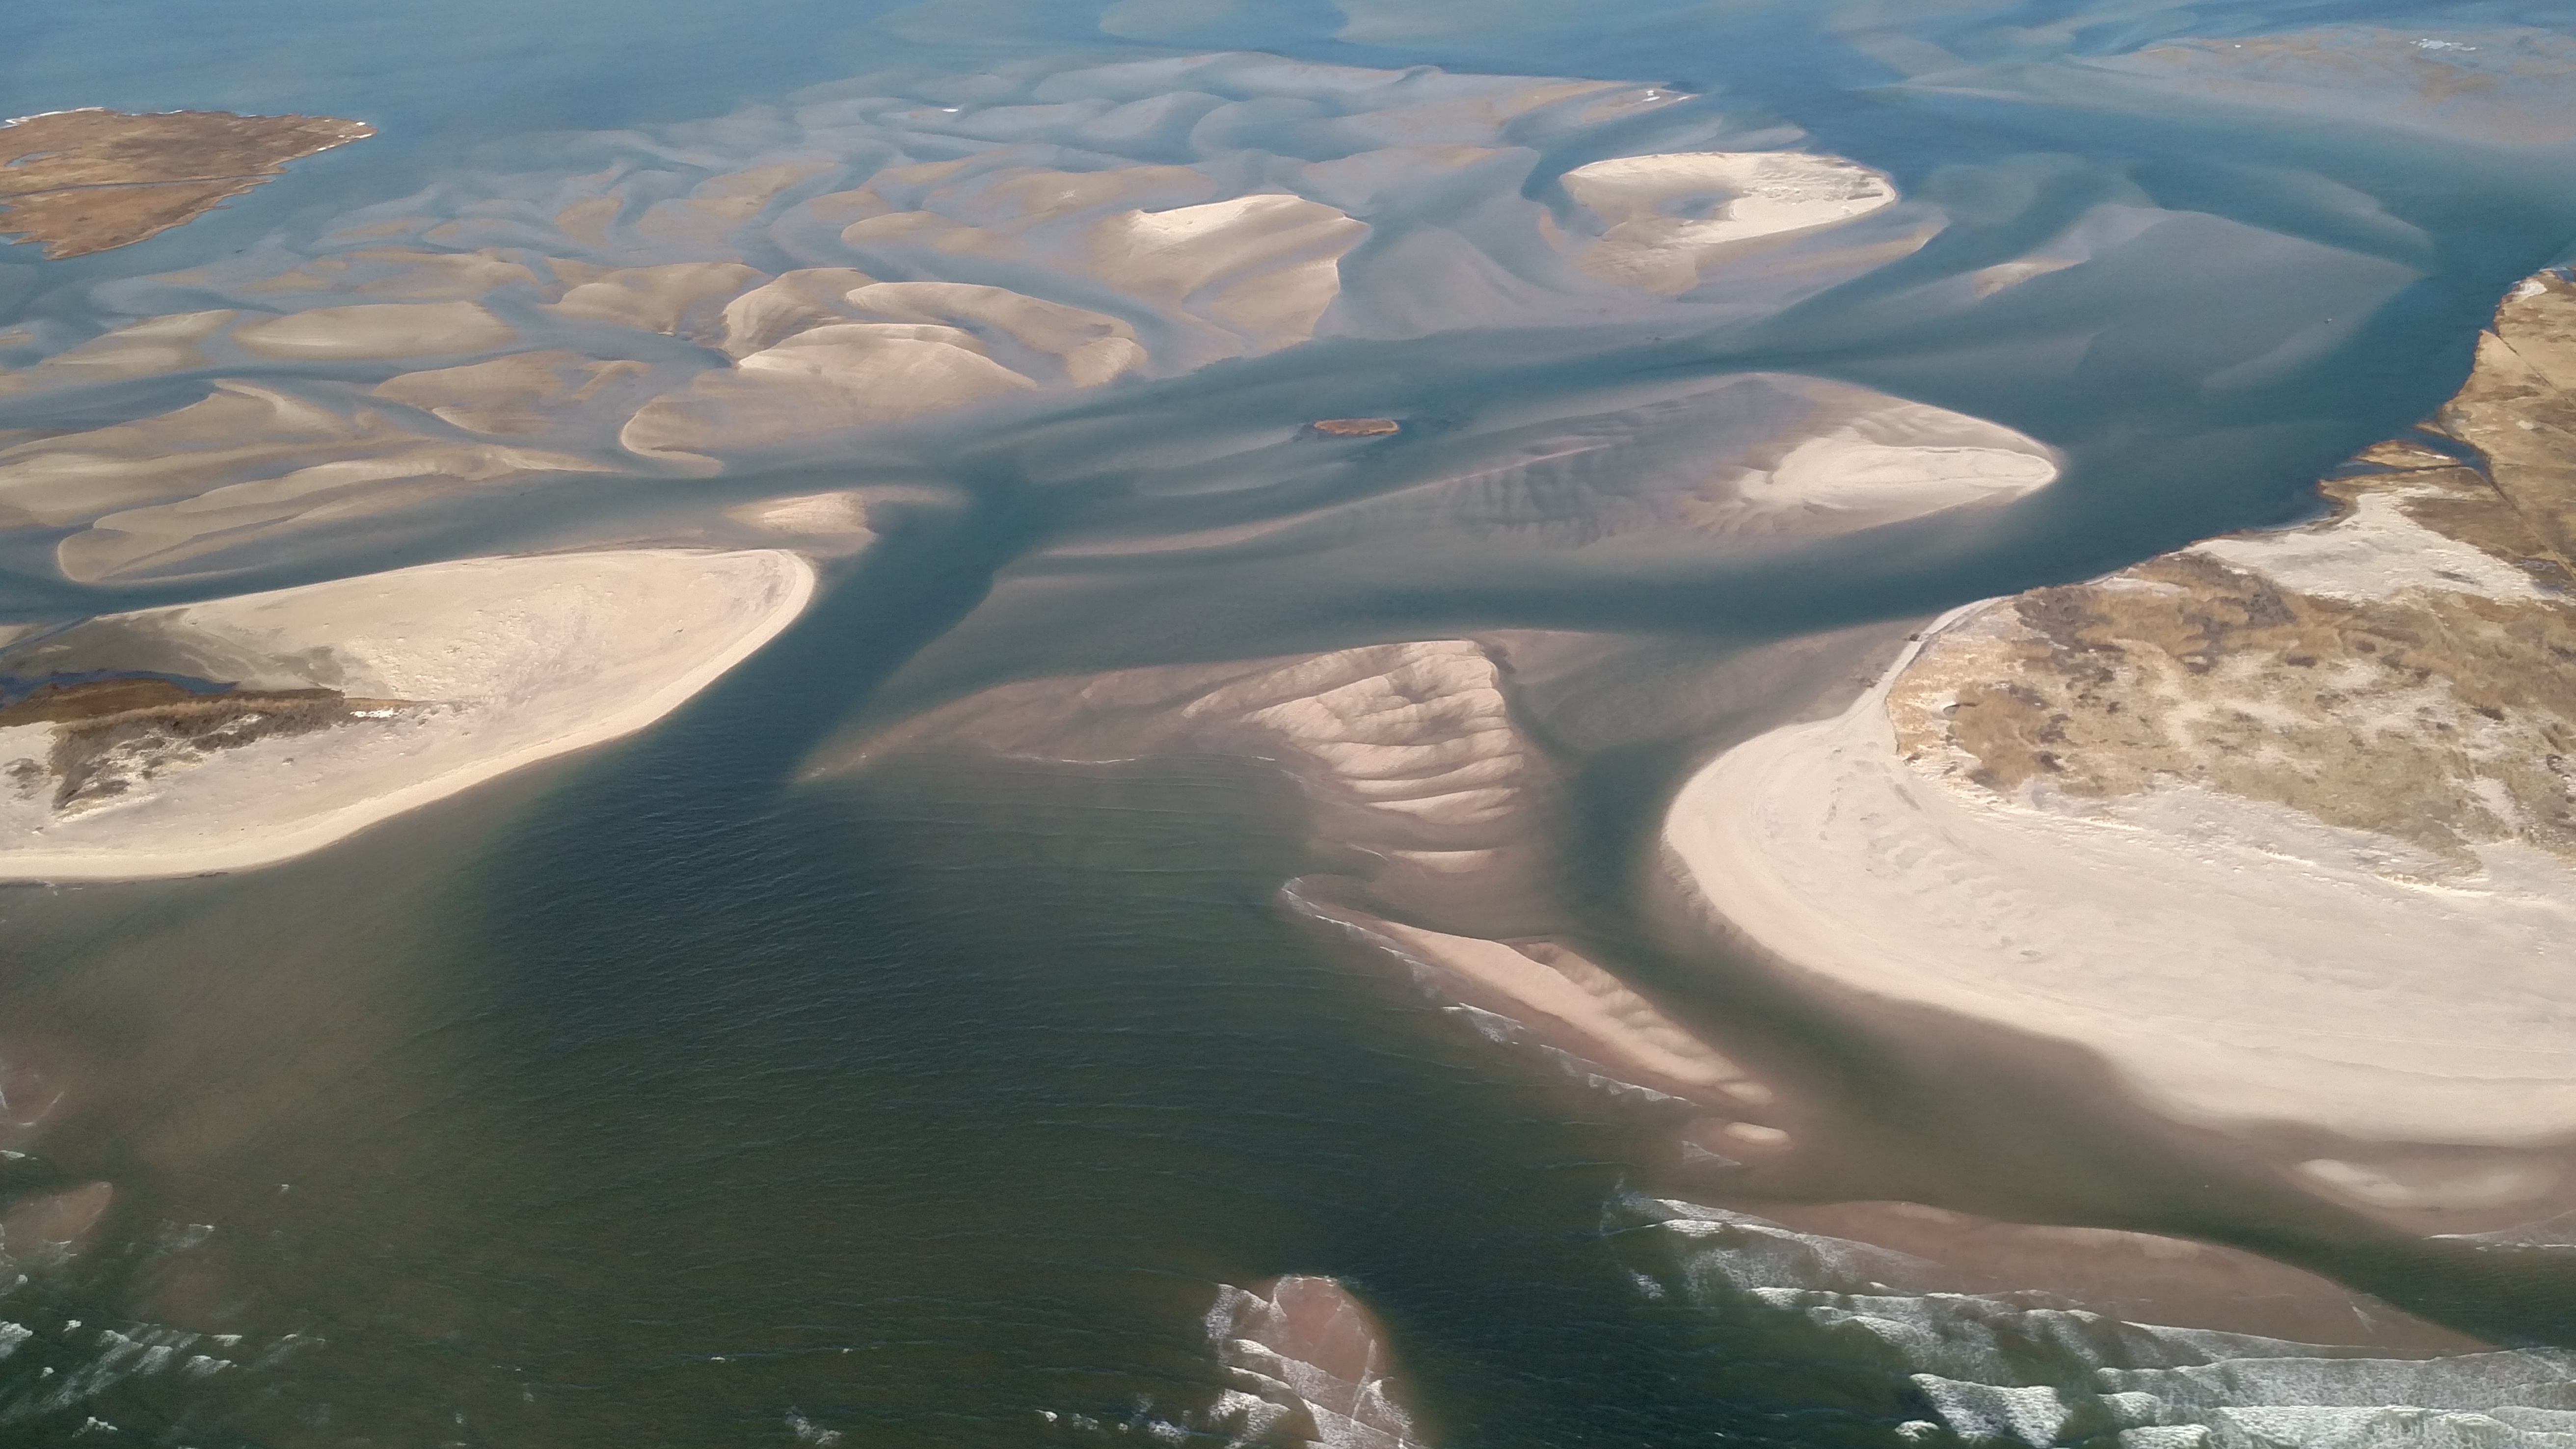 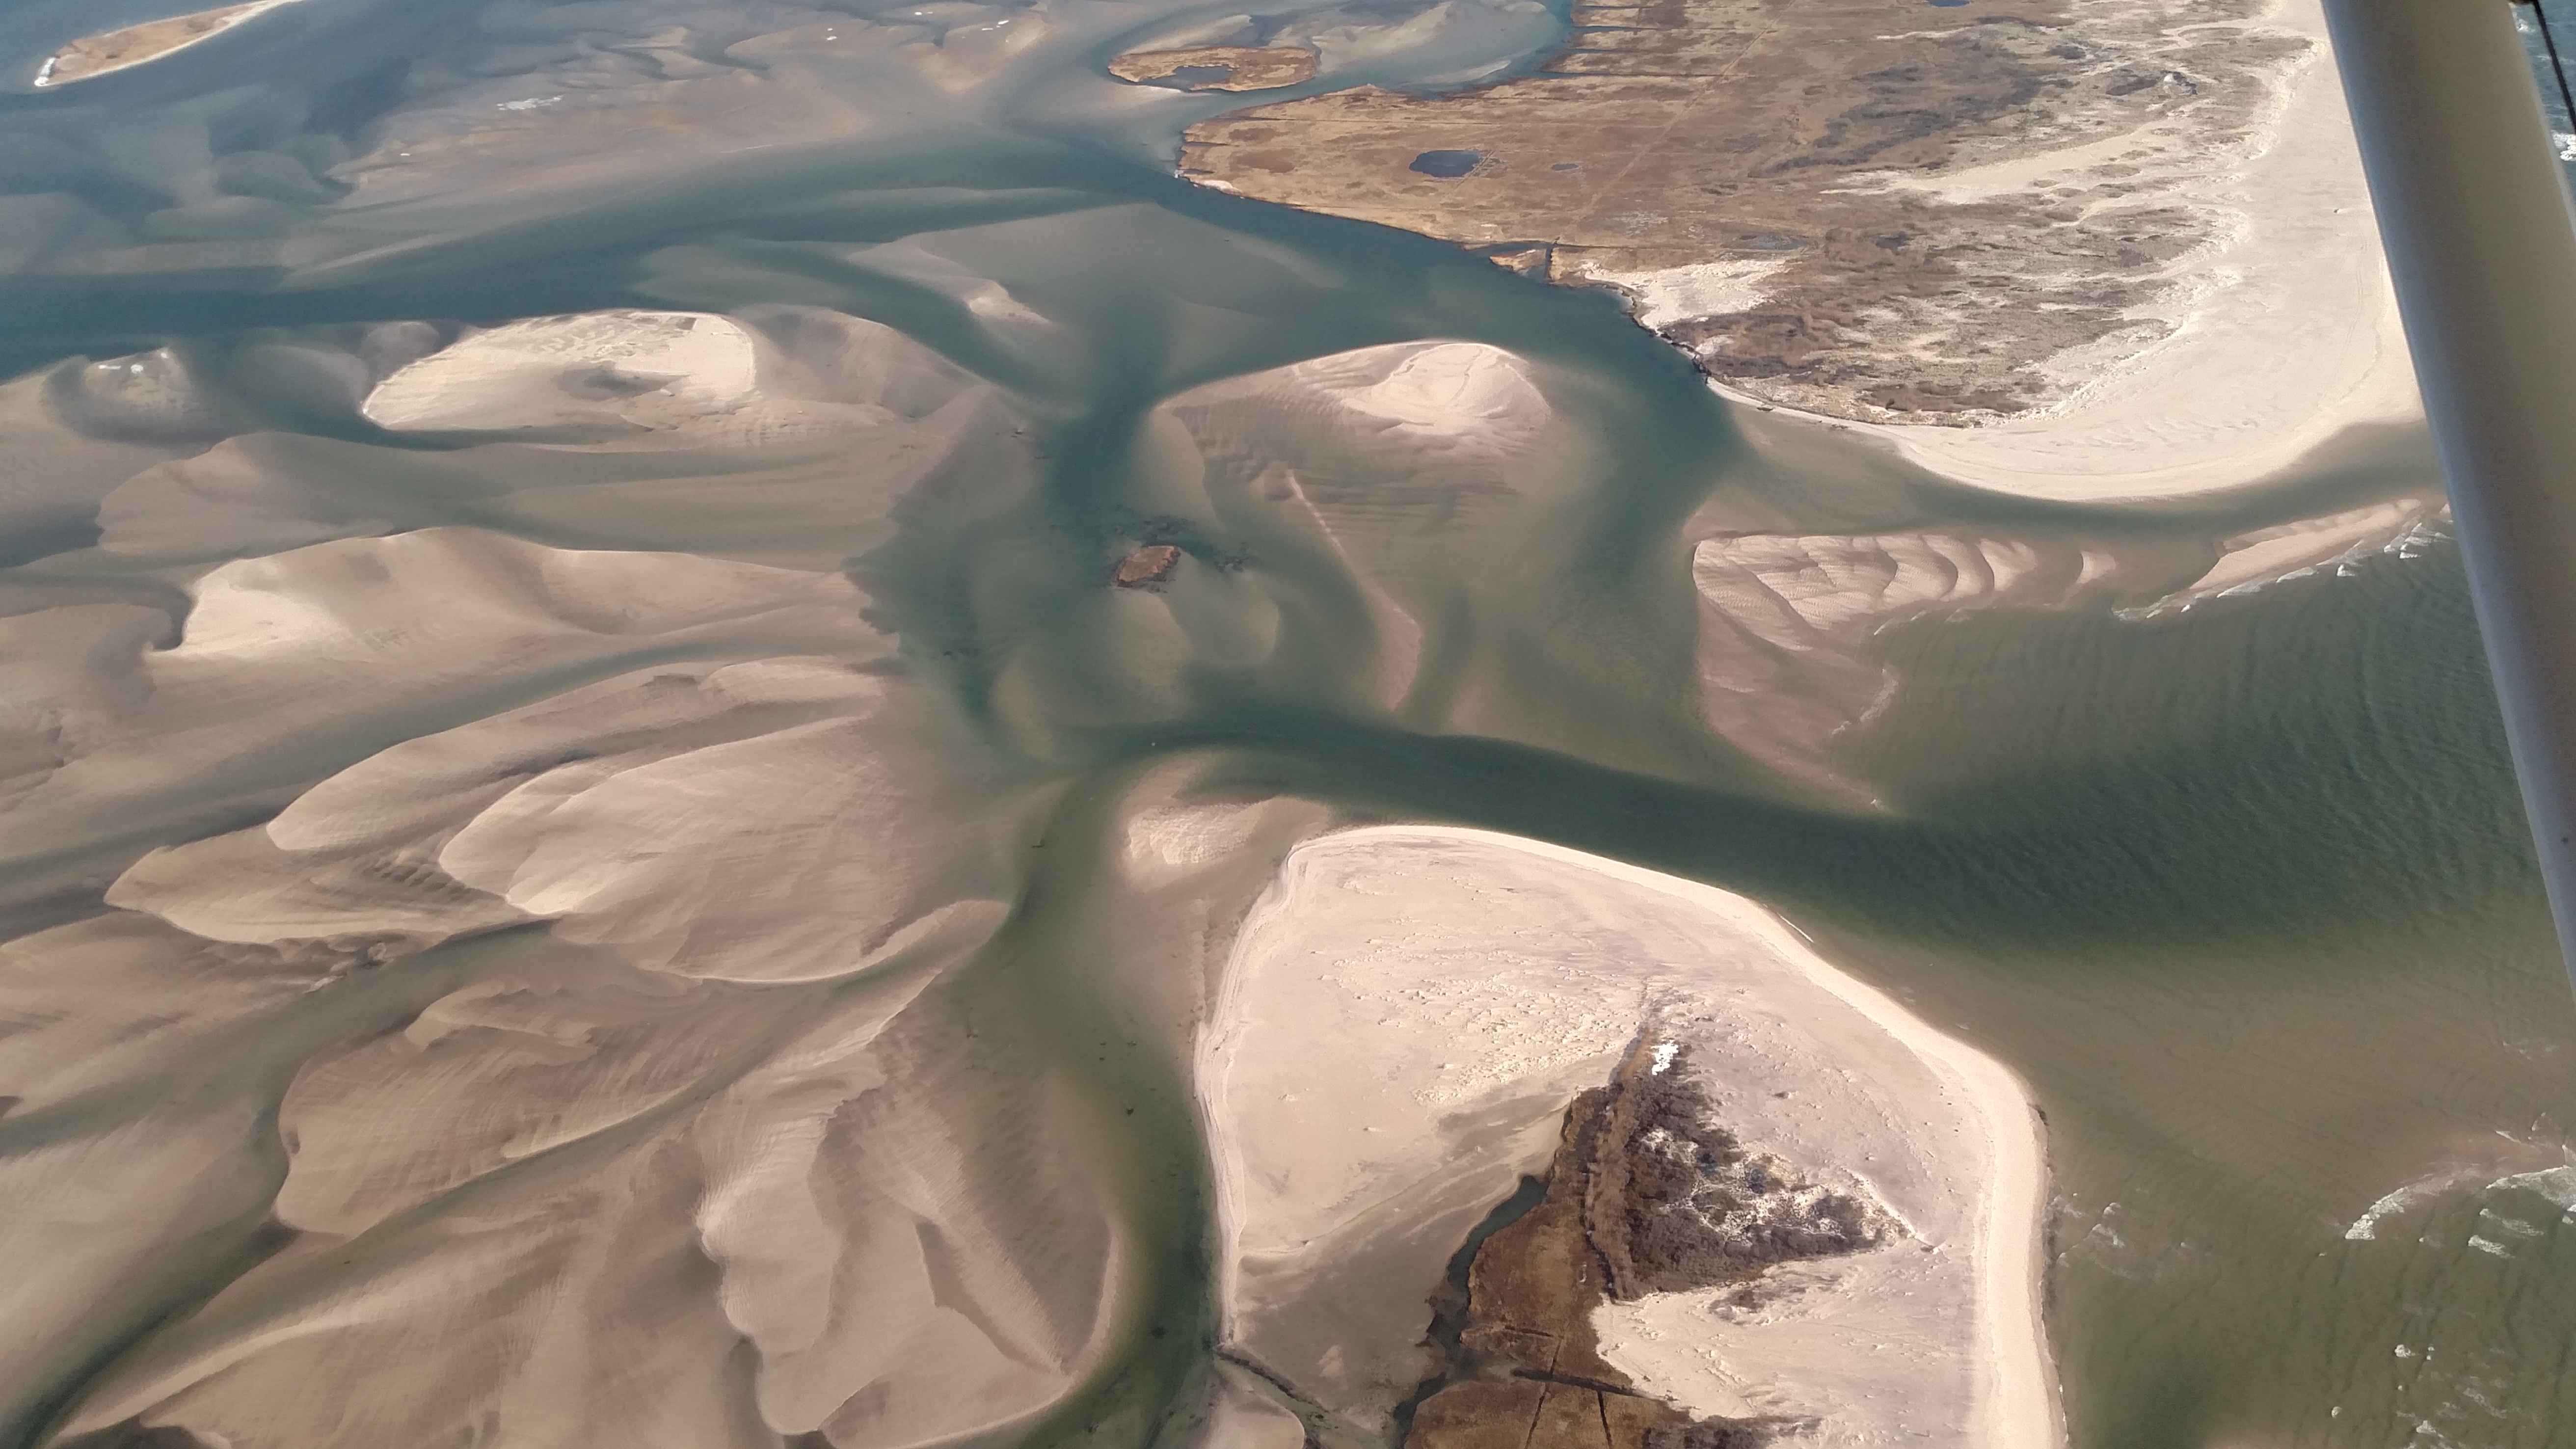 |
Feb 27, 2018 (CF)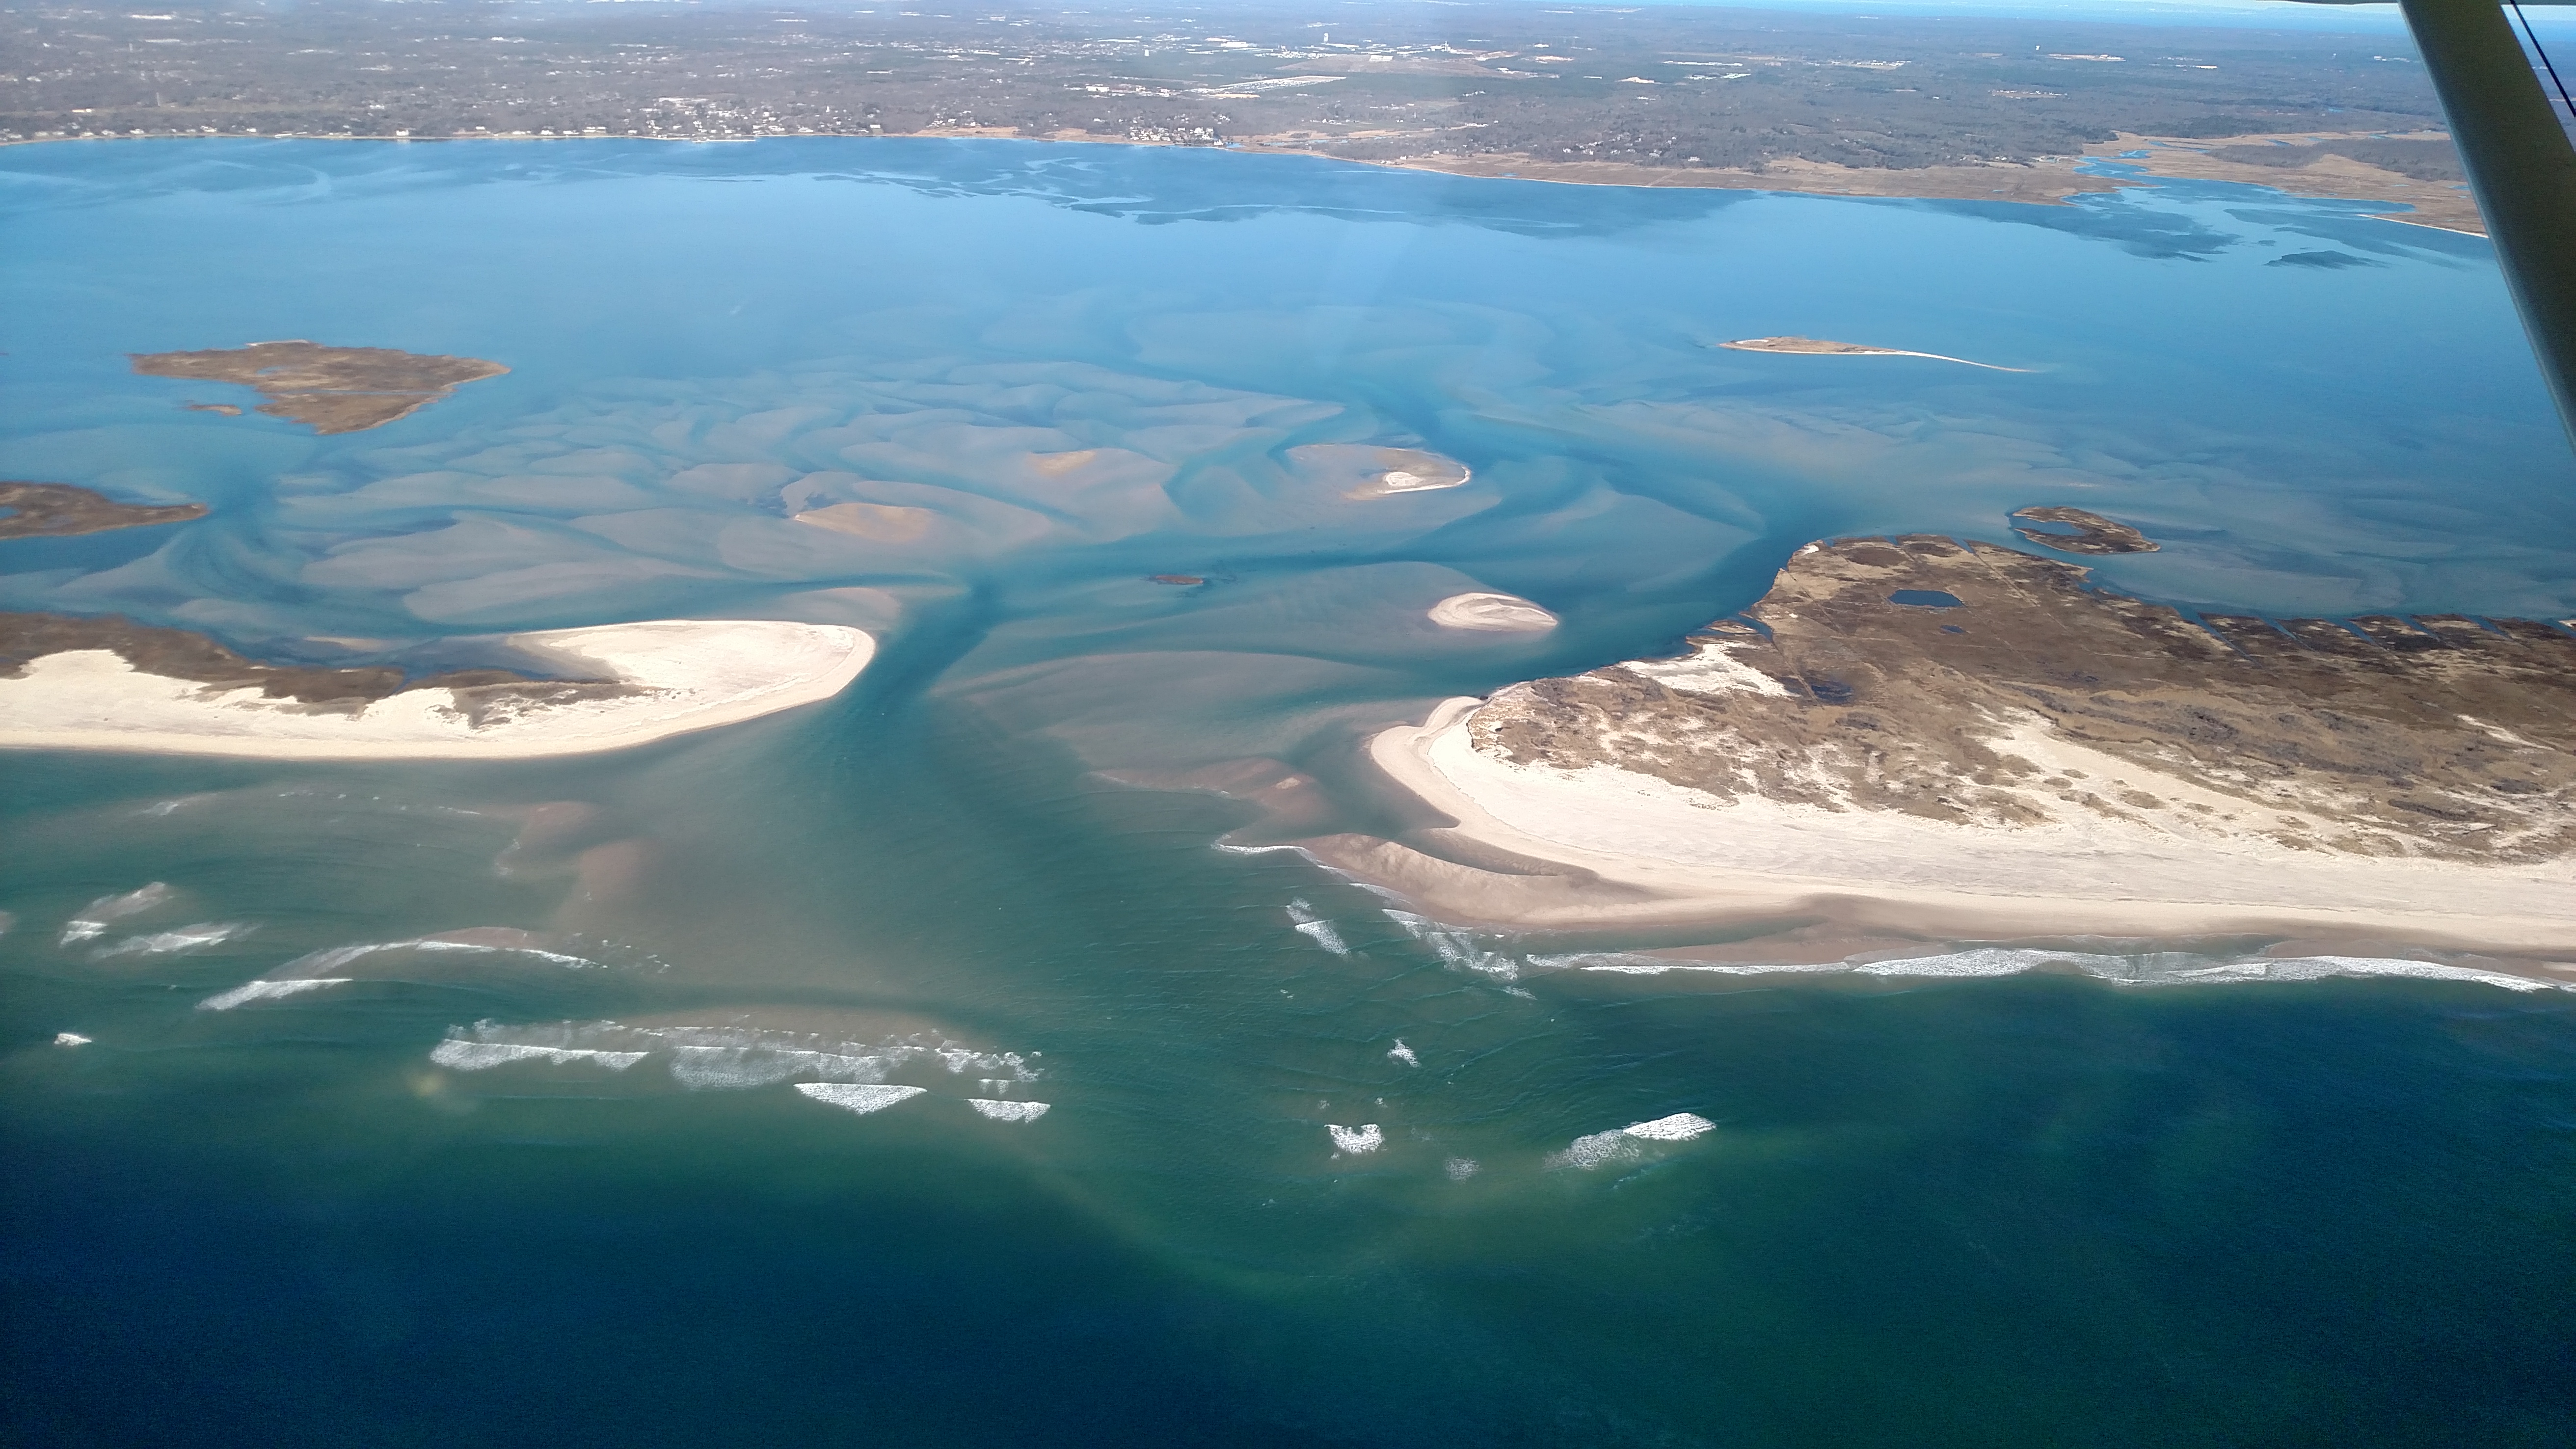 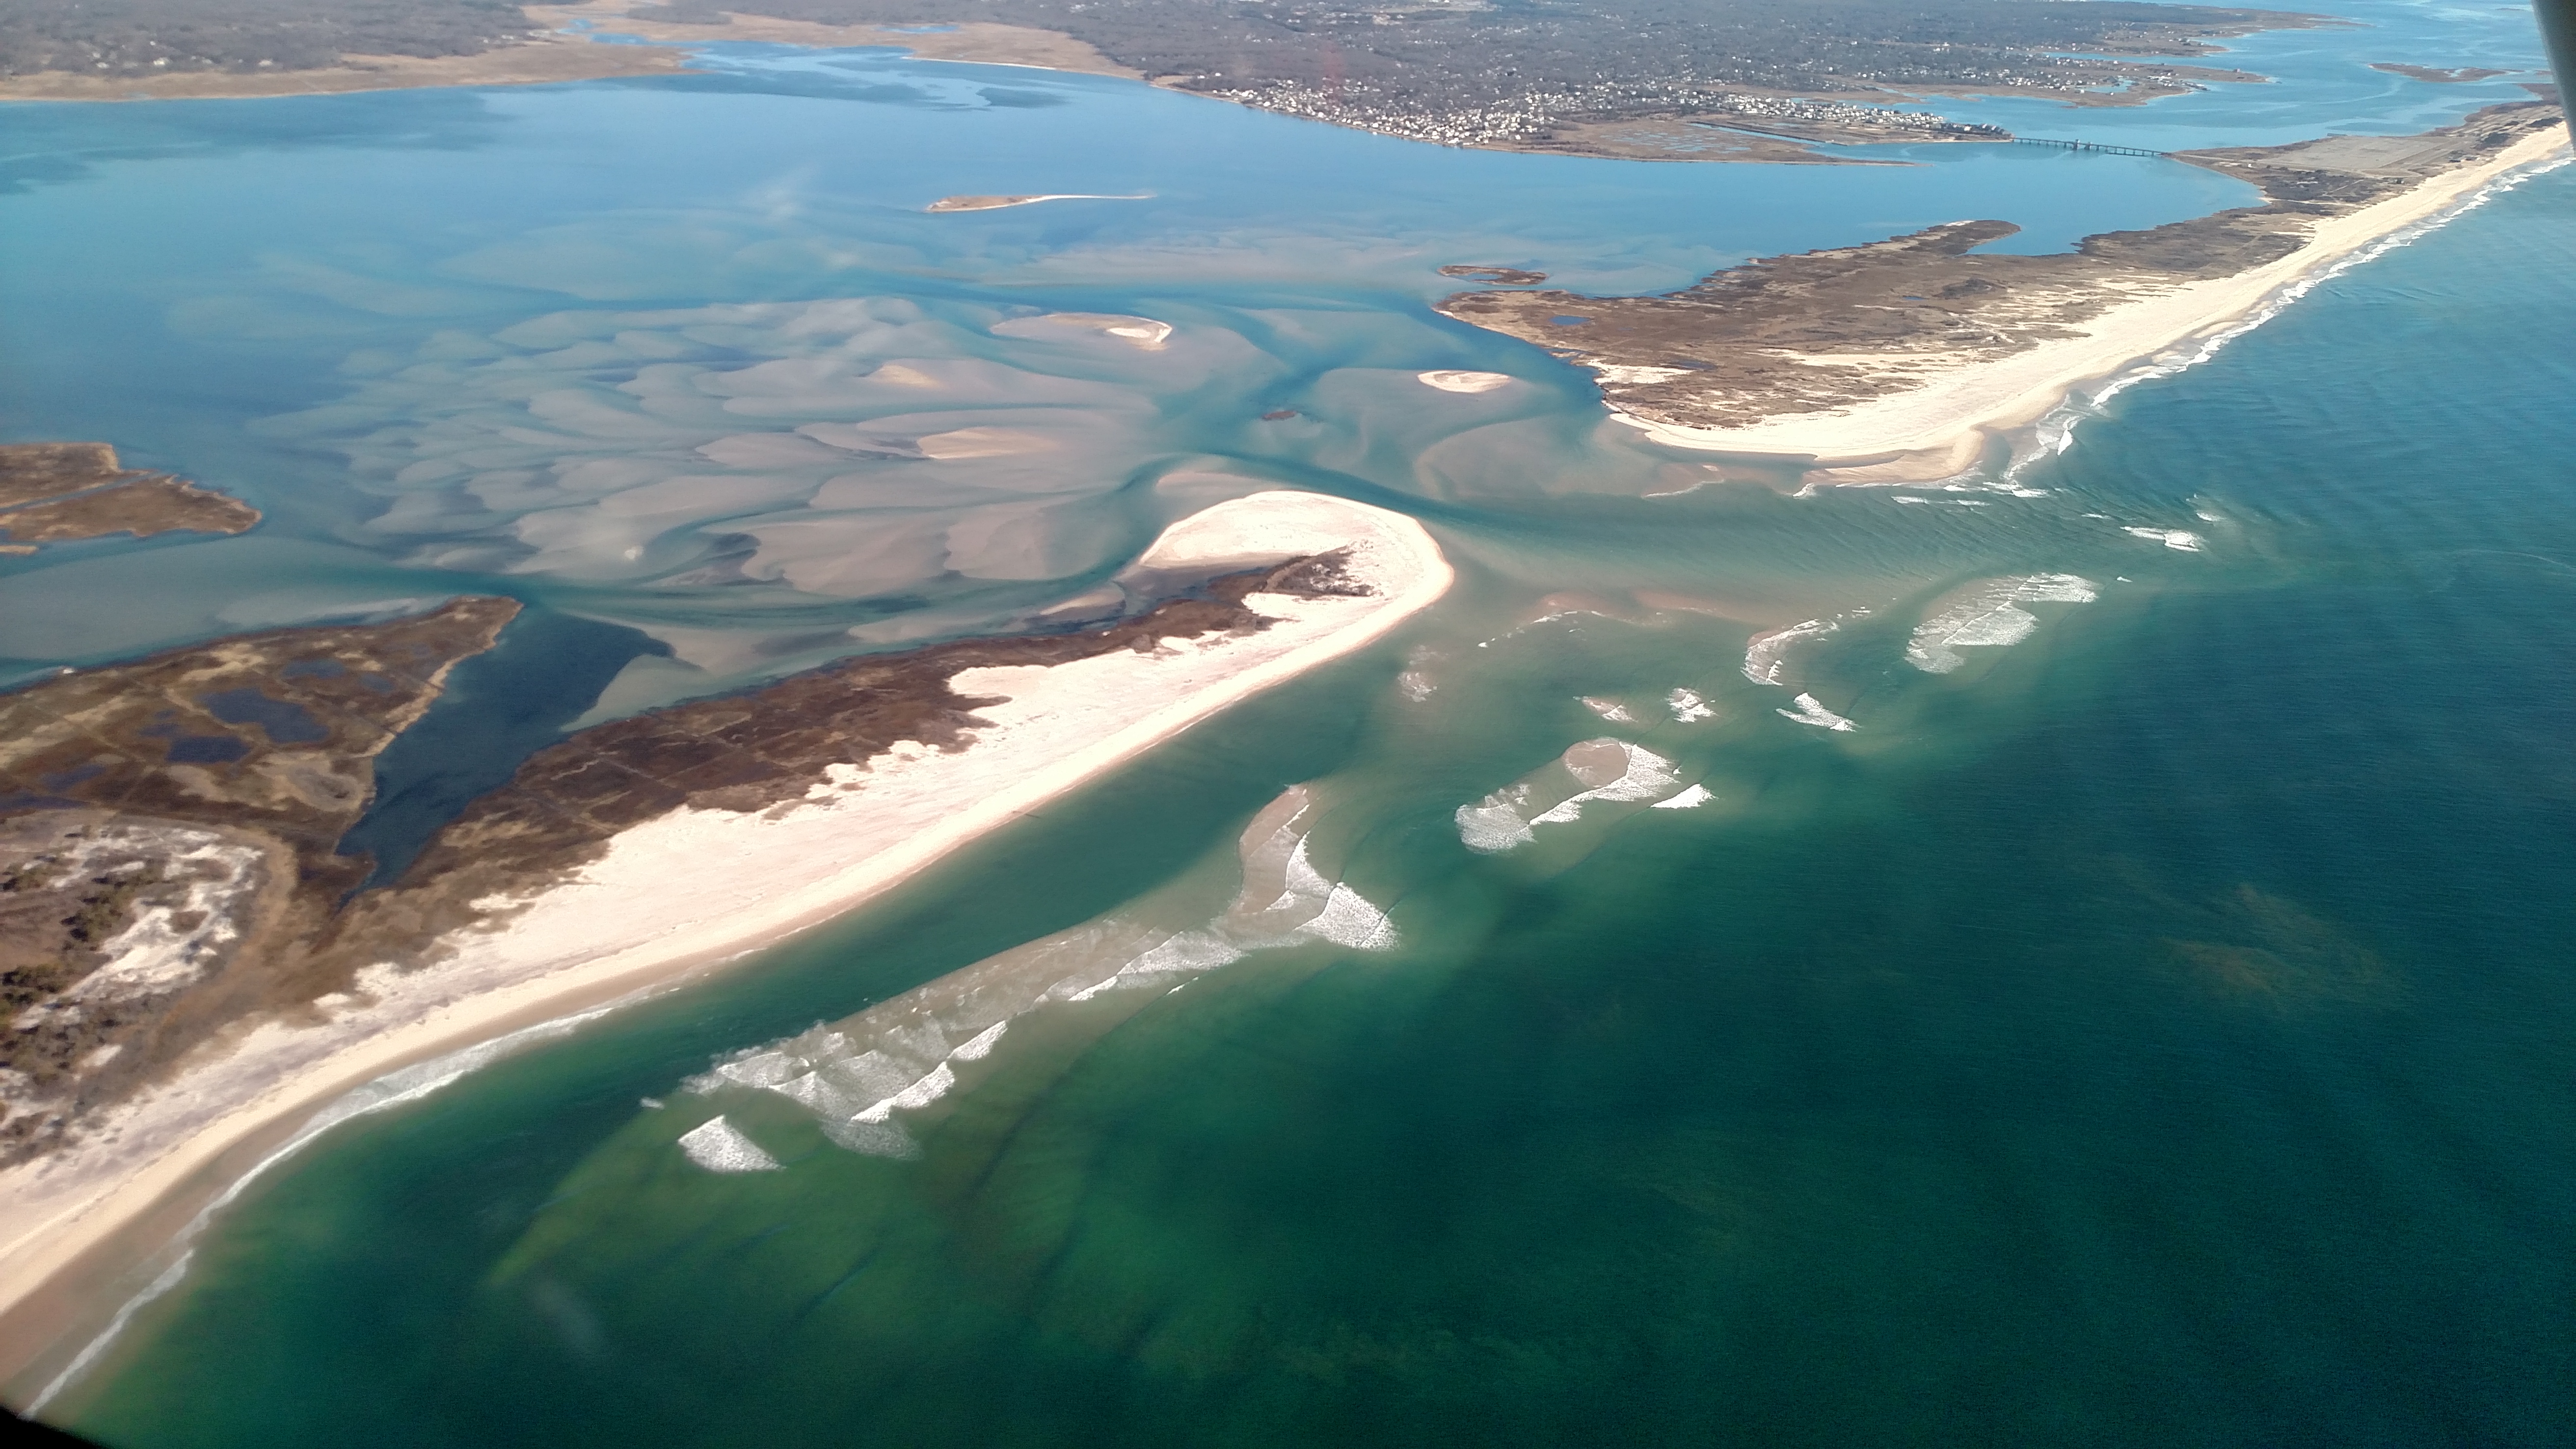 |
||||
Mar 26, 2018 (CF) 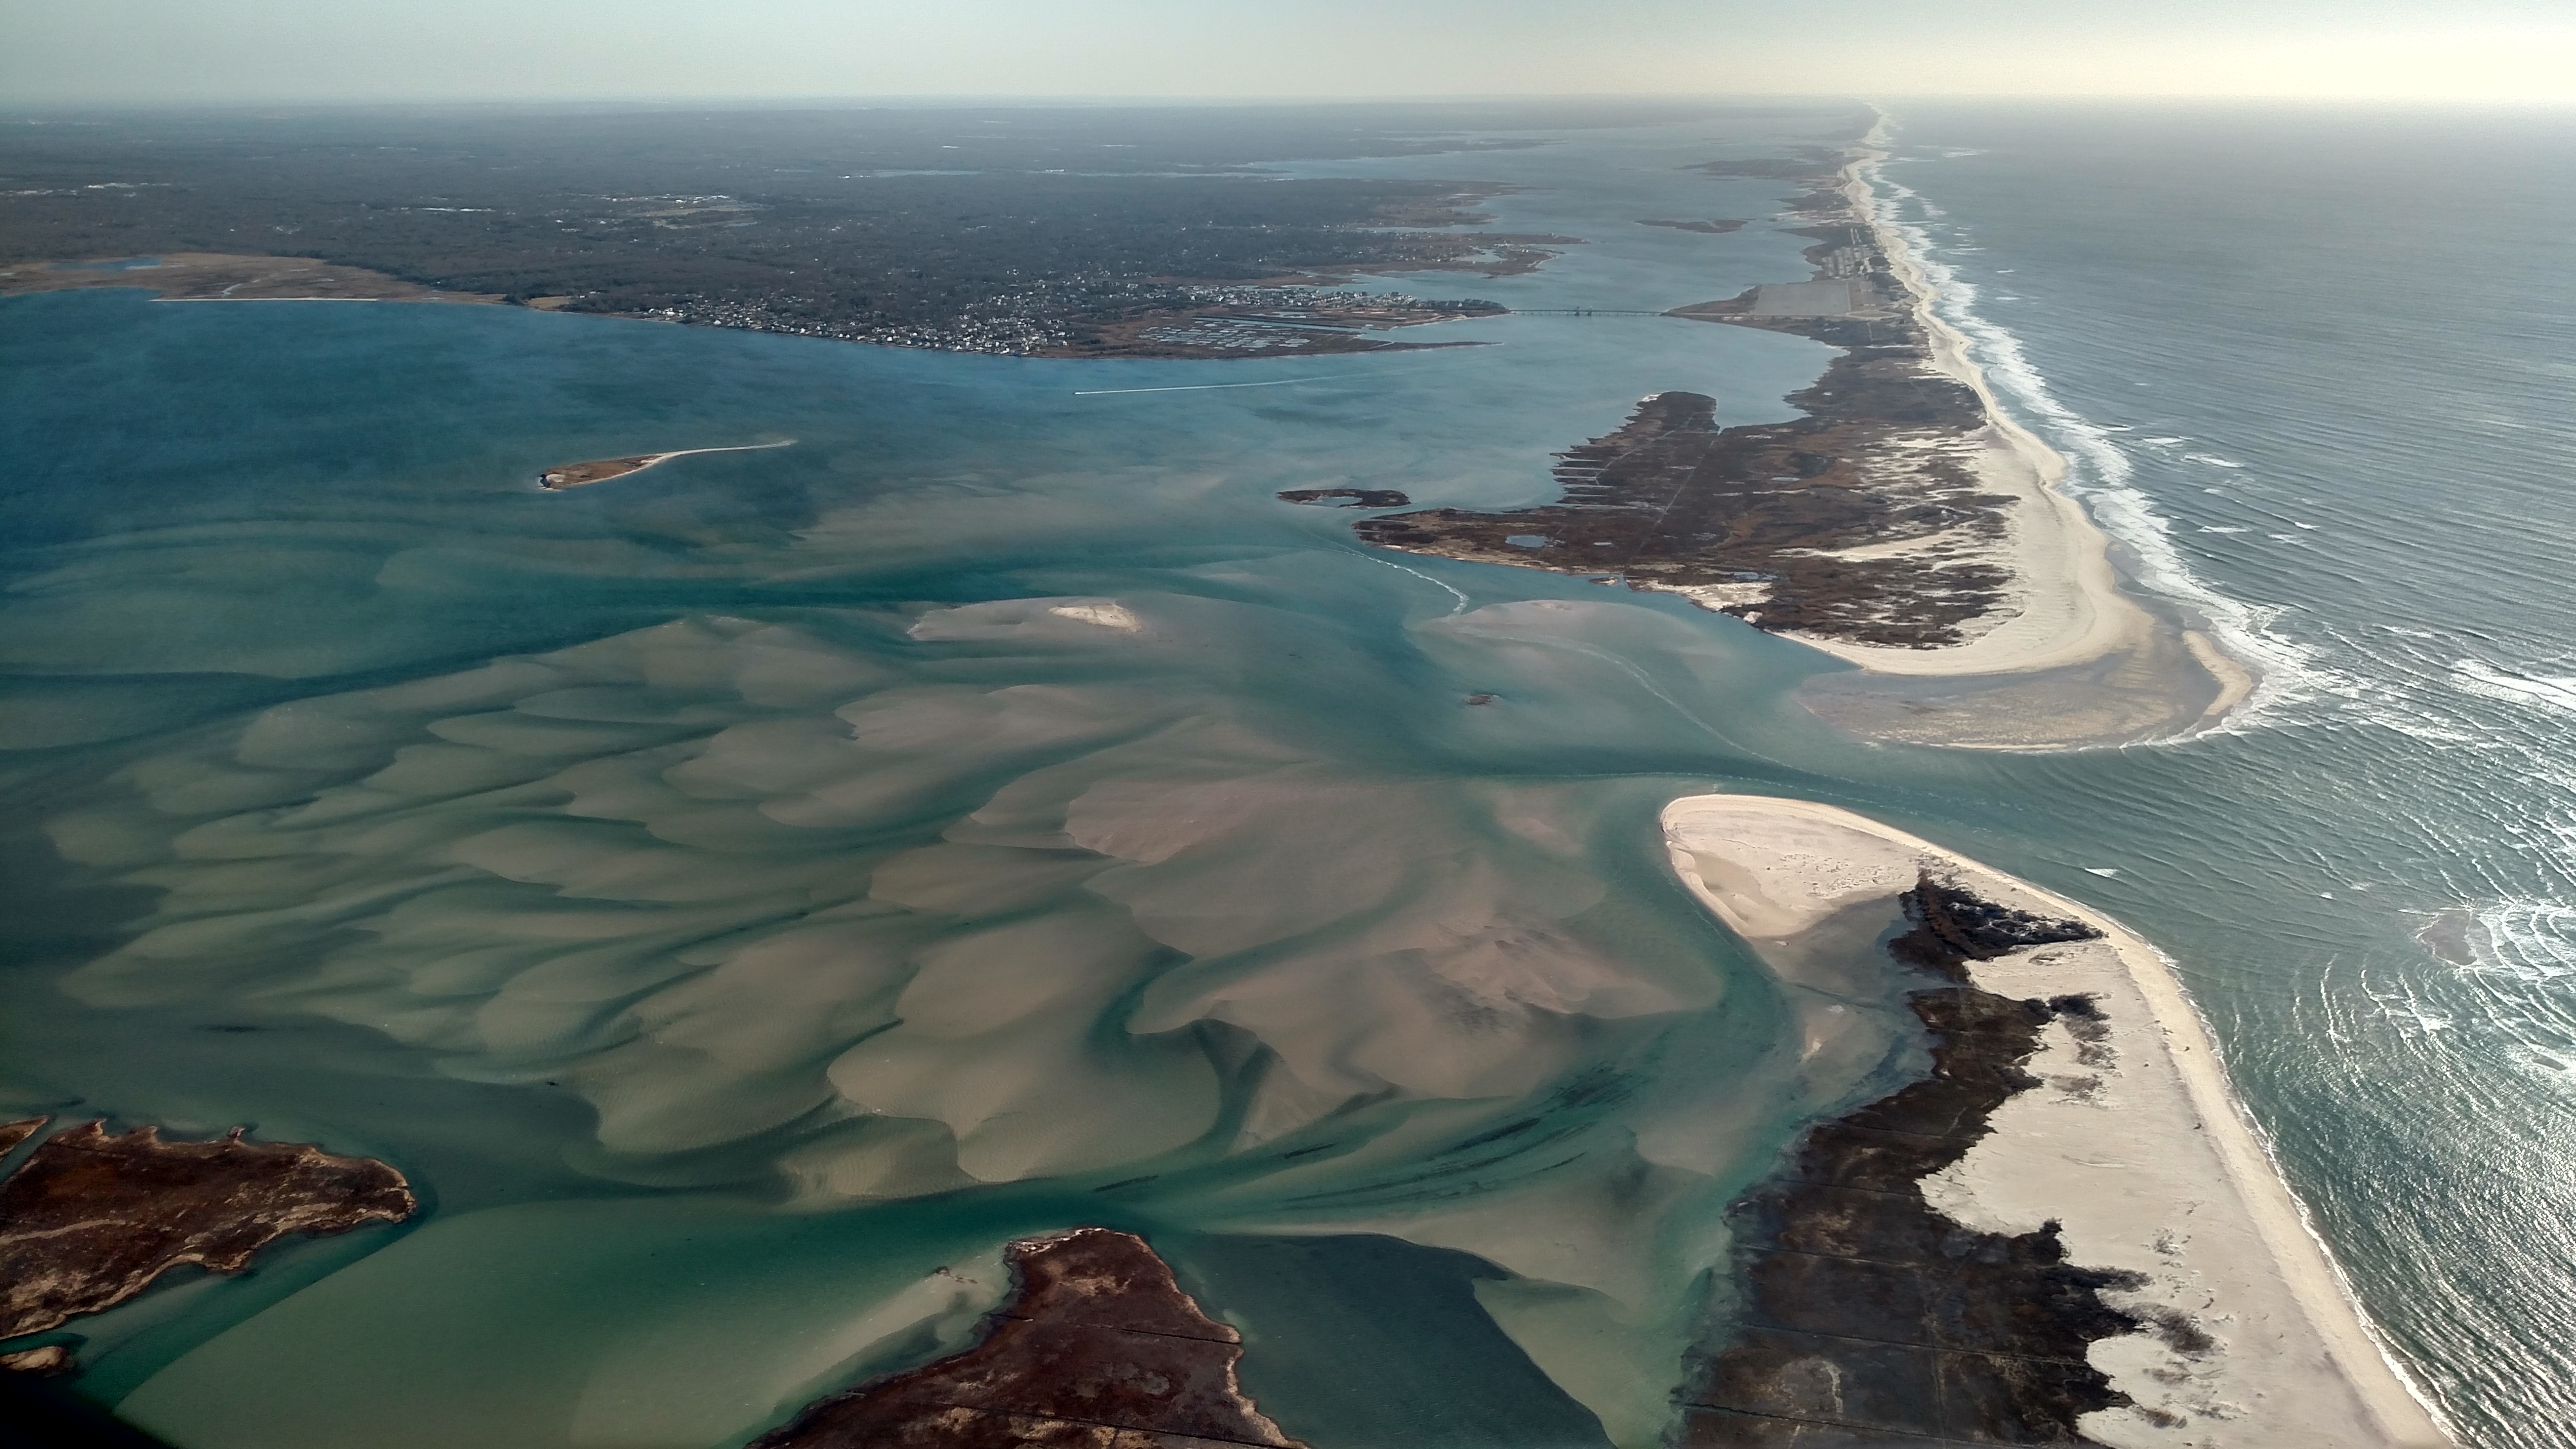 |
Apr 21-22, 2018 (CF)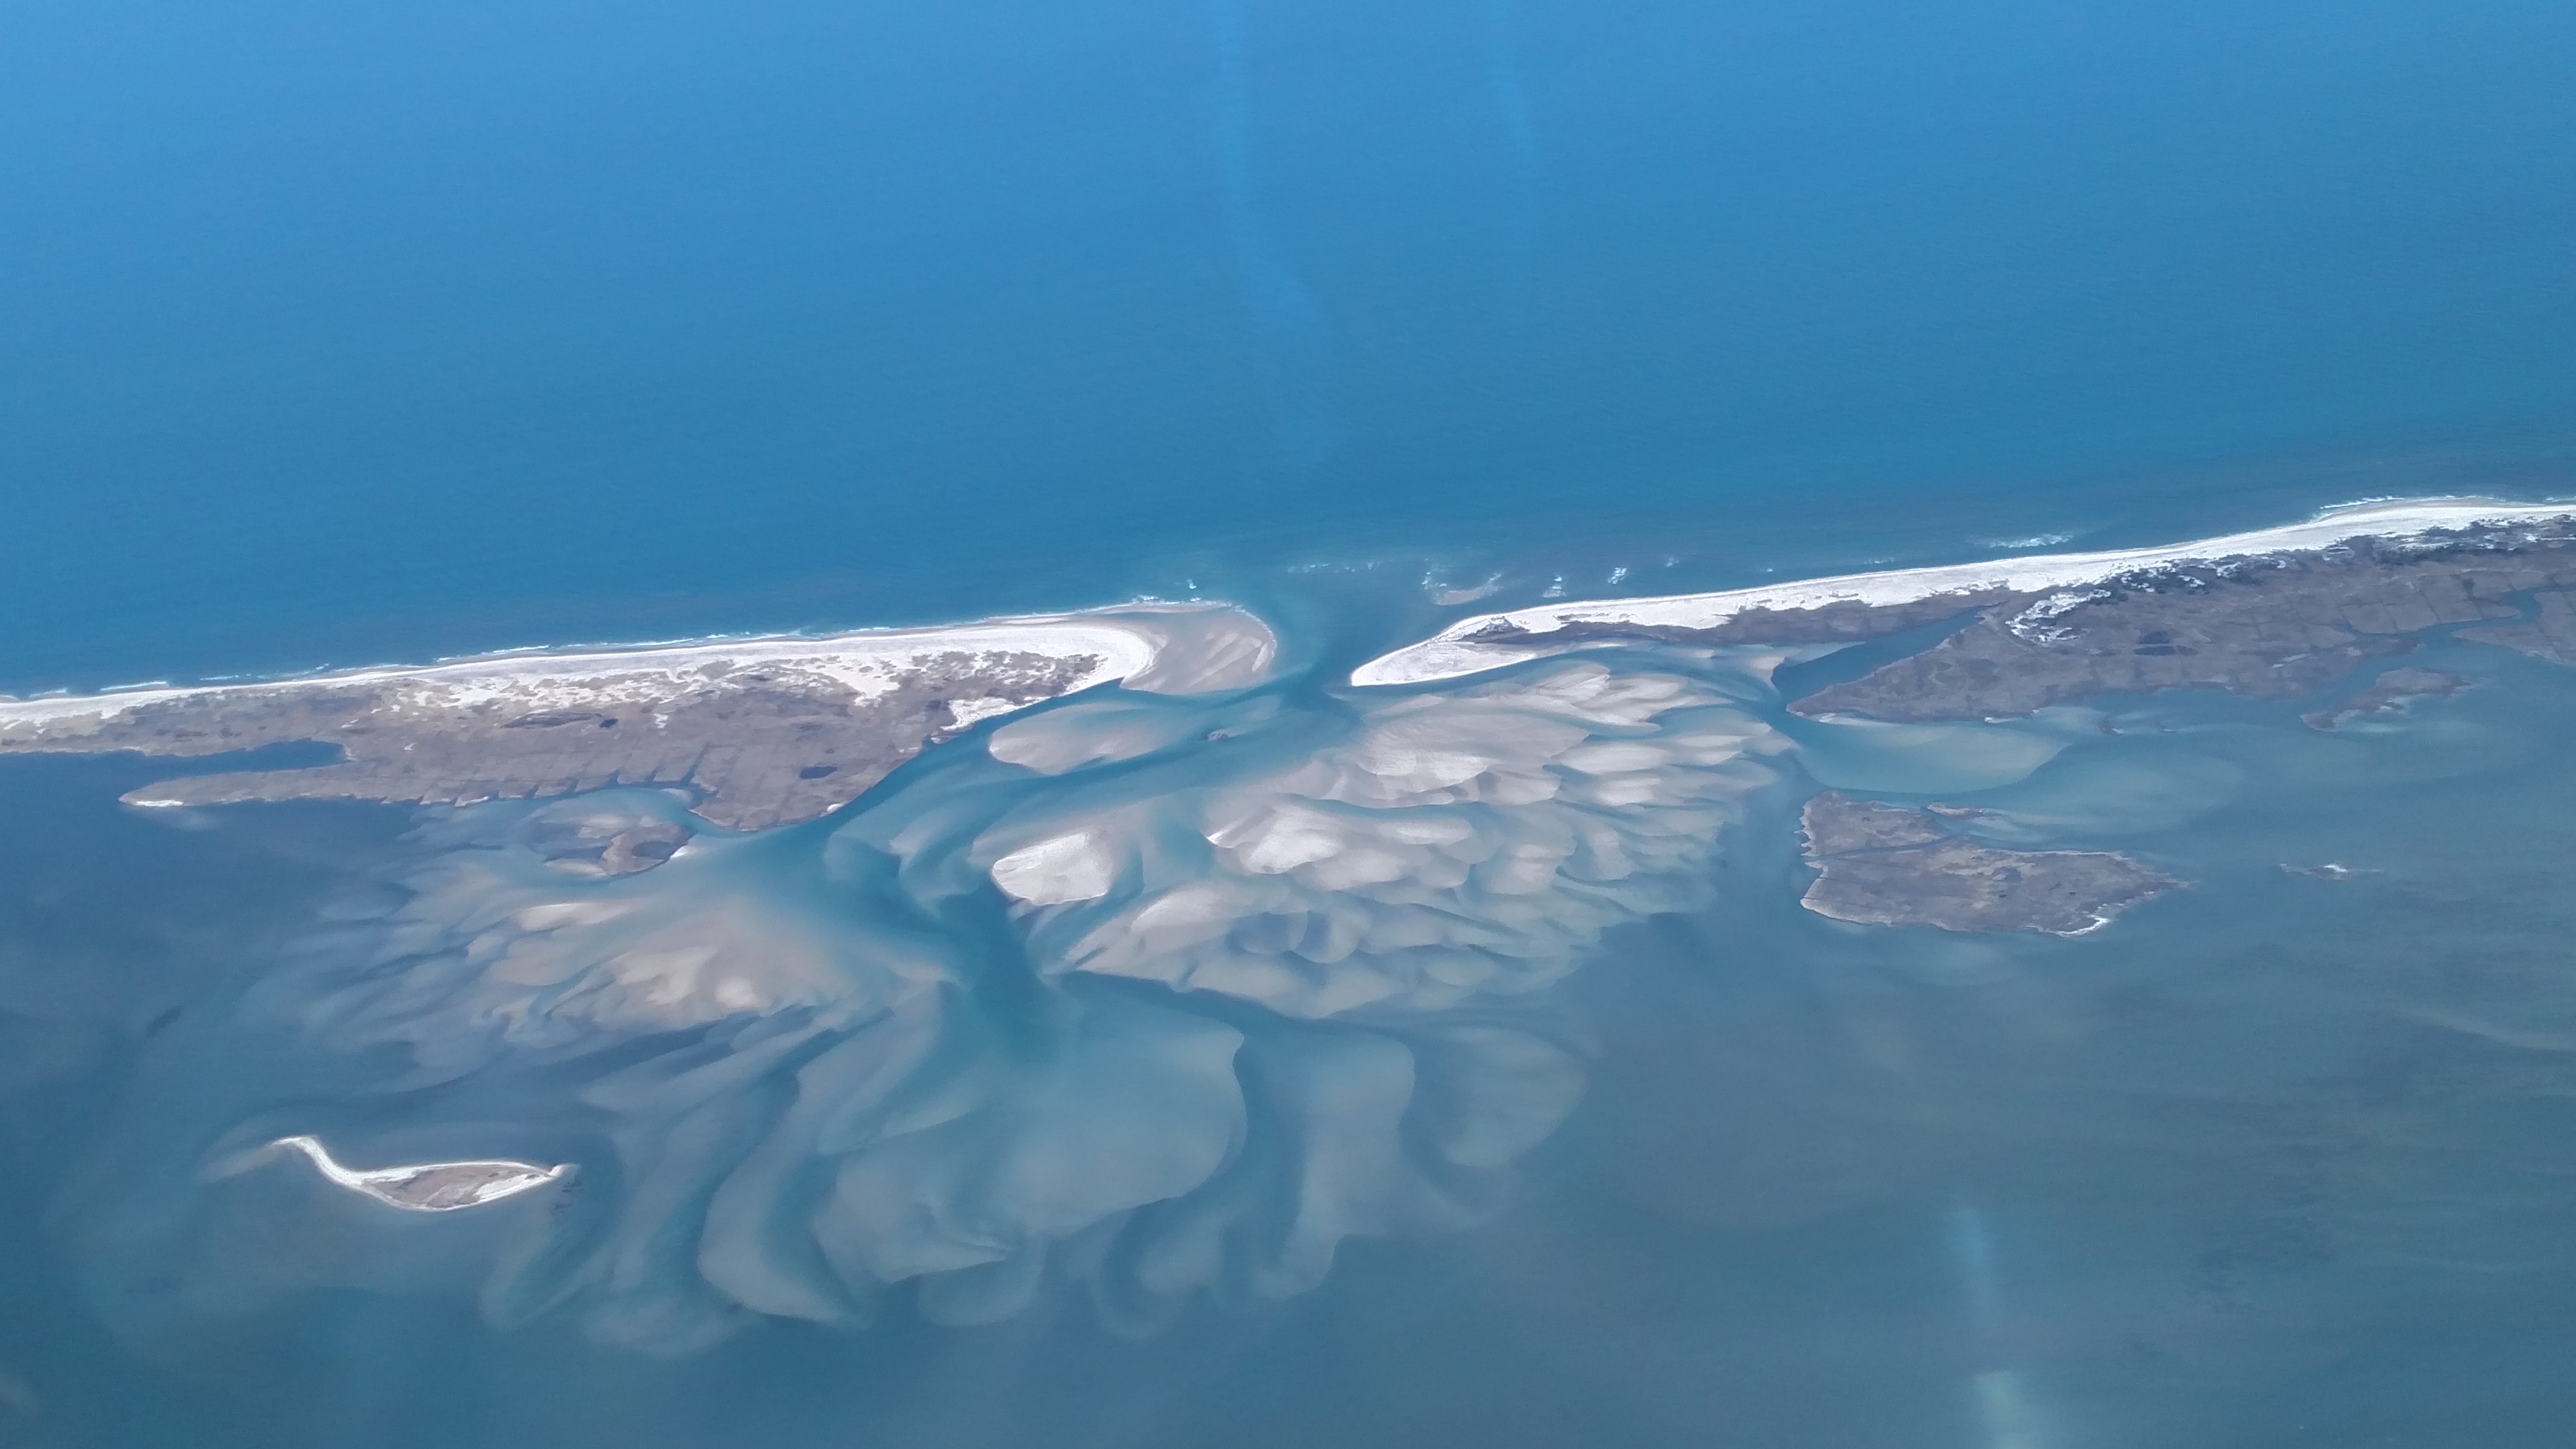 |
Apr 25, 2018 (CF&YH)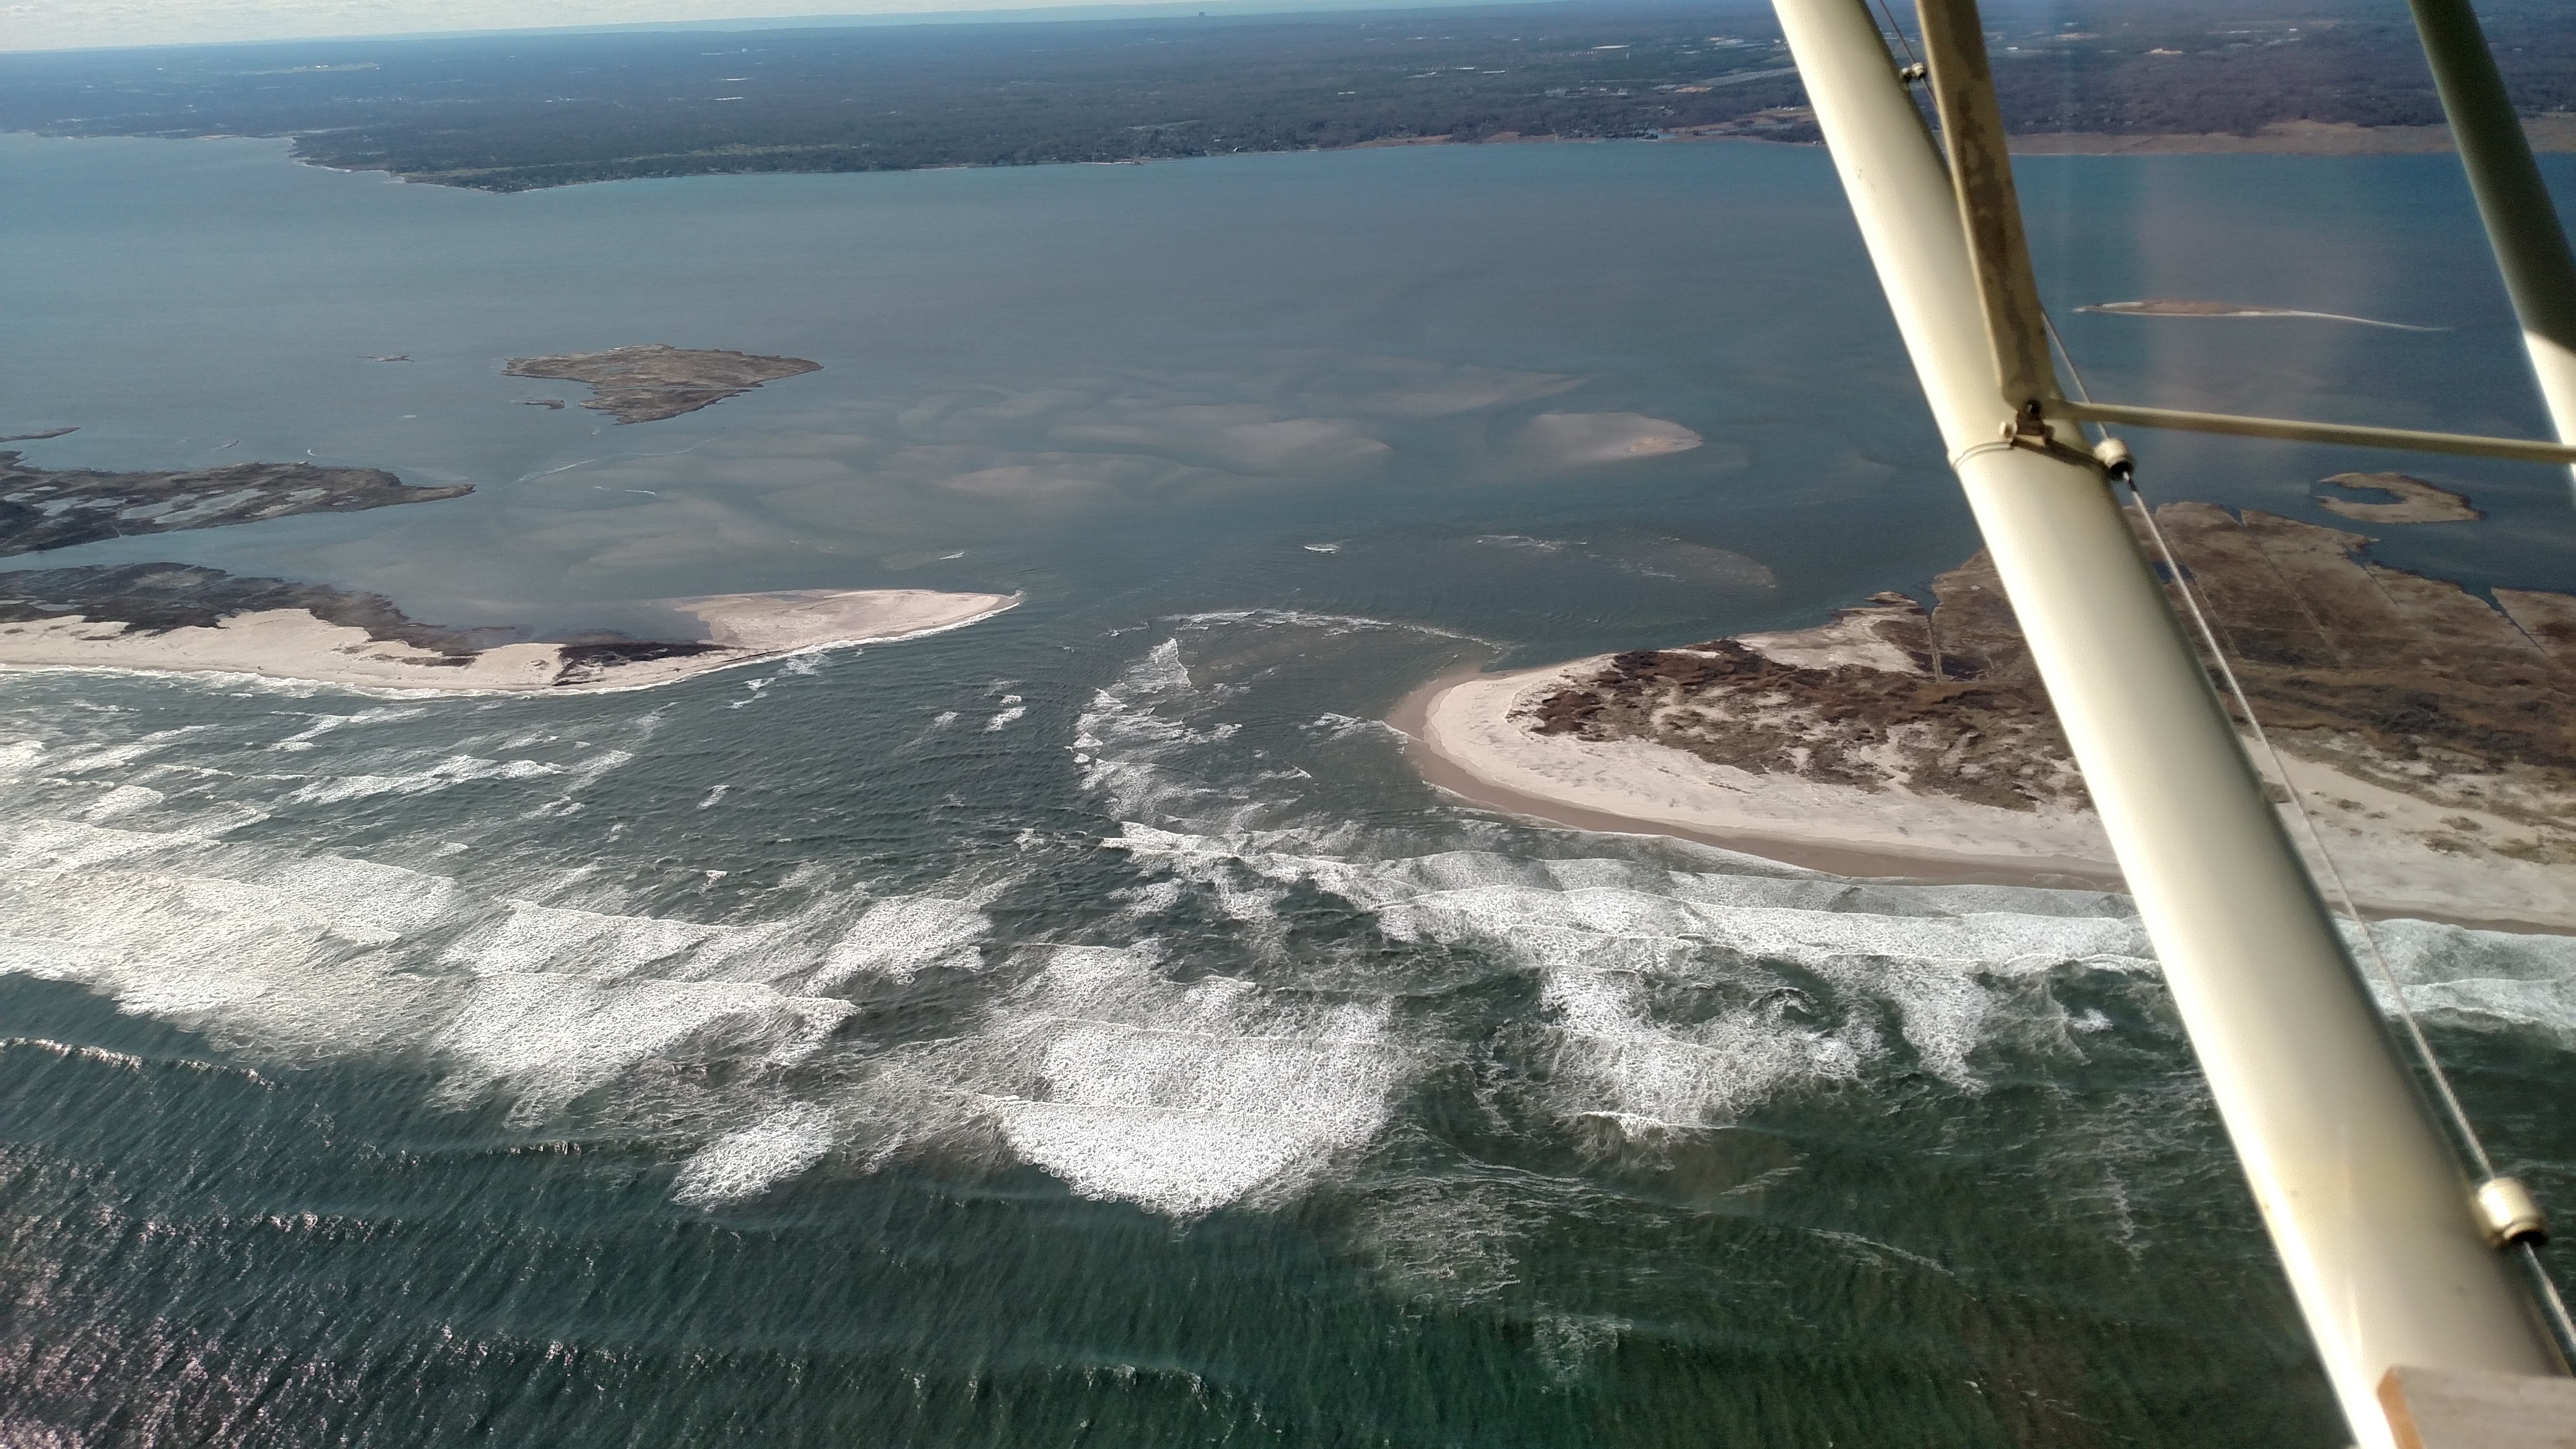  |
May 22, 2018 (JV)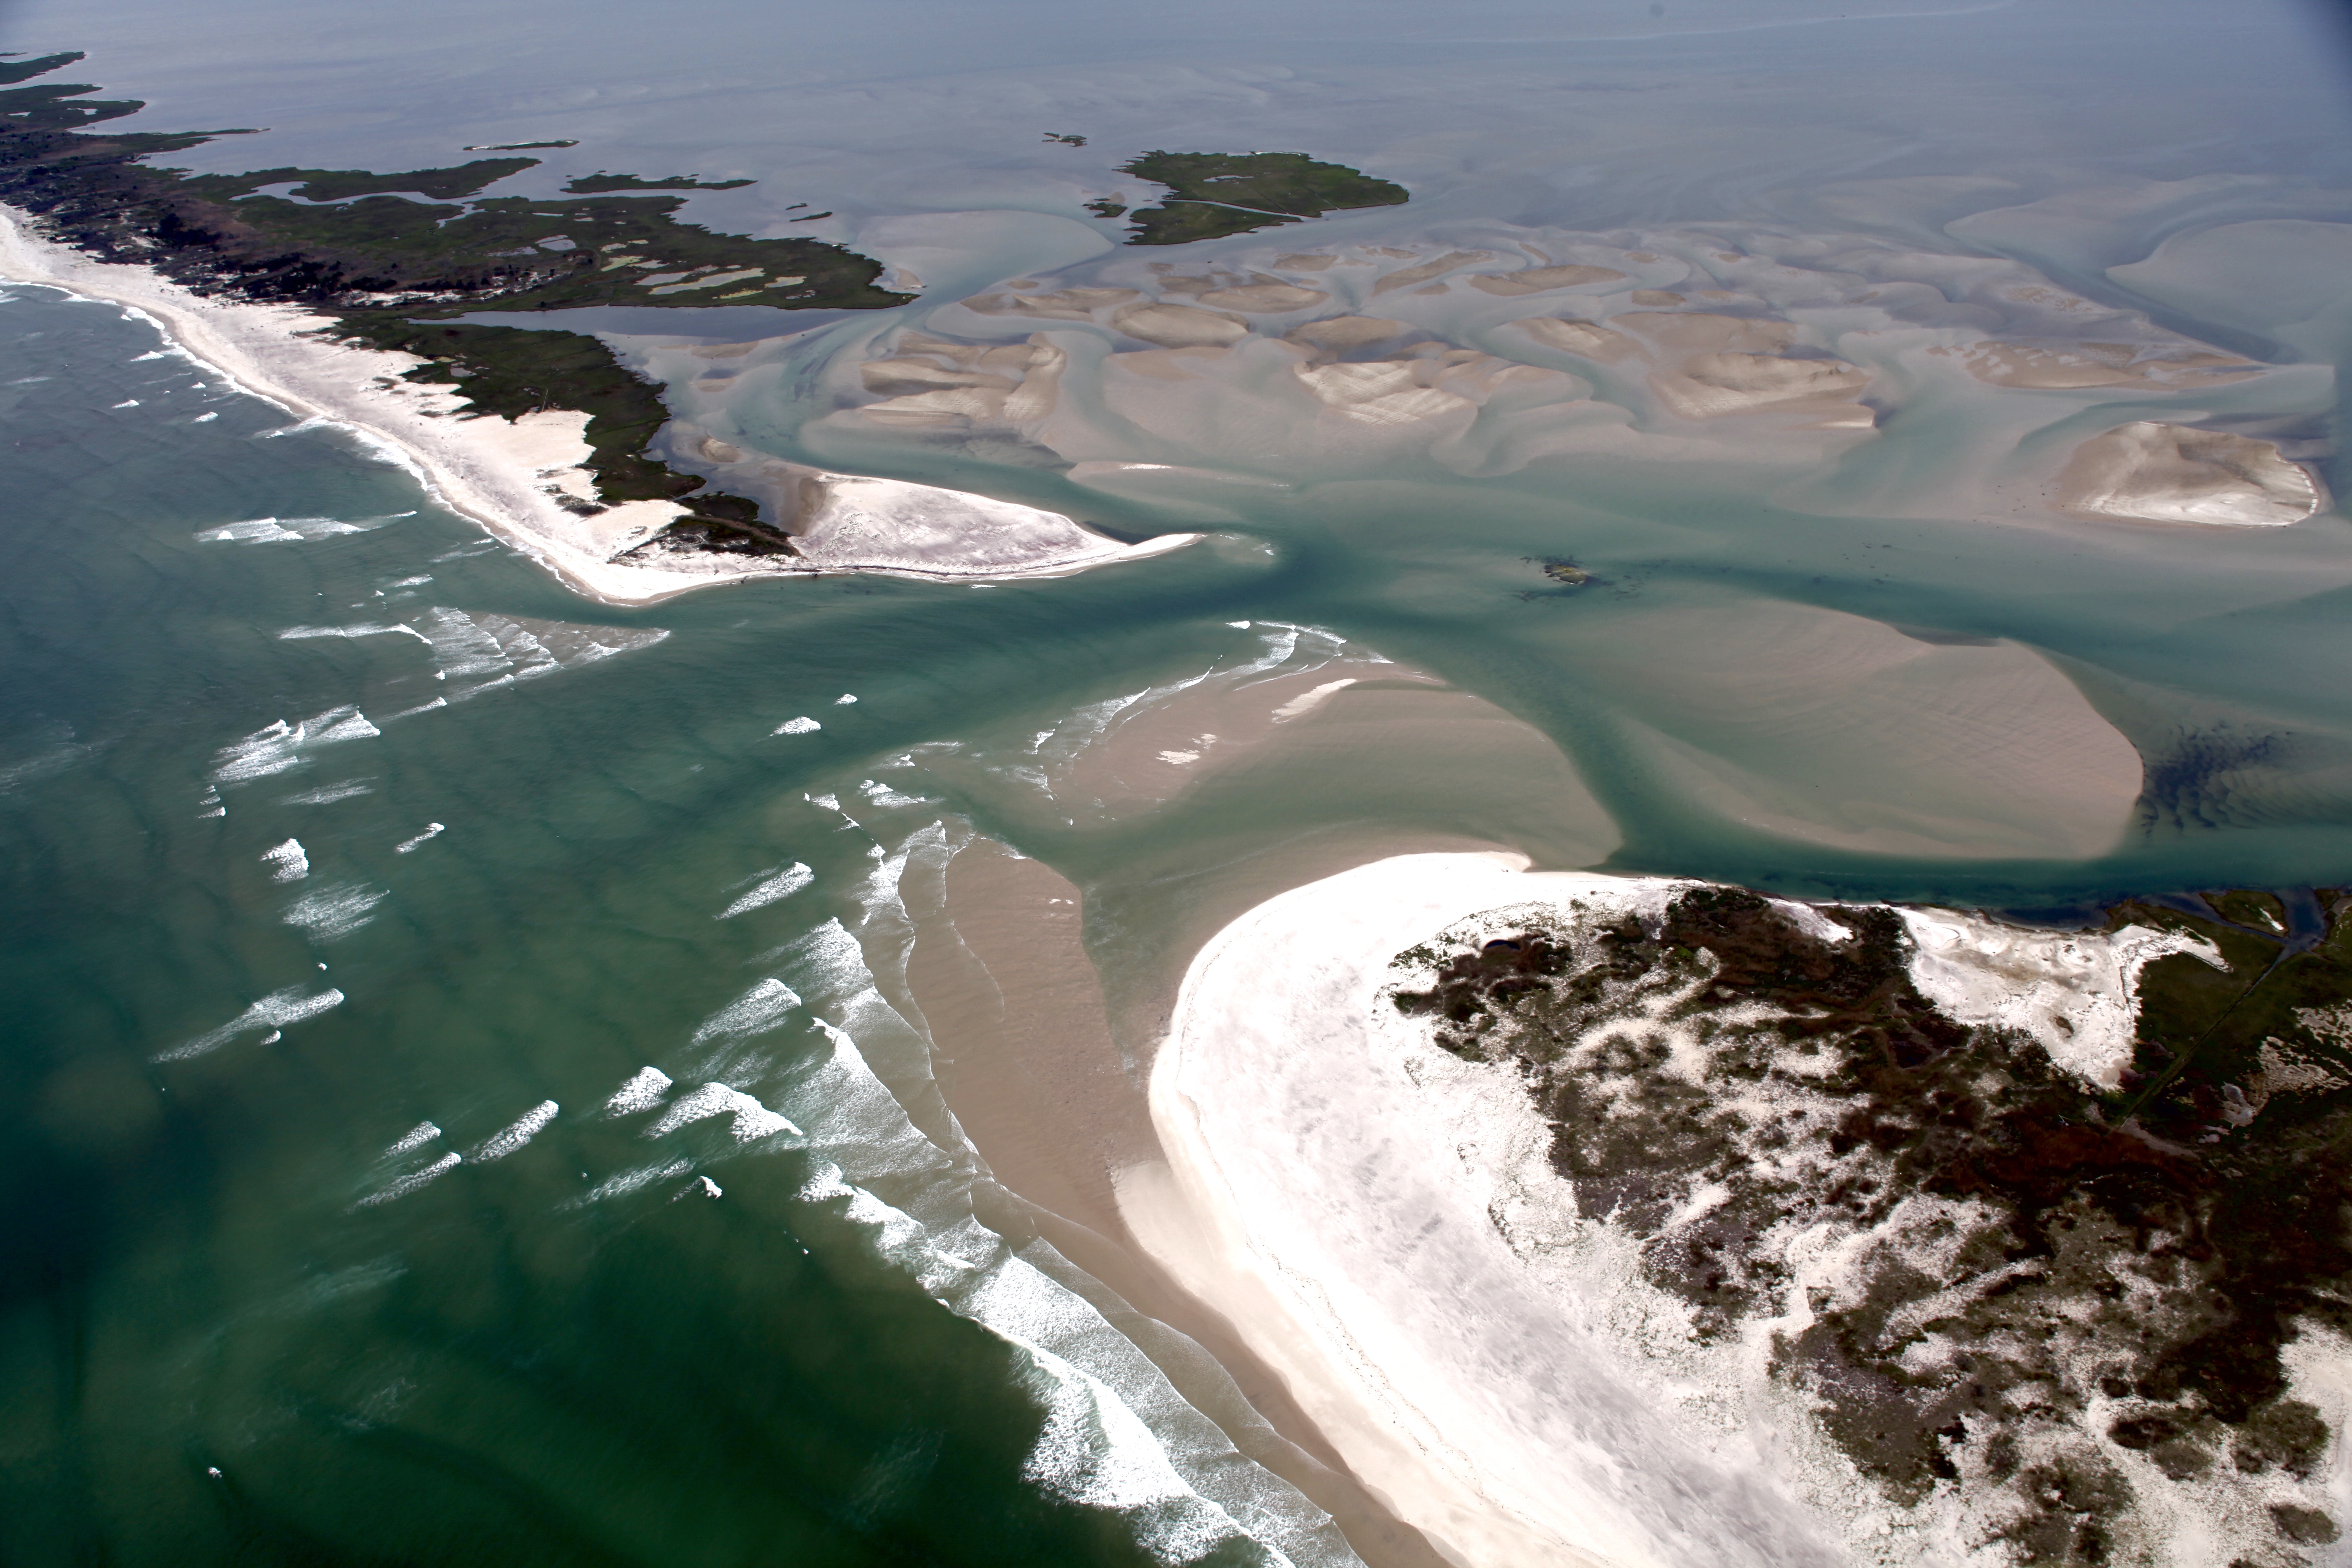 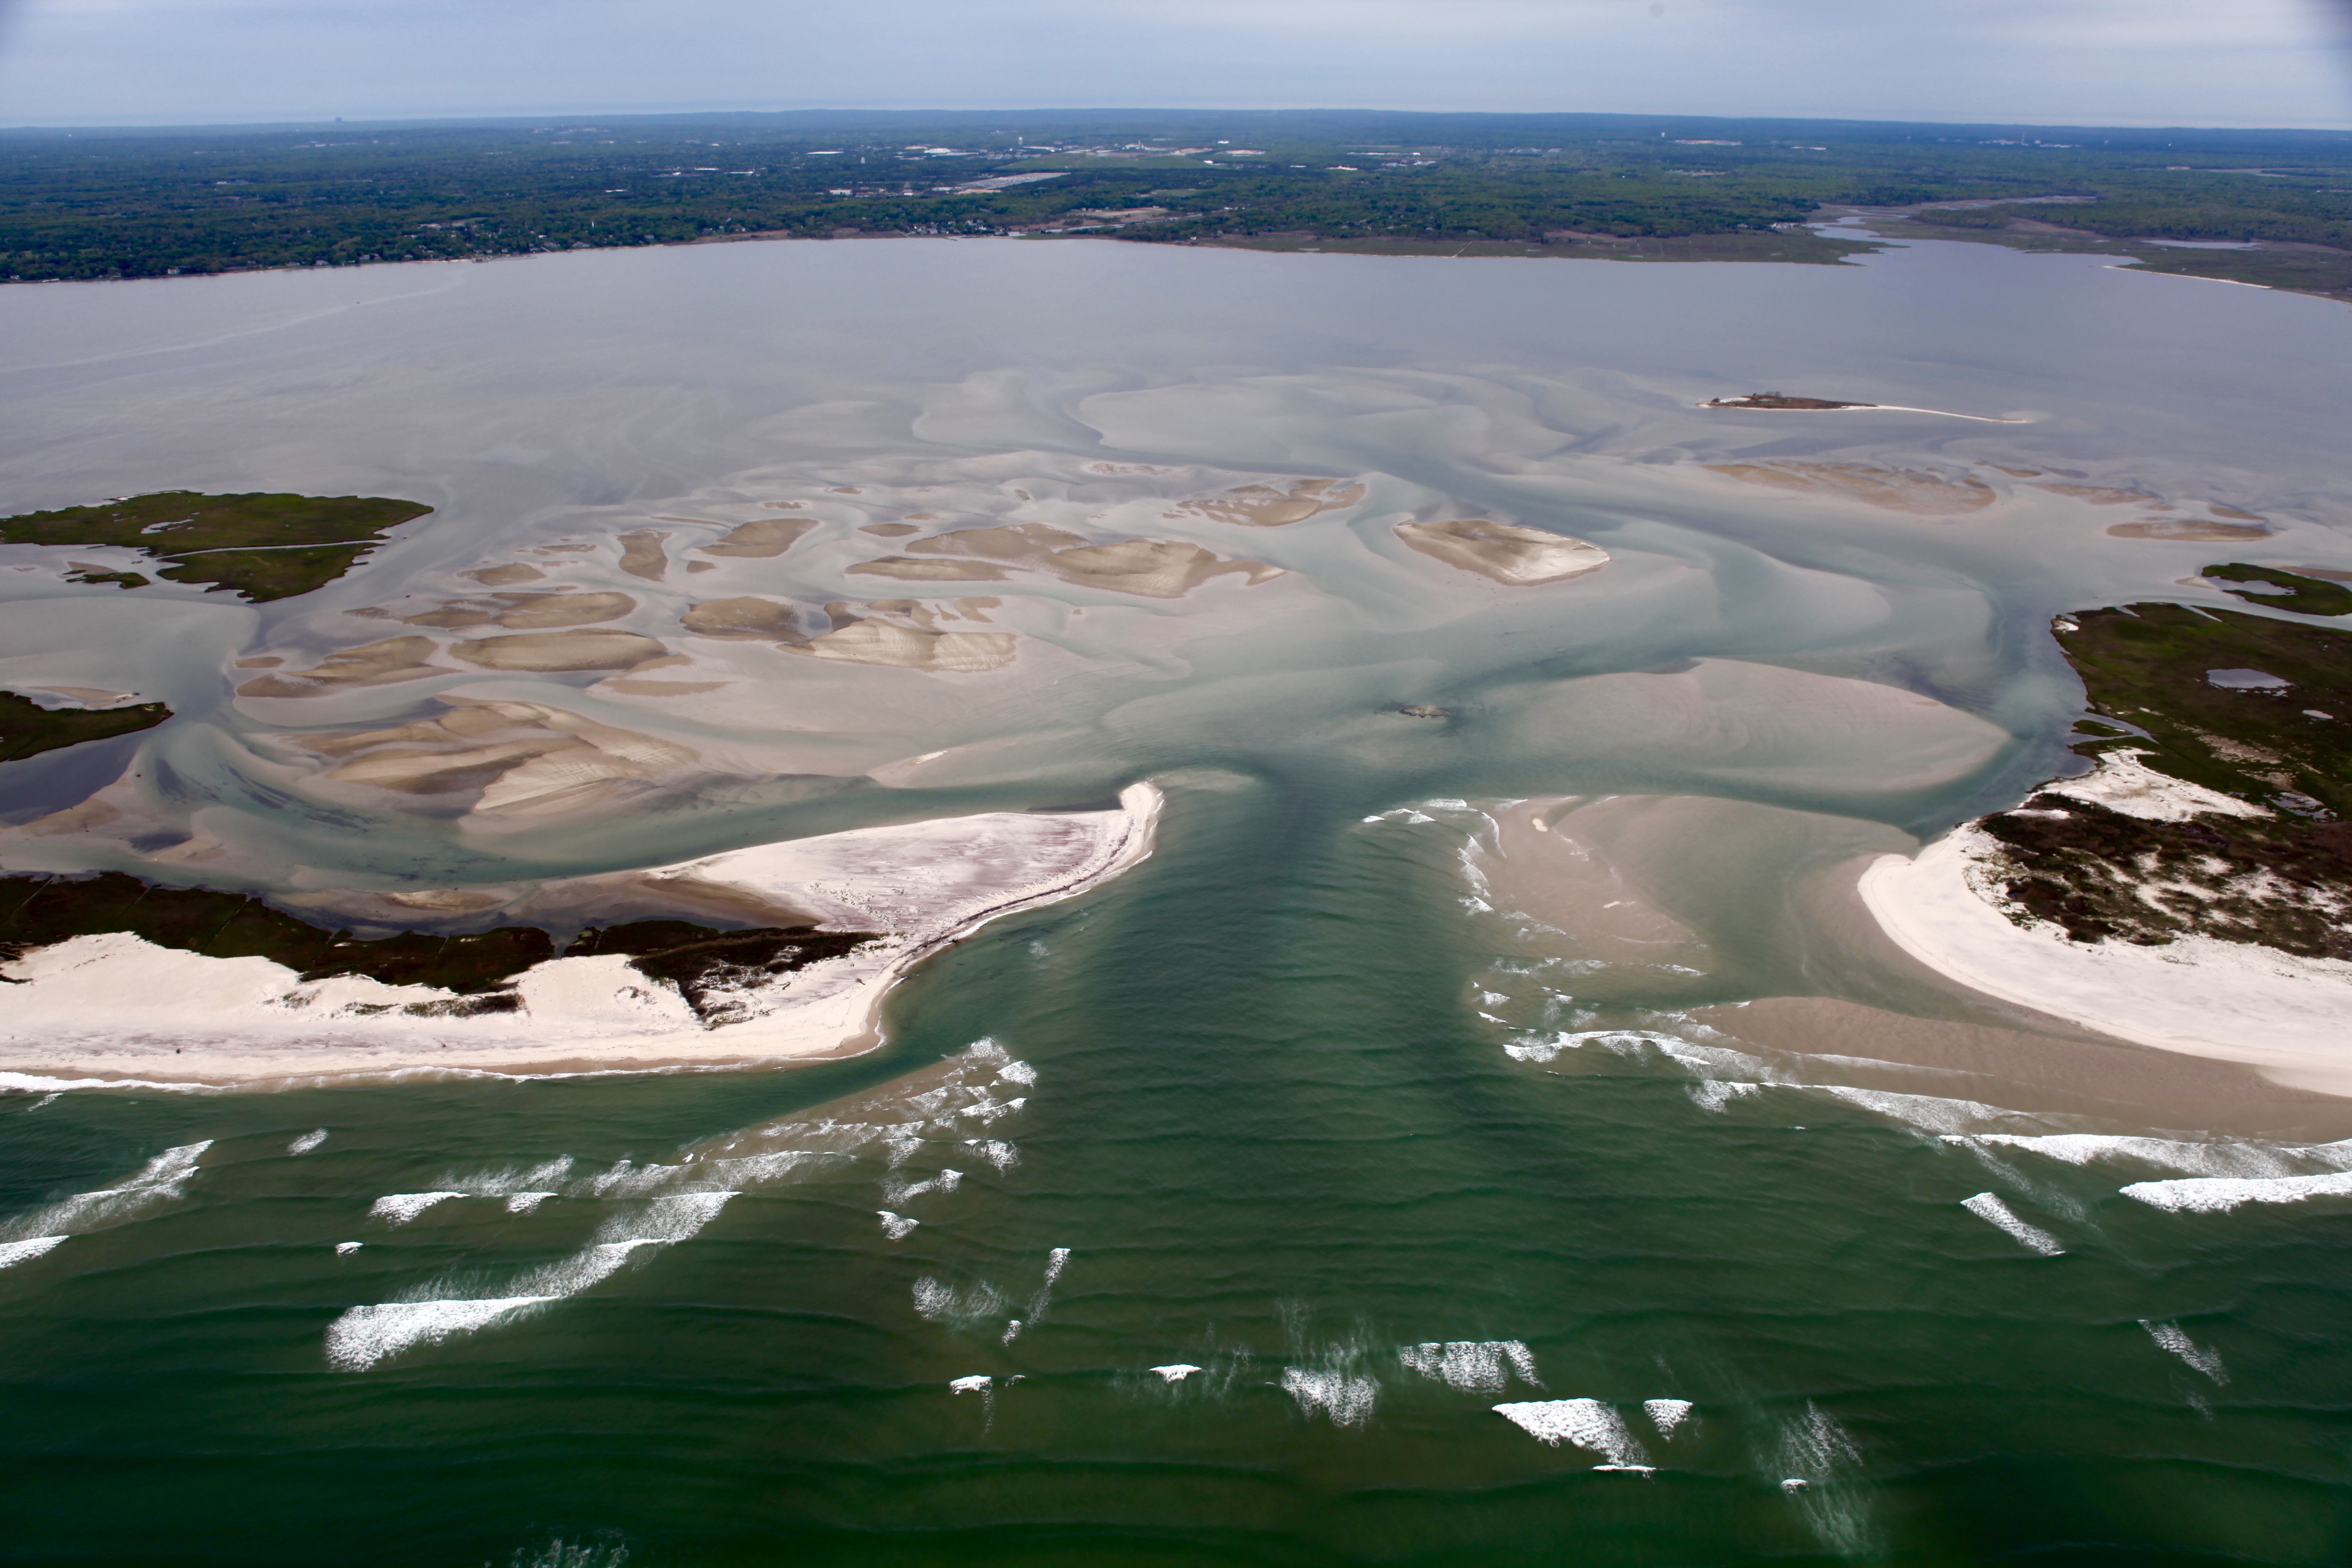 |
||||
May 25, 2018 (CF)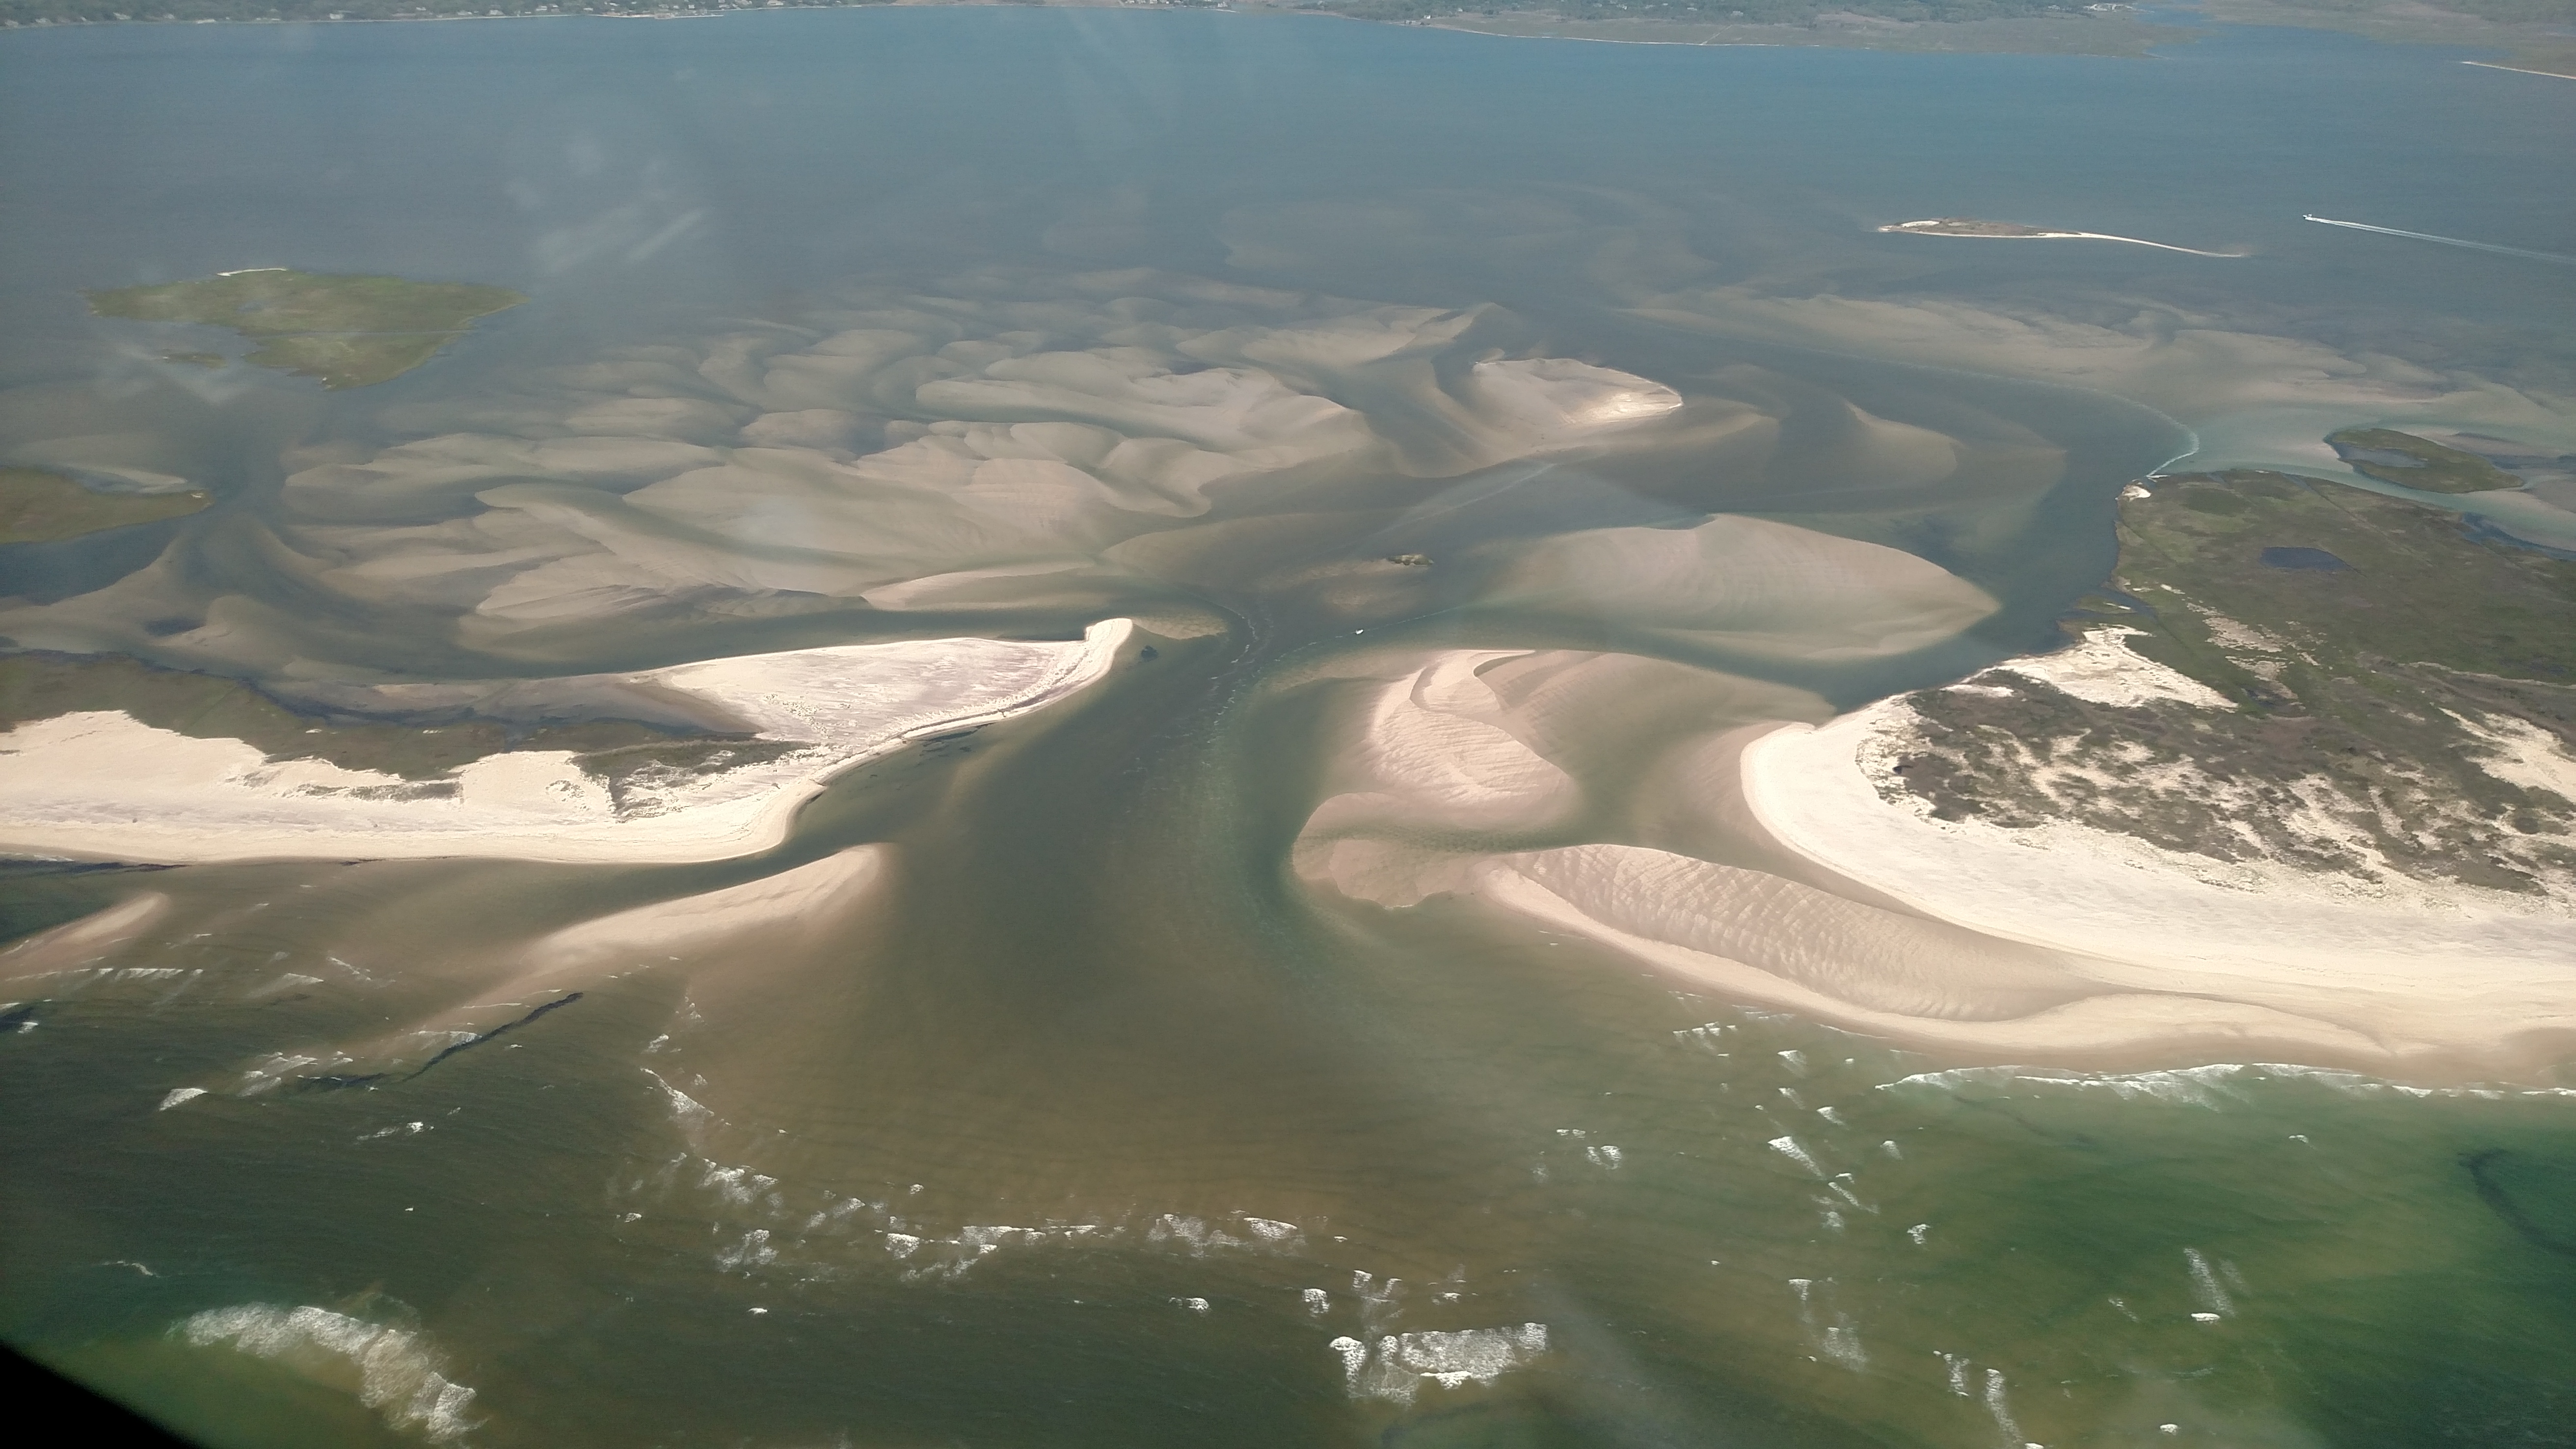 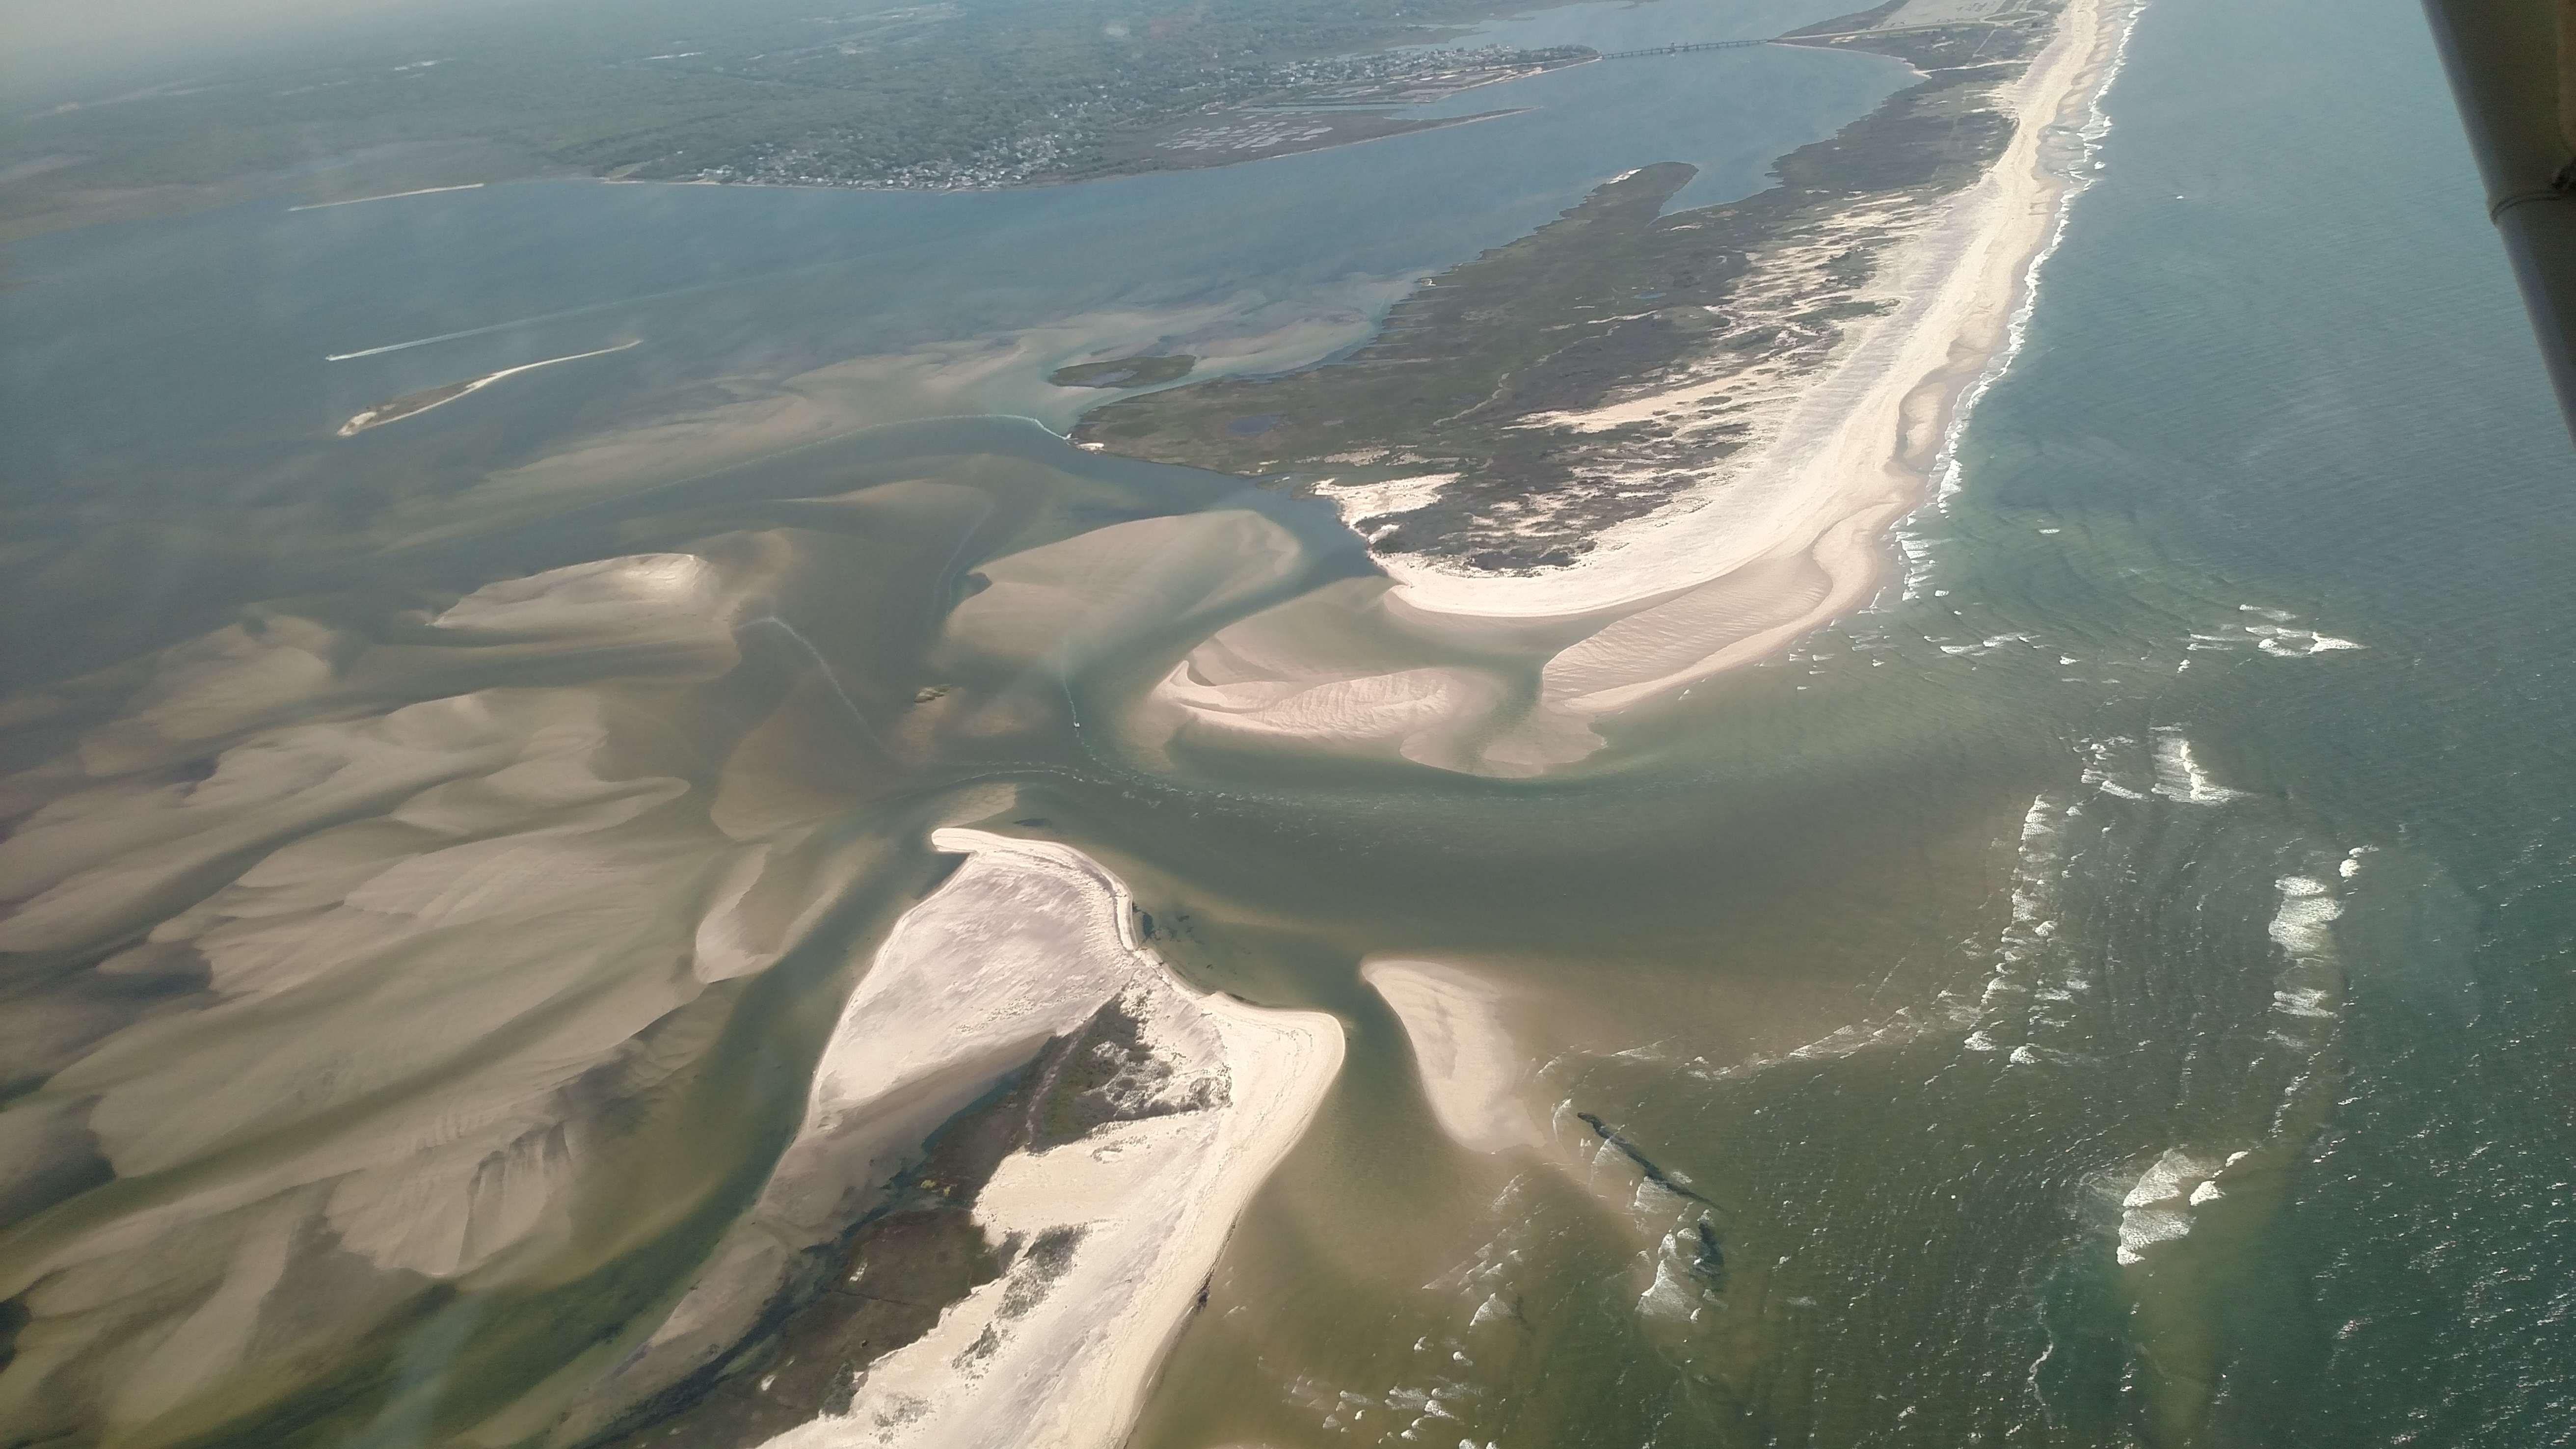 |
July 13, 2018 (CF)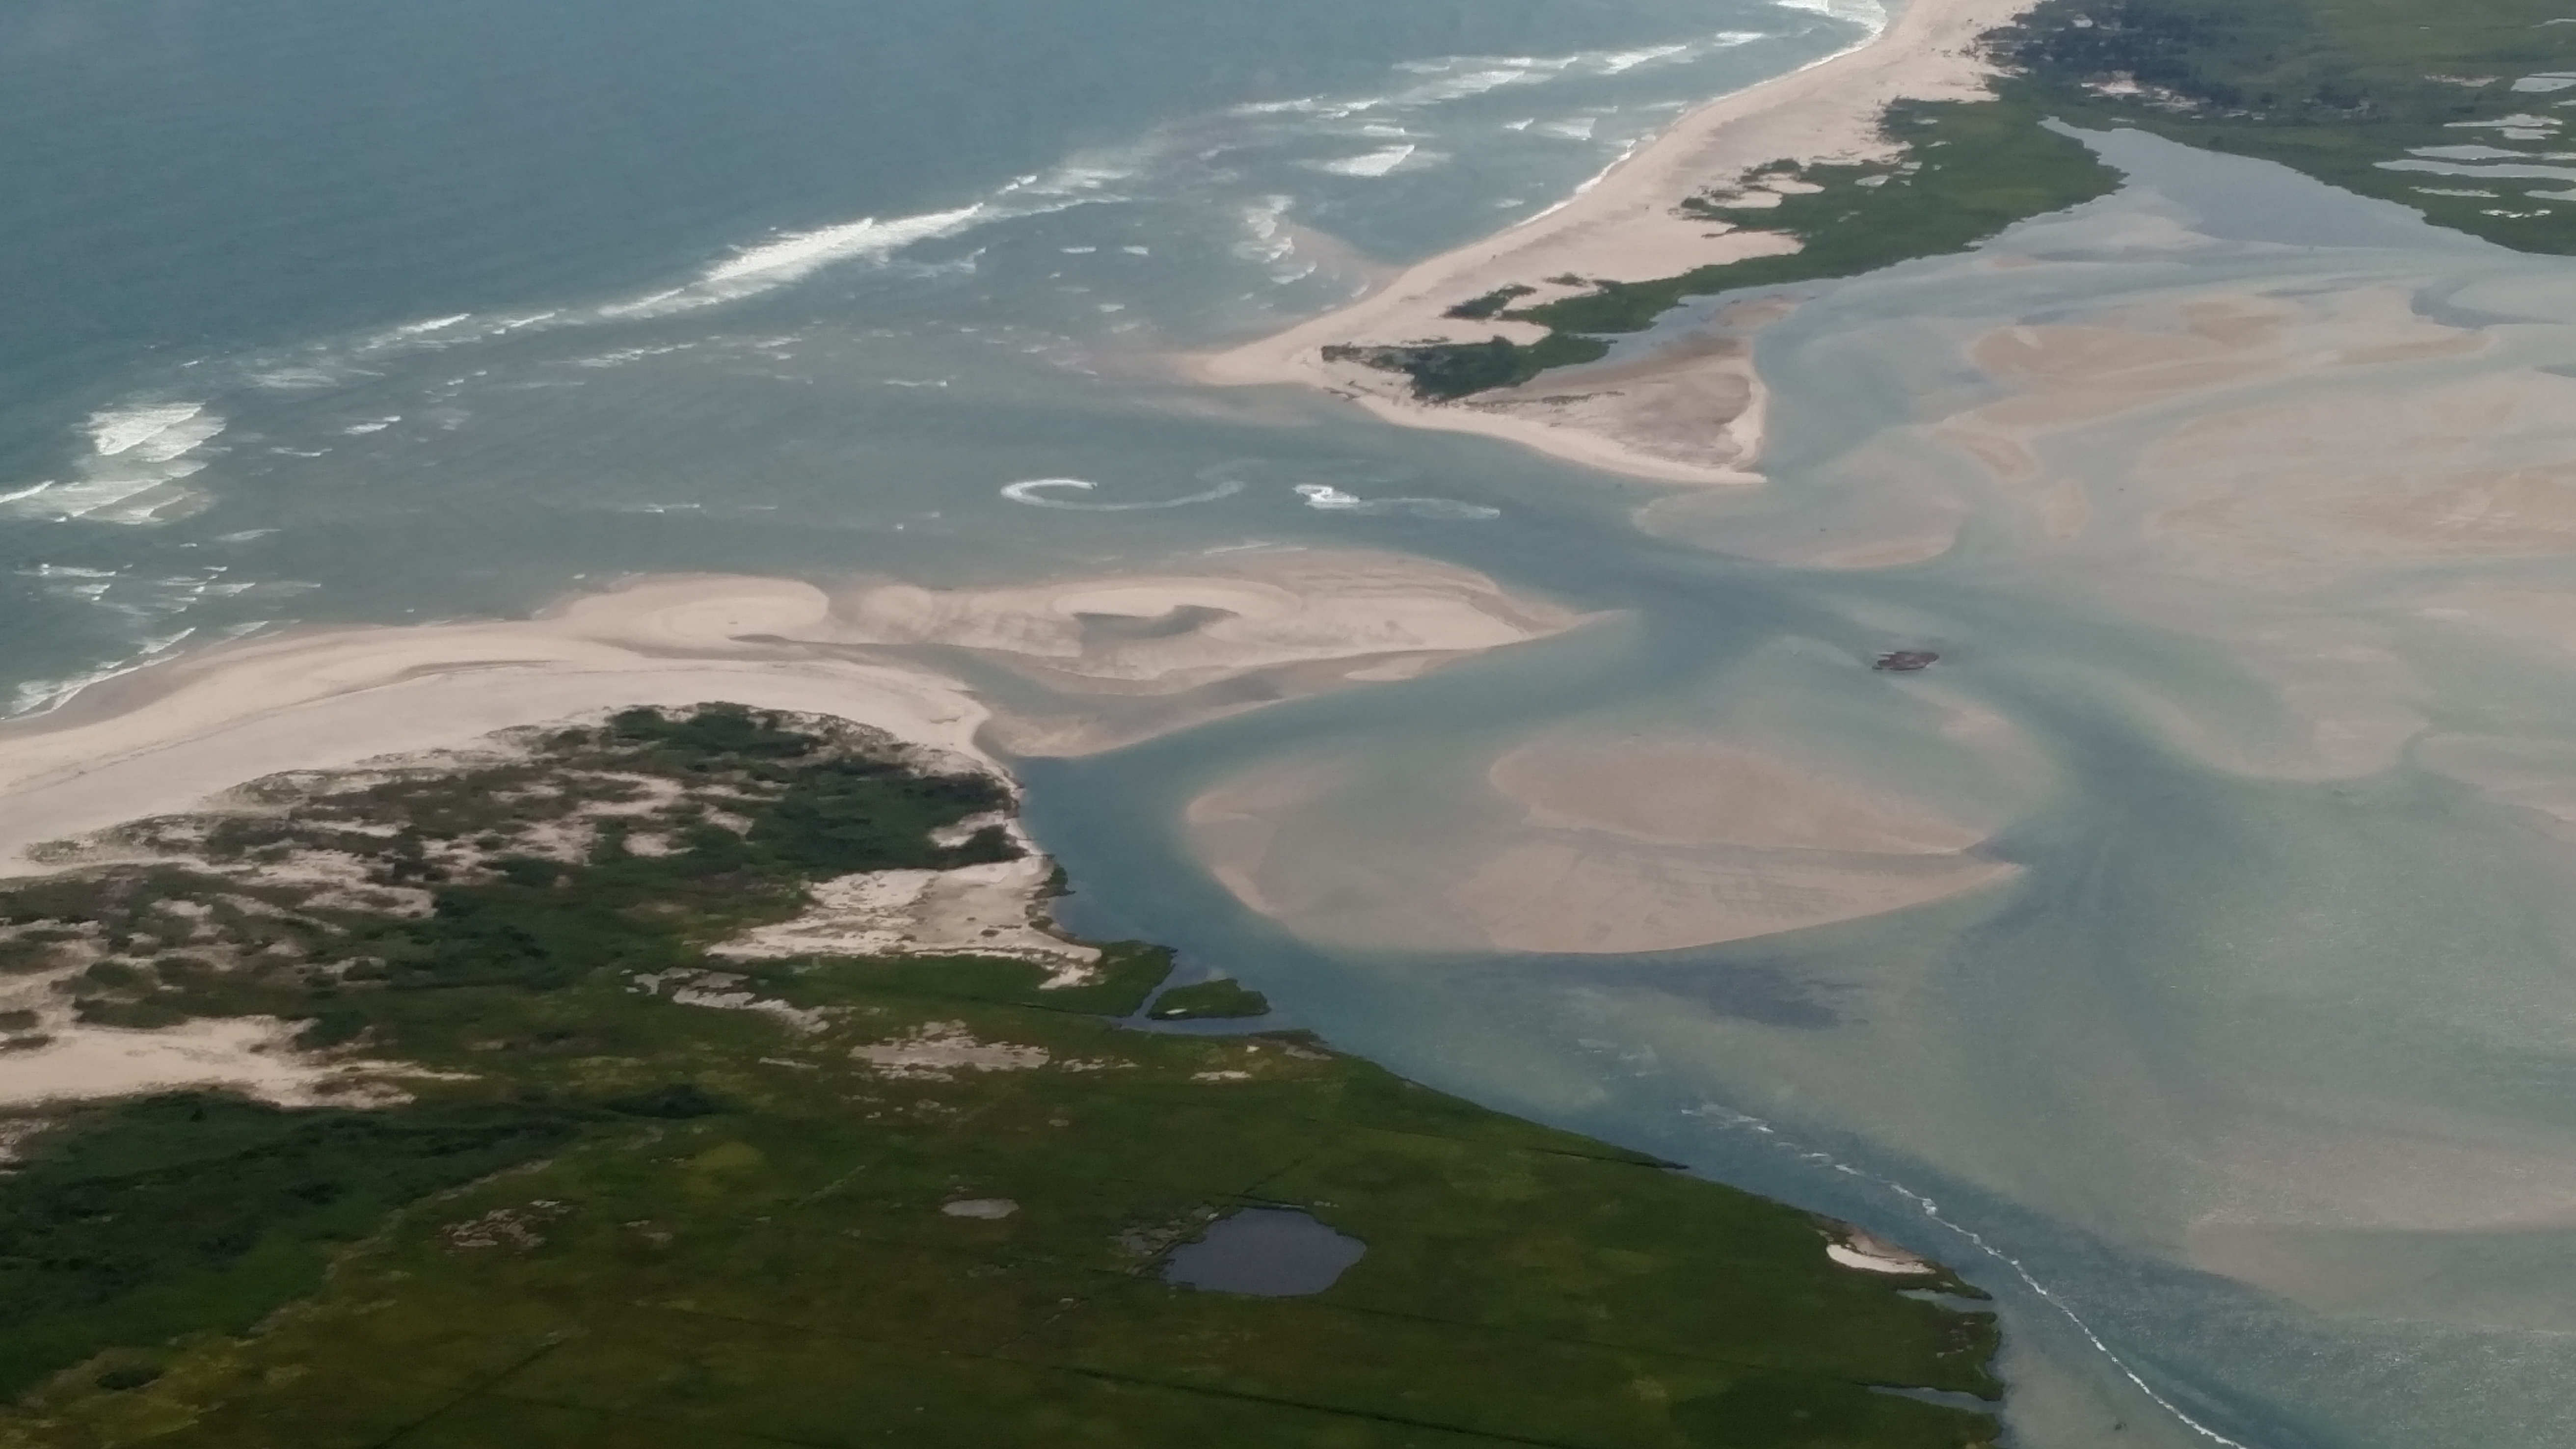 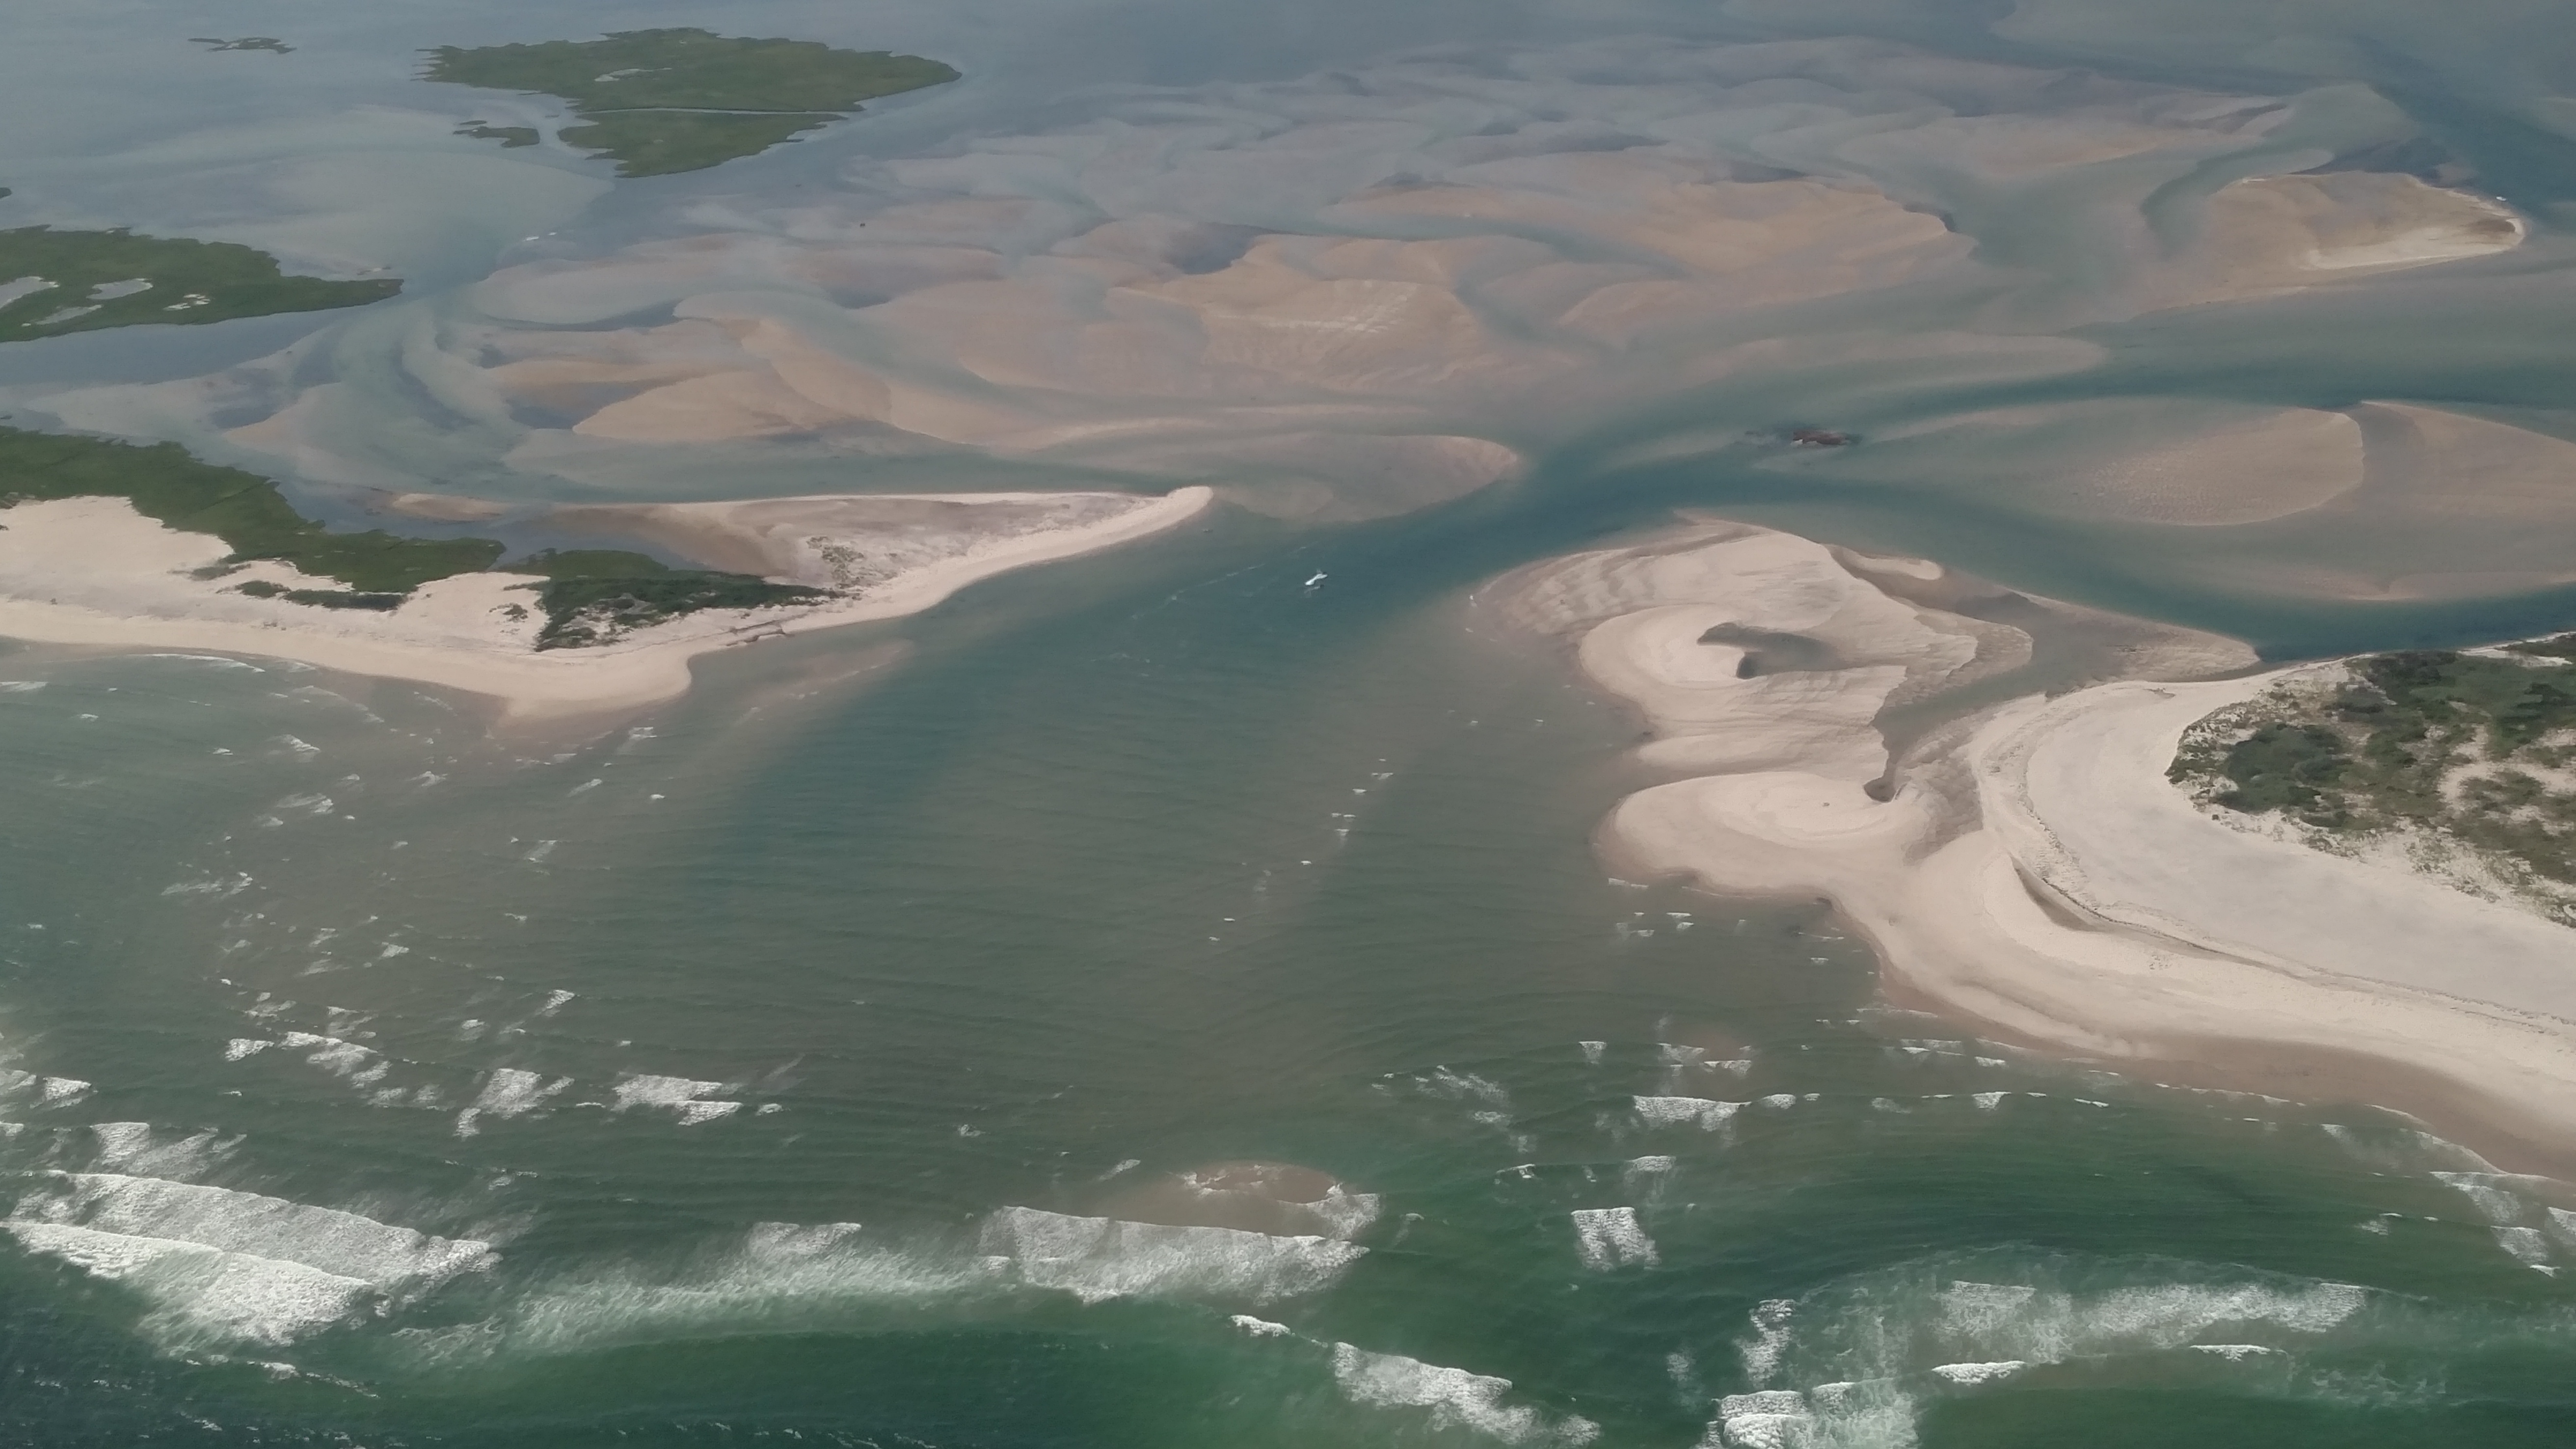 |
Aug 5, 2018 (CF)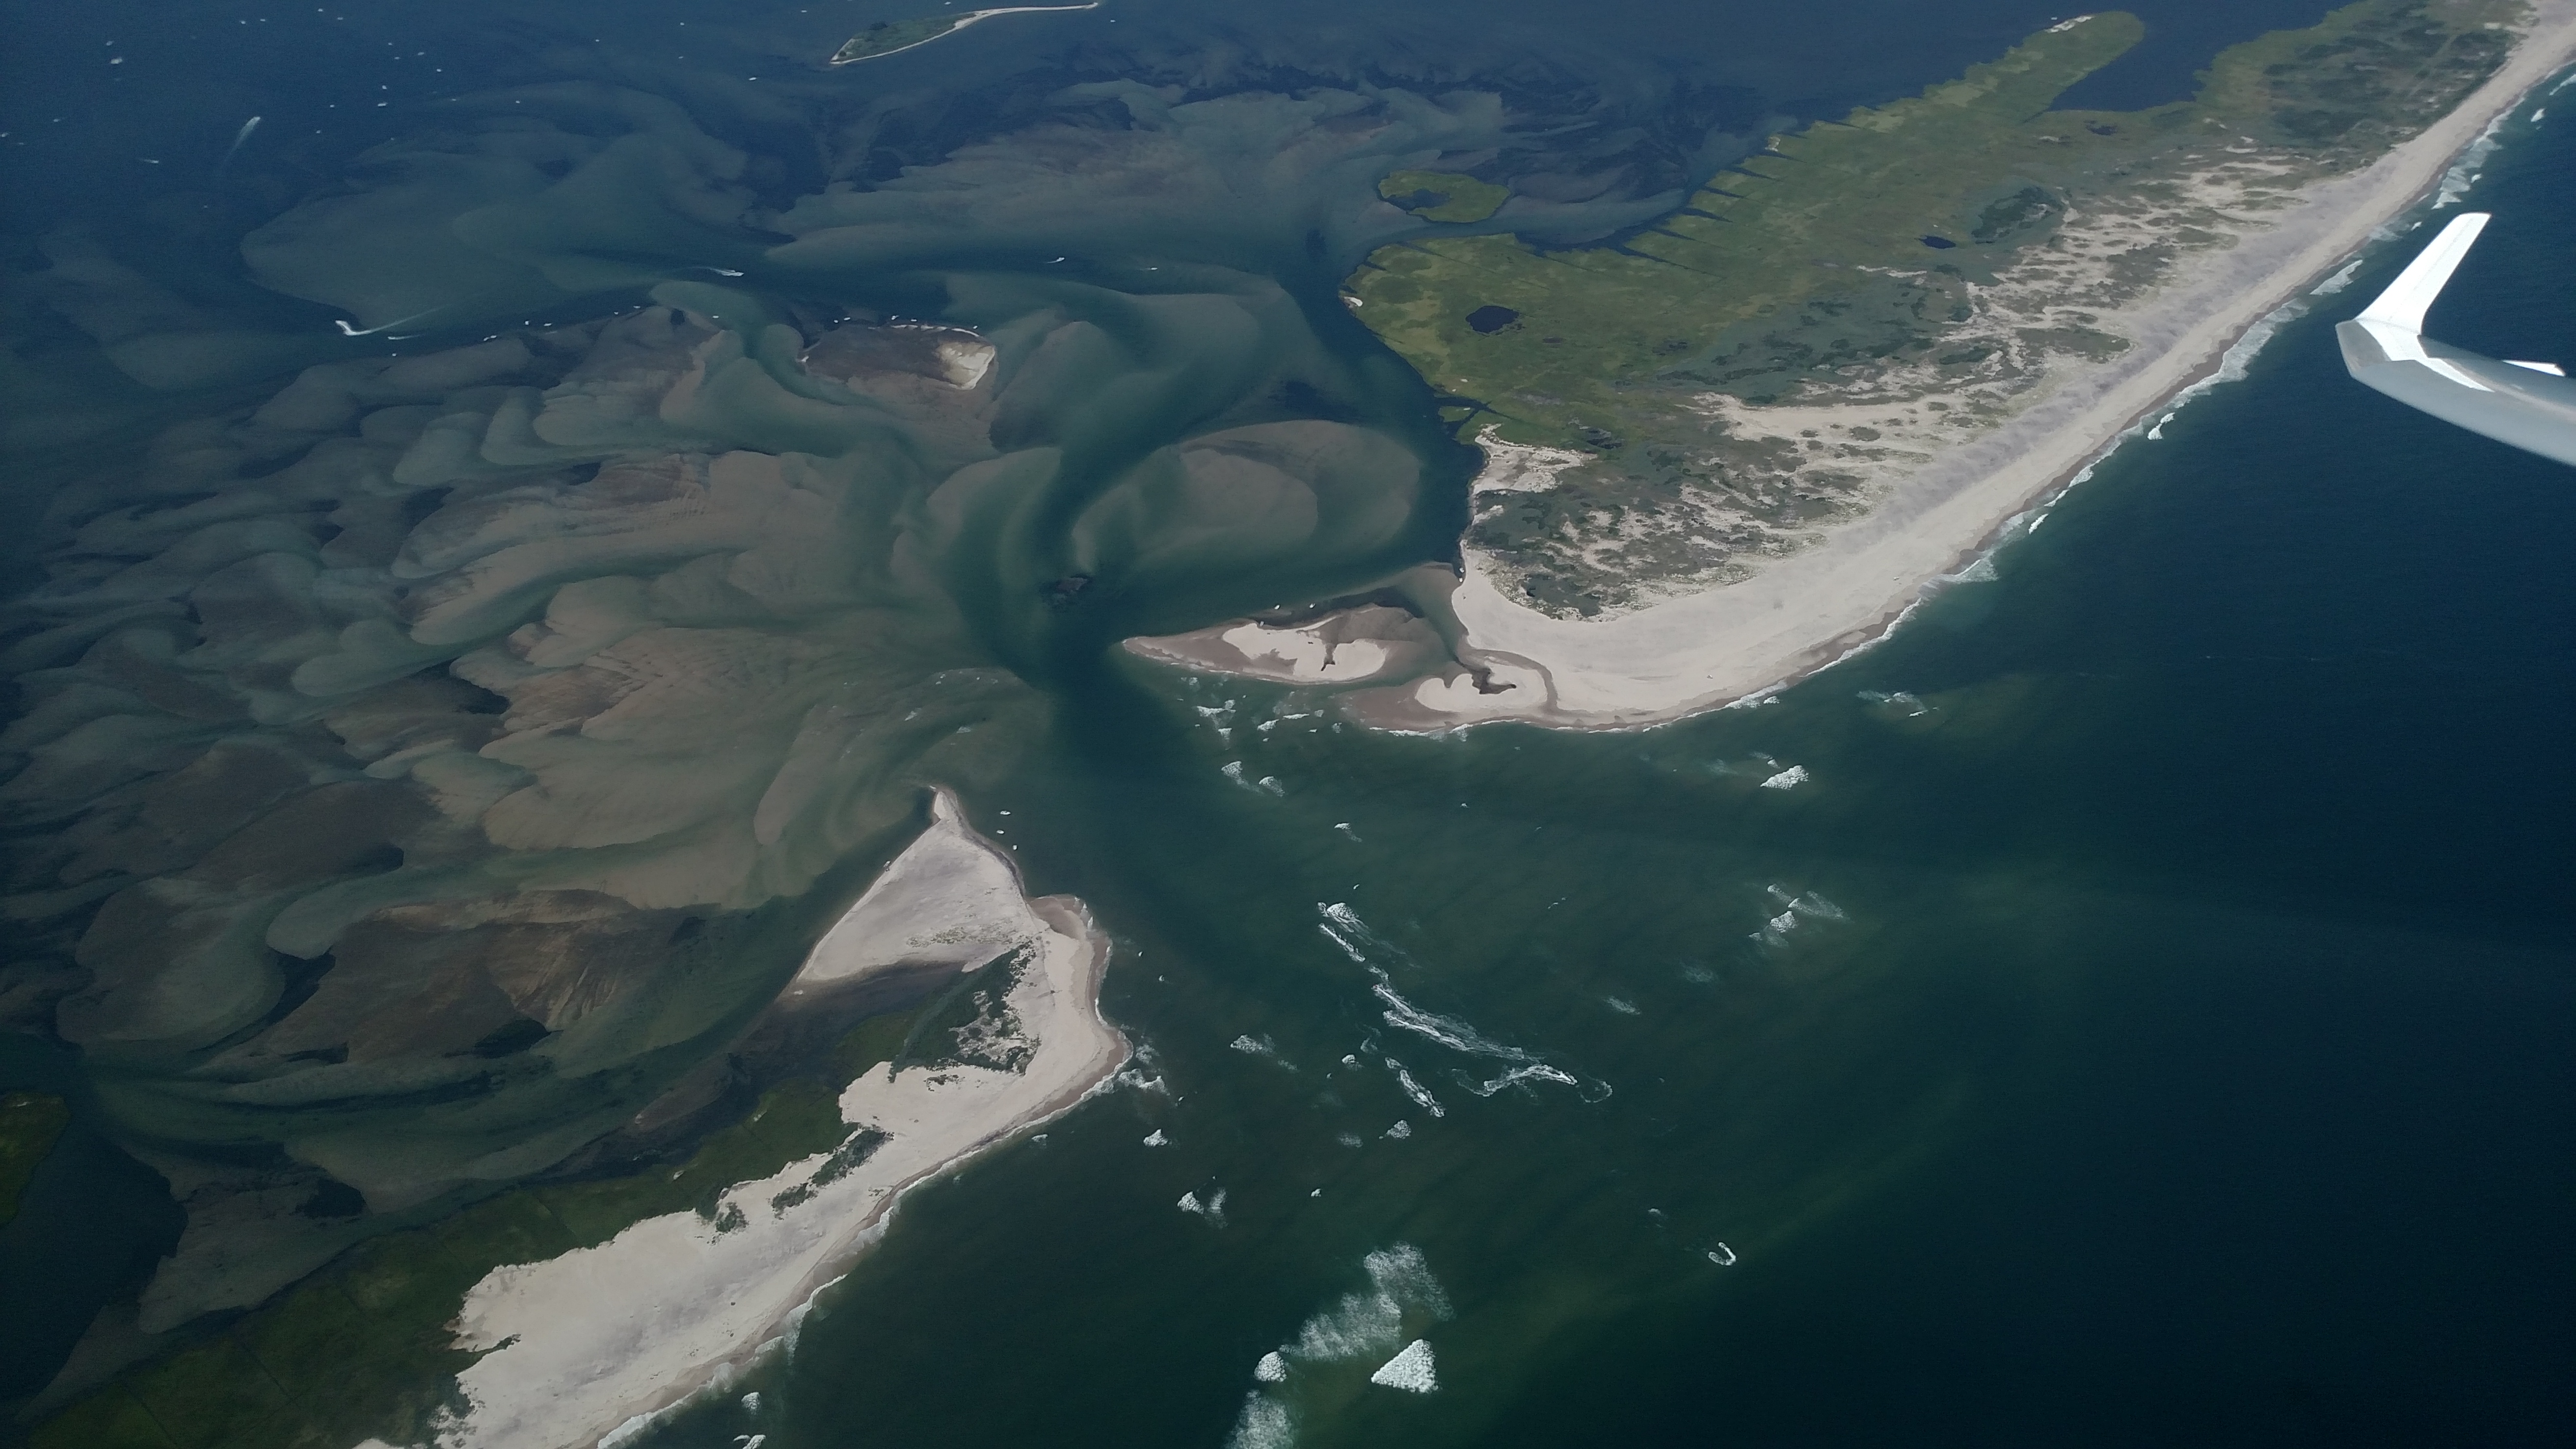 |
Aug 7, 2018 (CF) 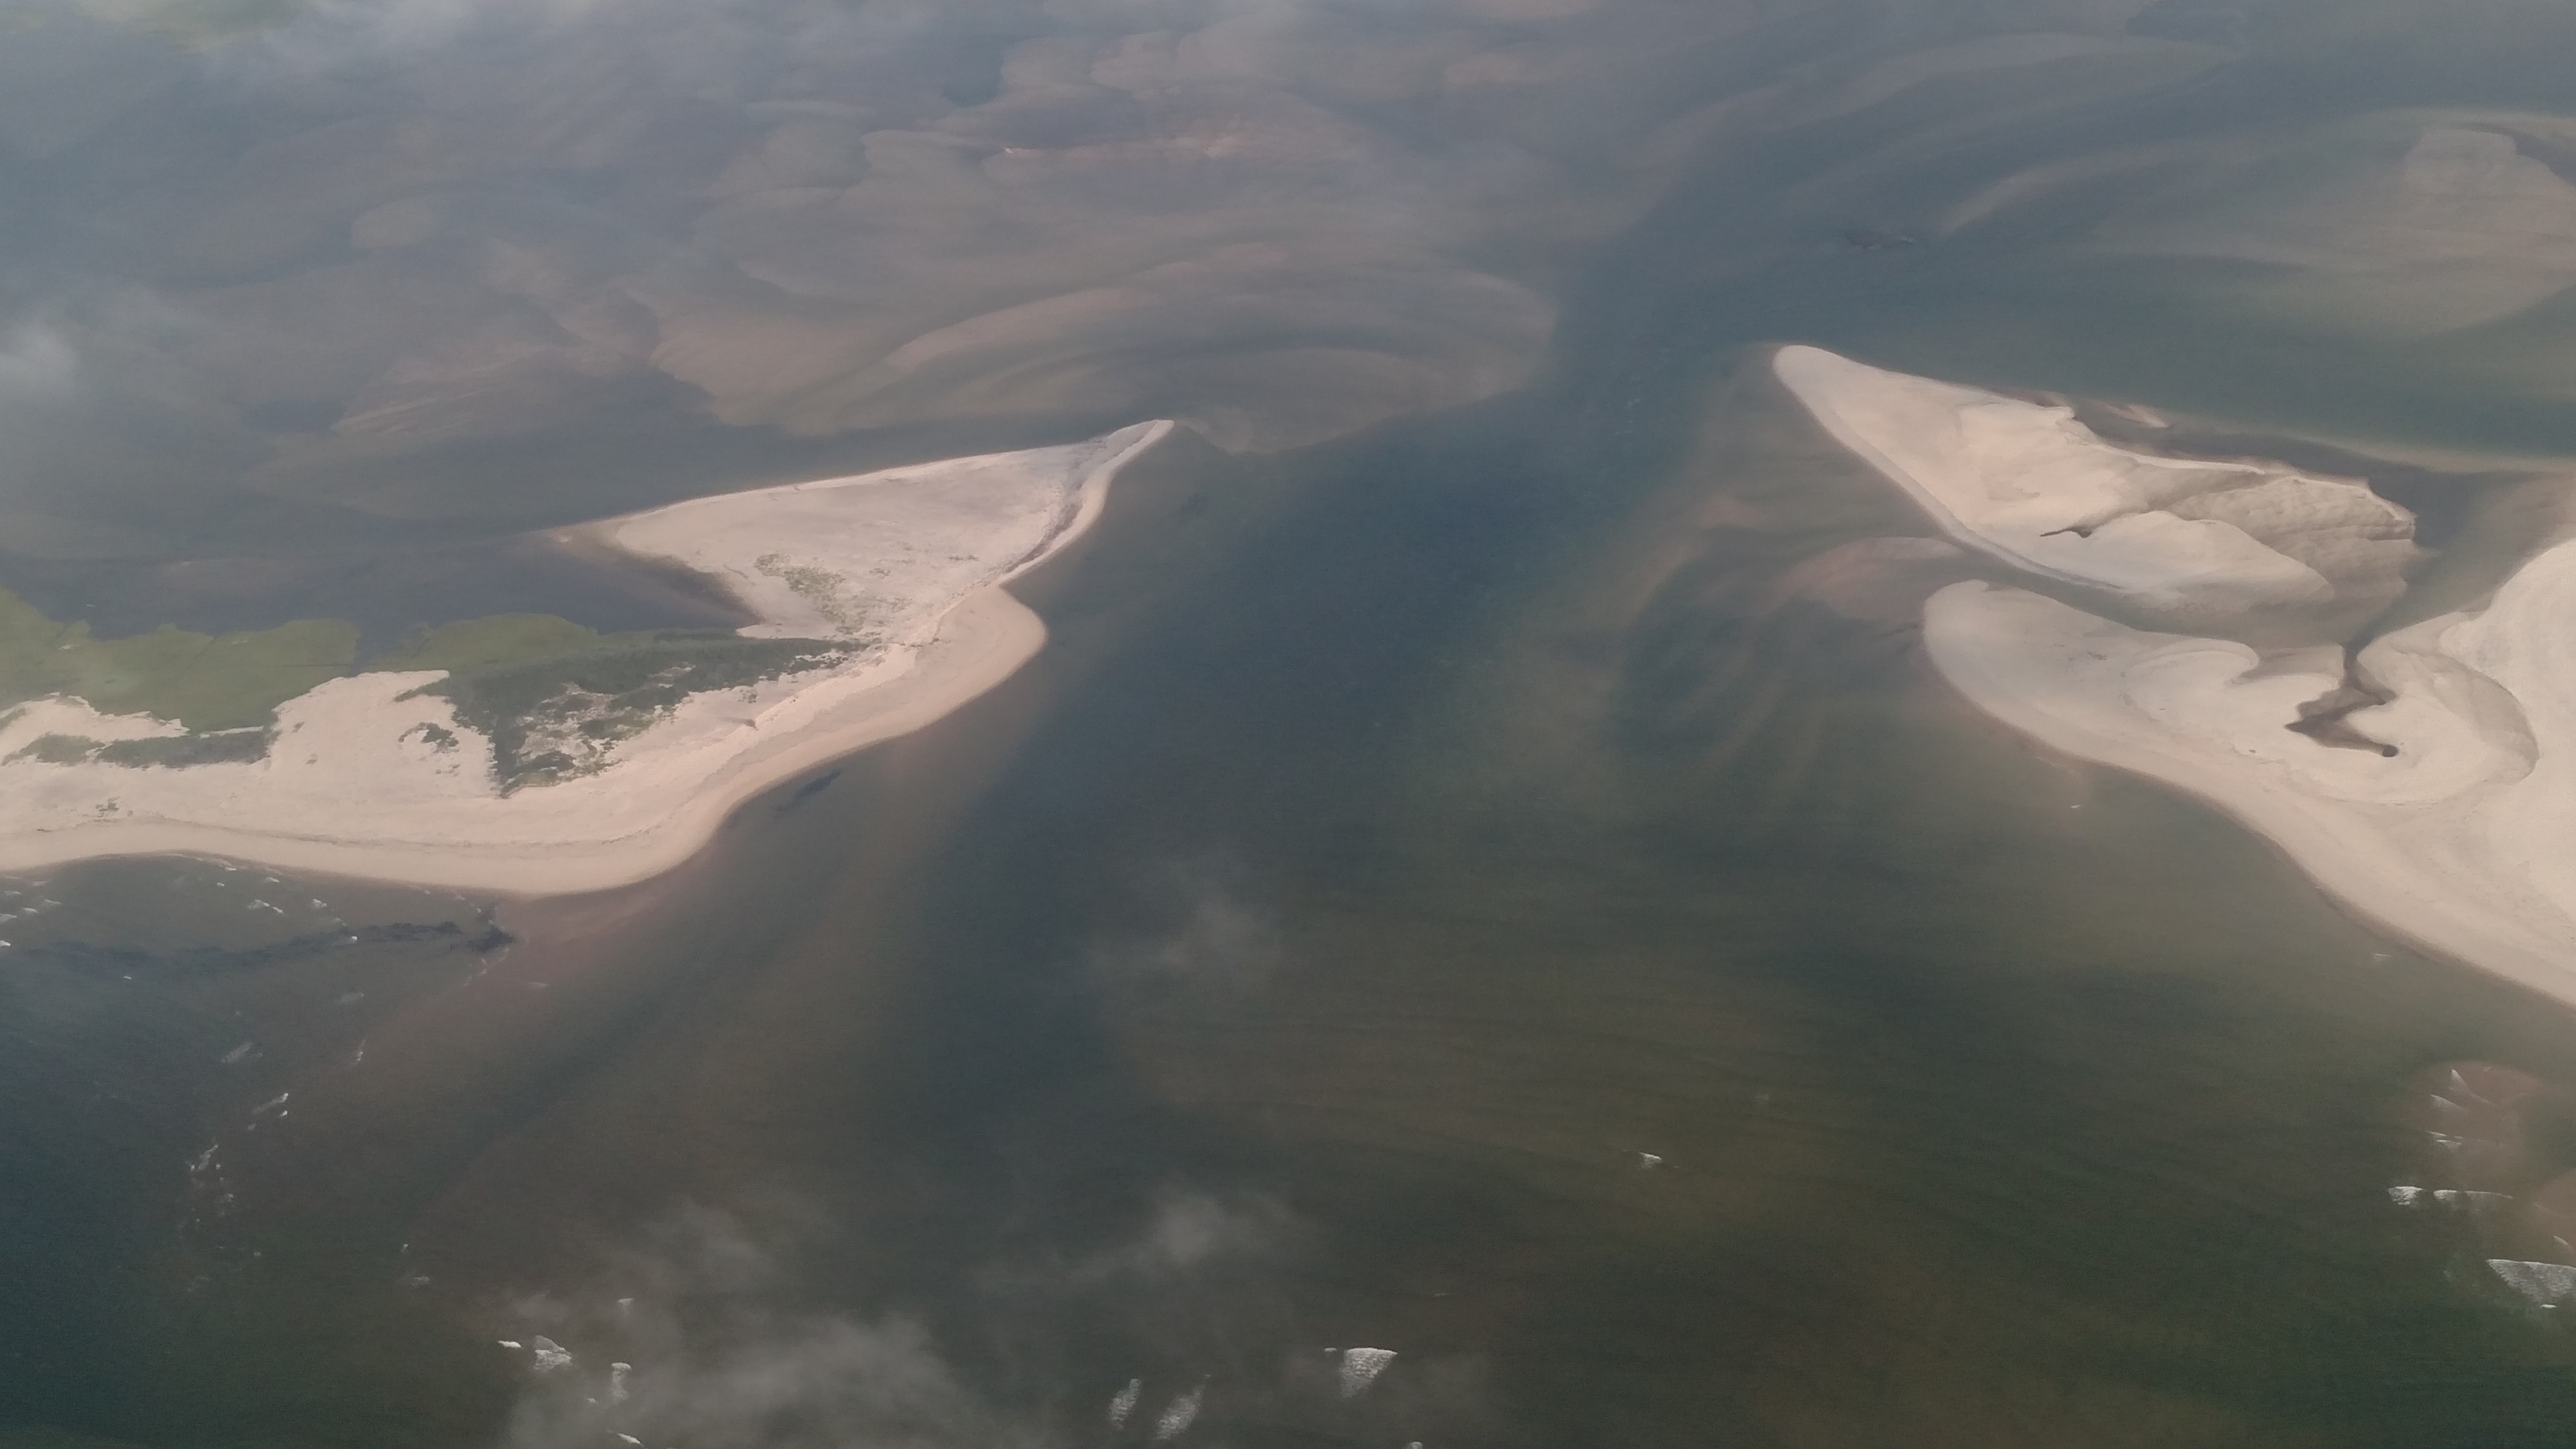 |
||||
Aug 10, 2018 (CF)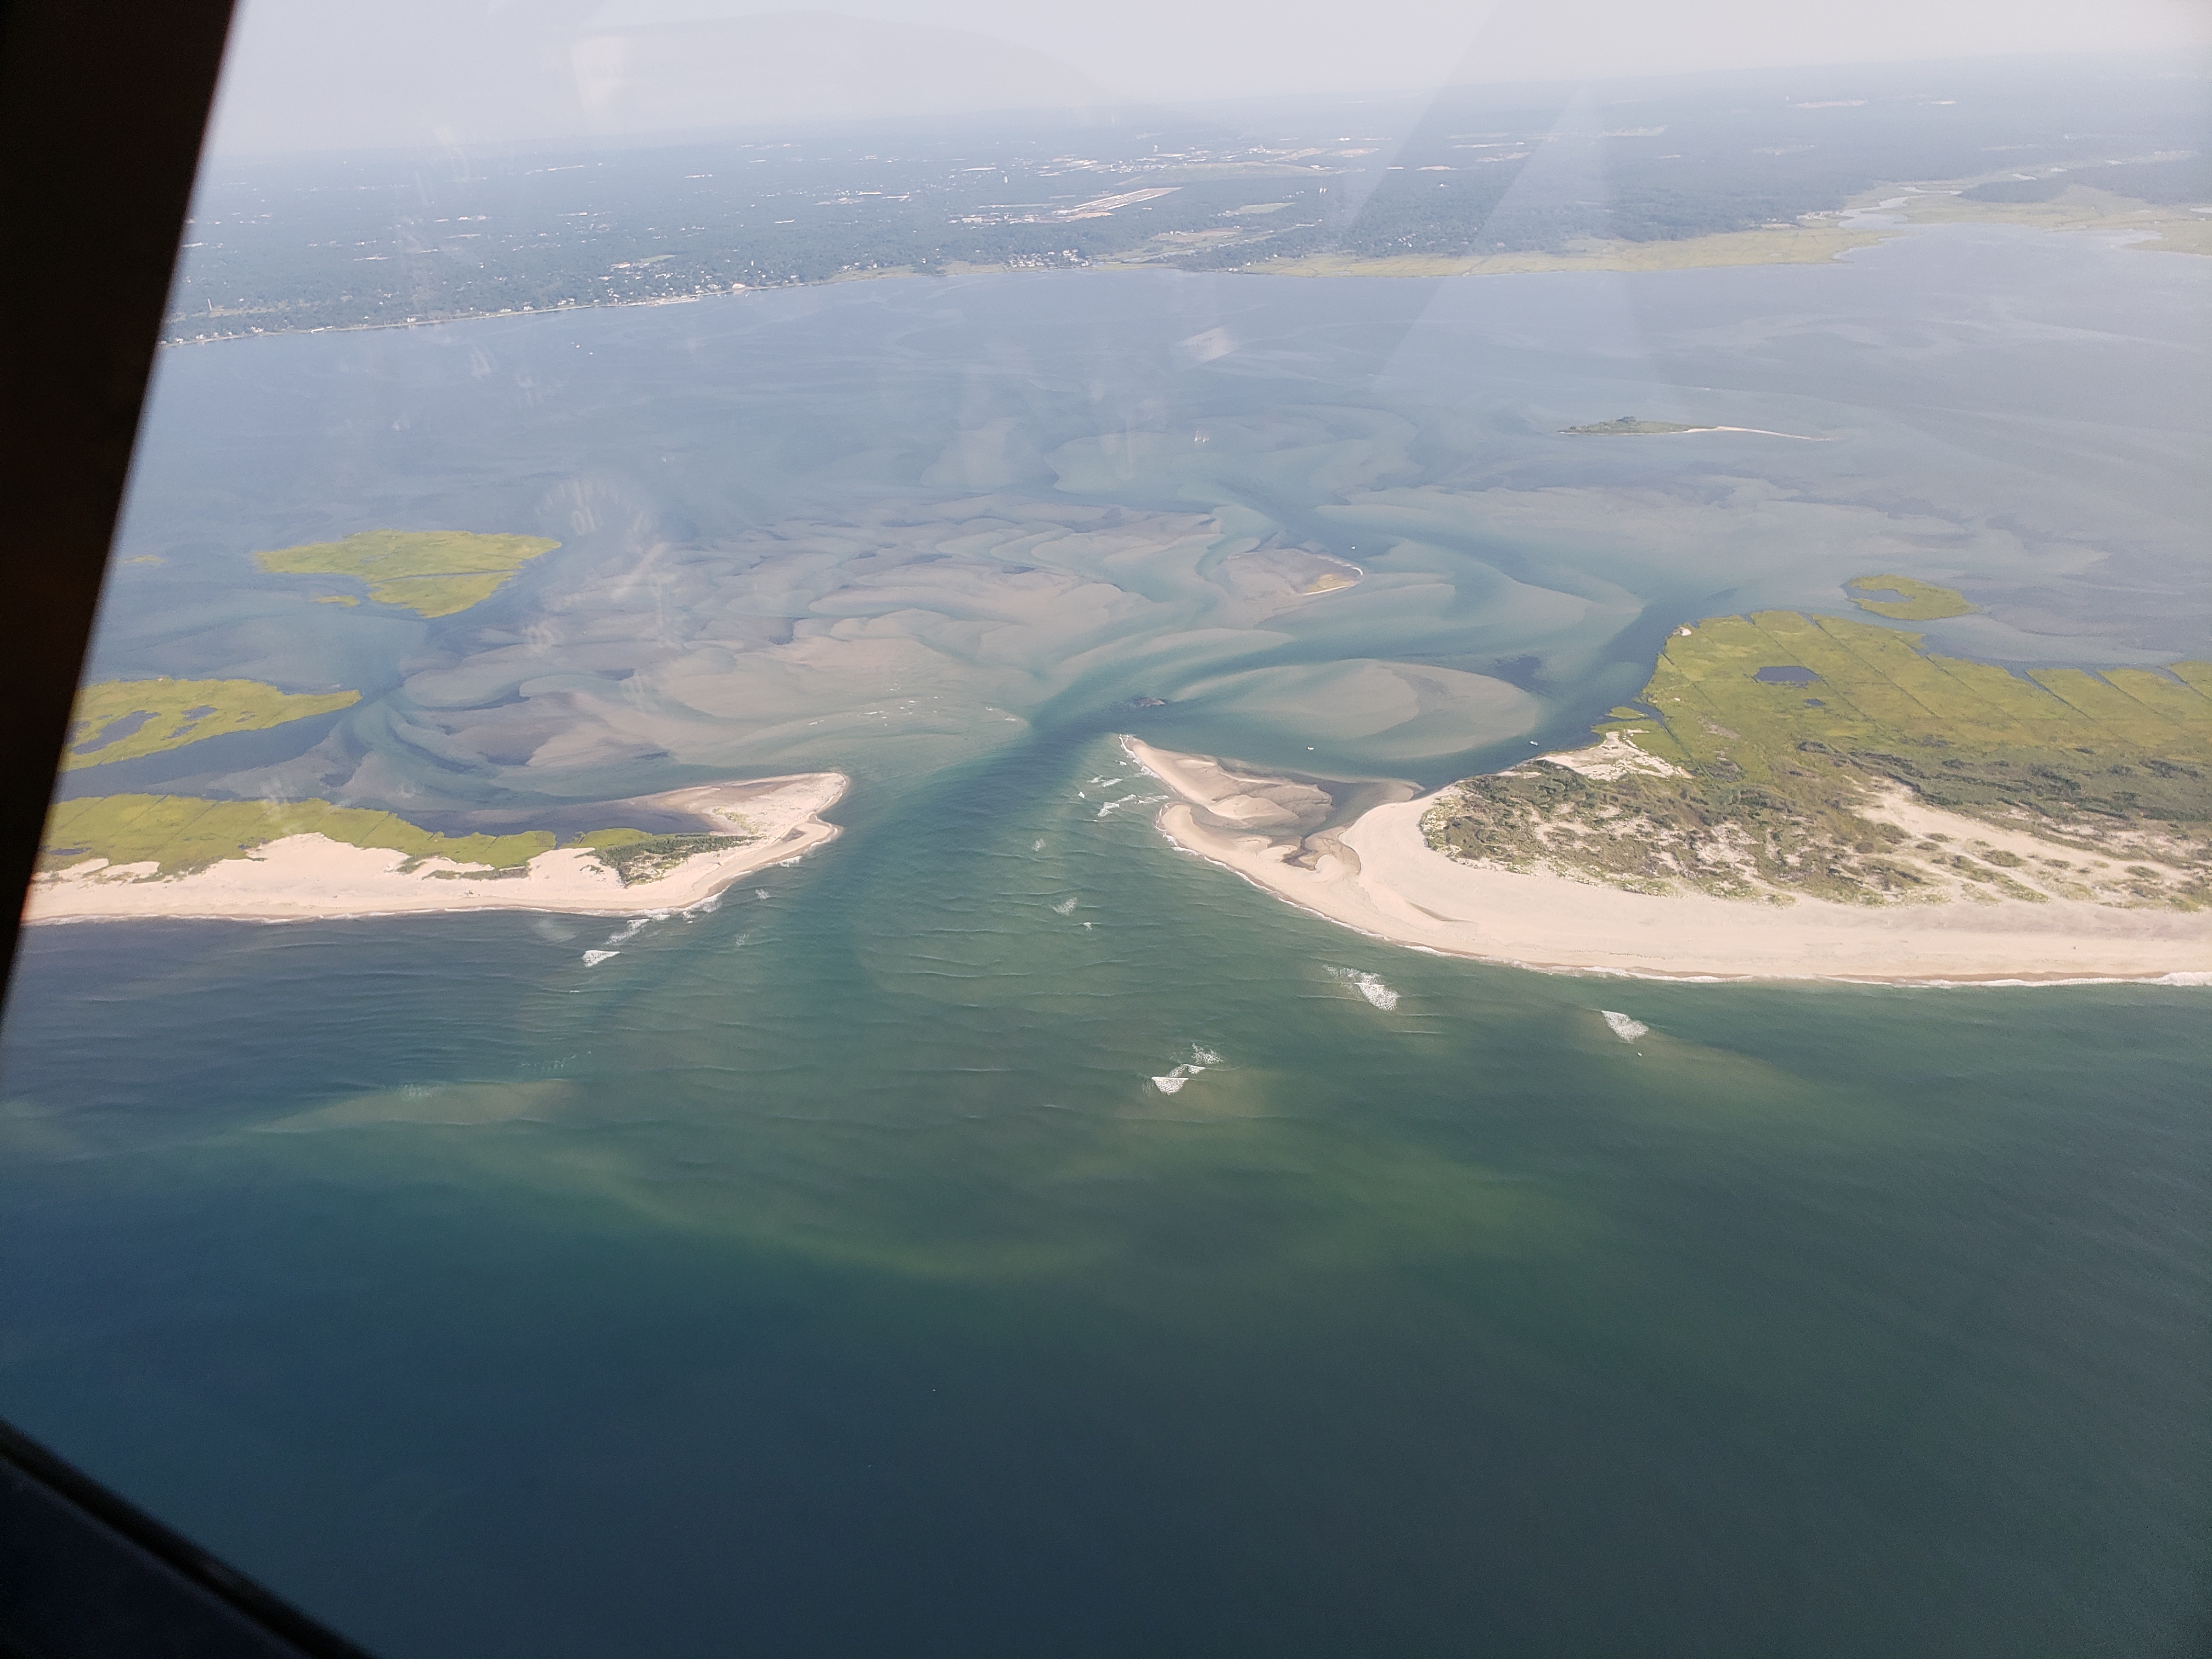 |
Sept 16, 2018 (CF&DS)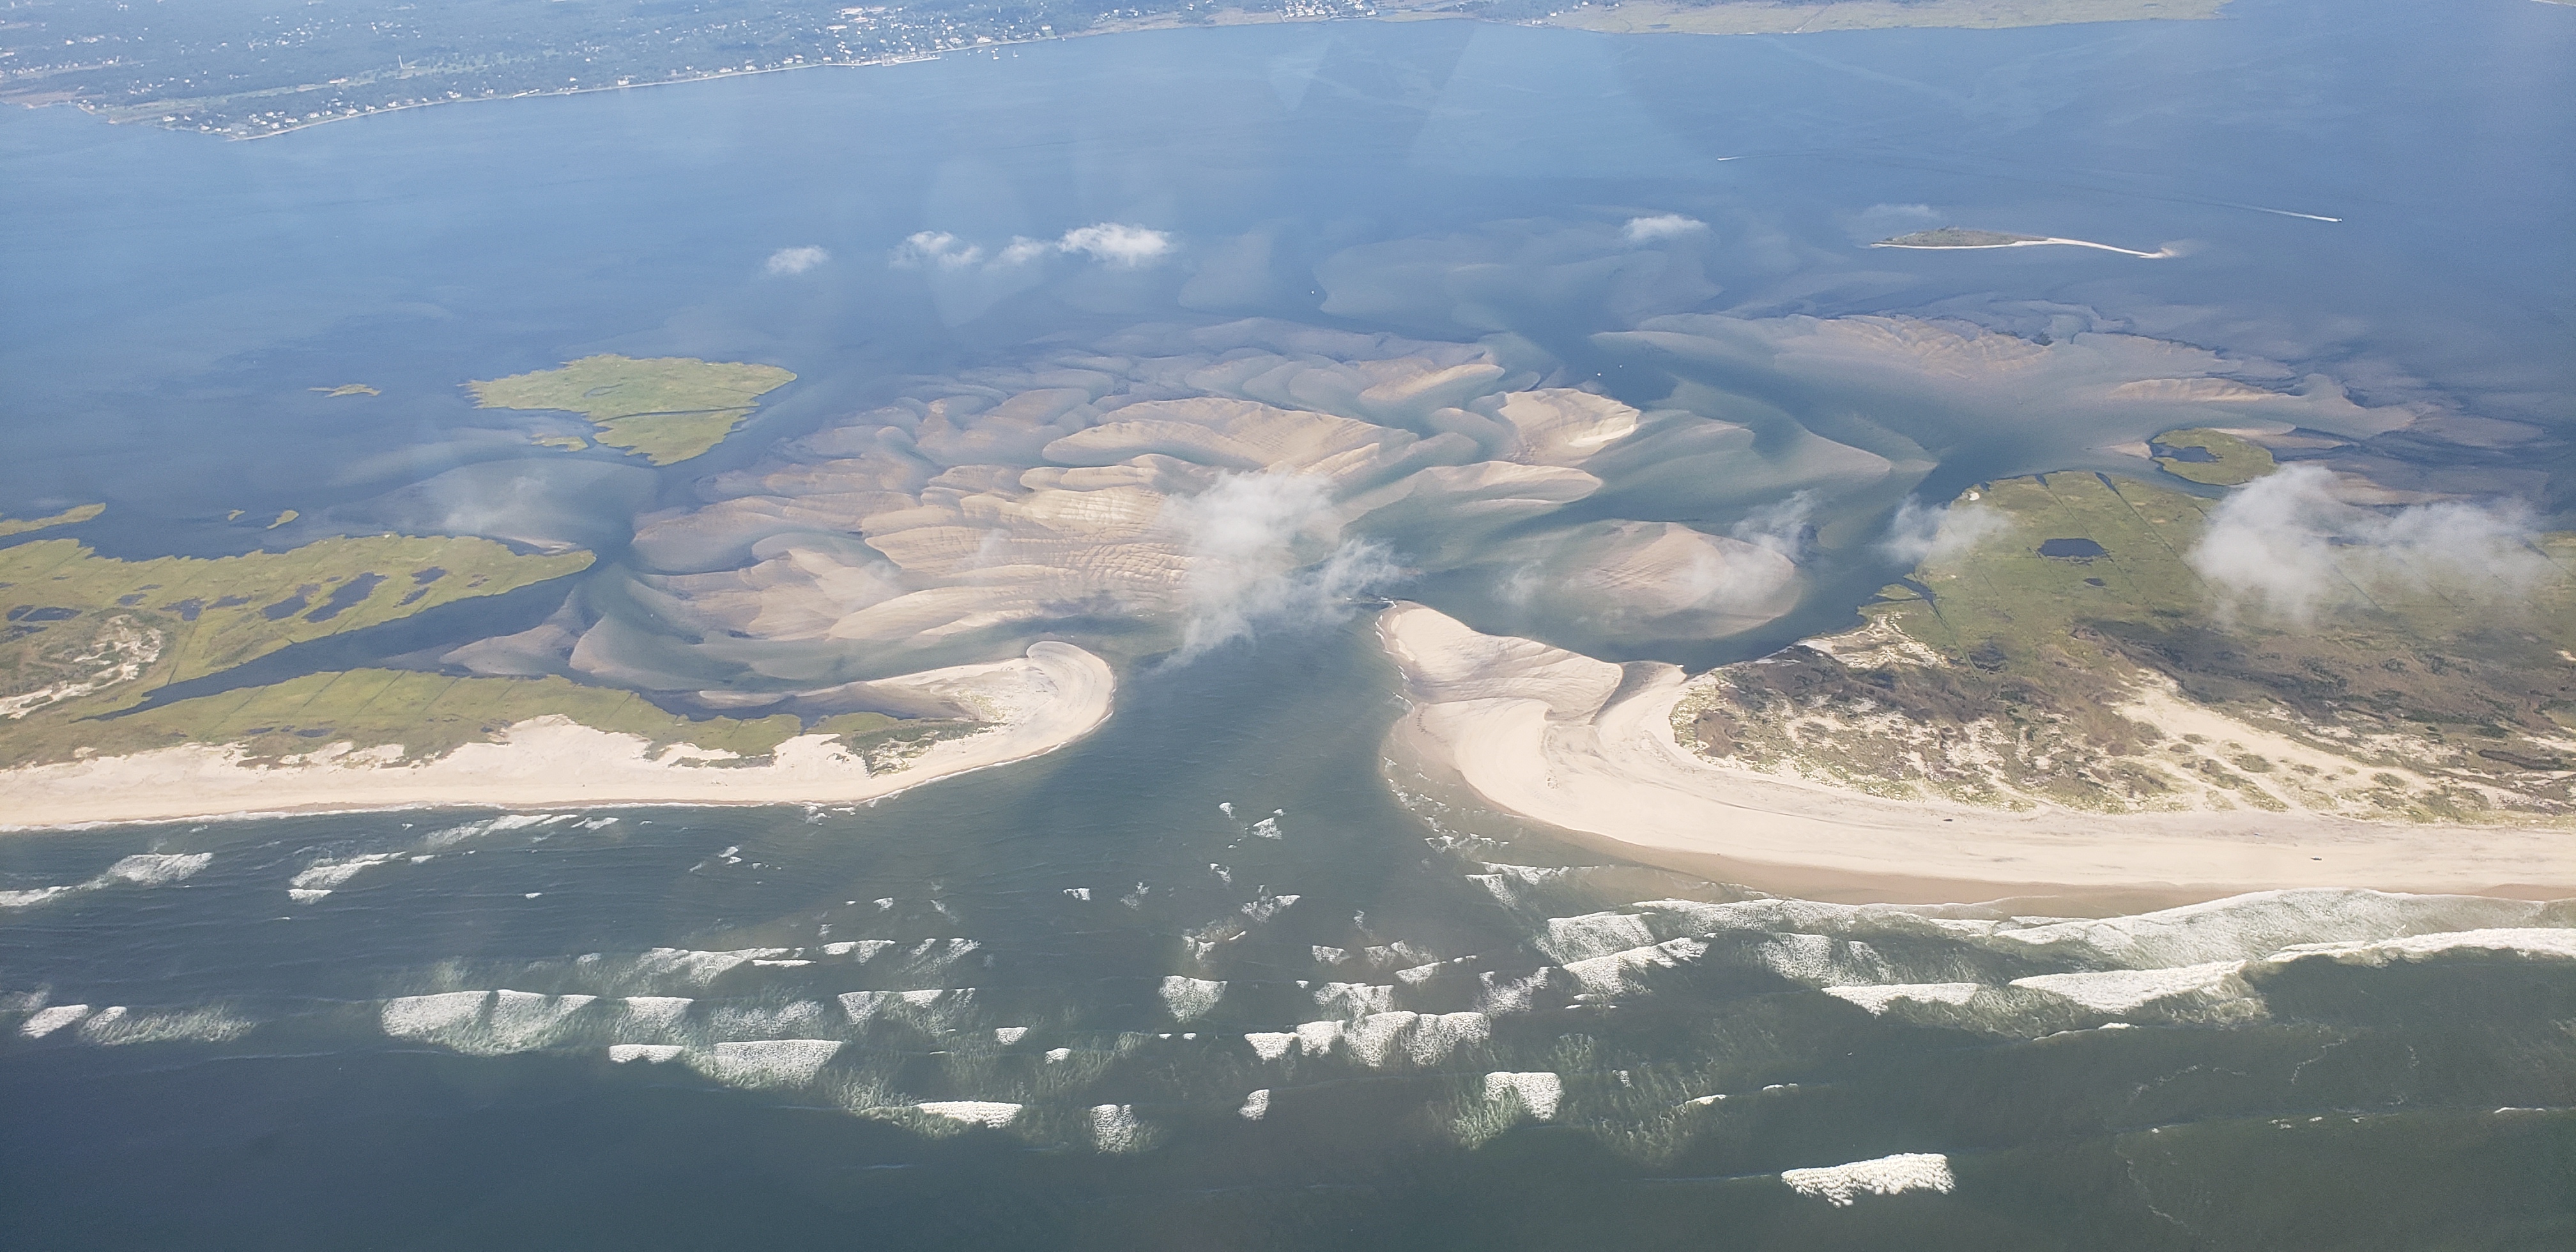 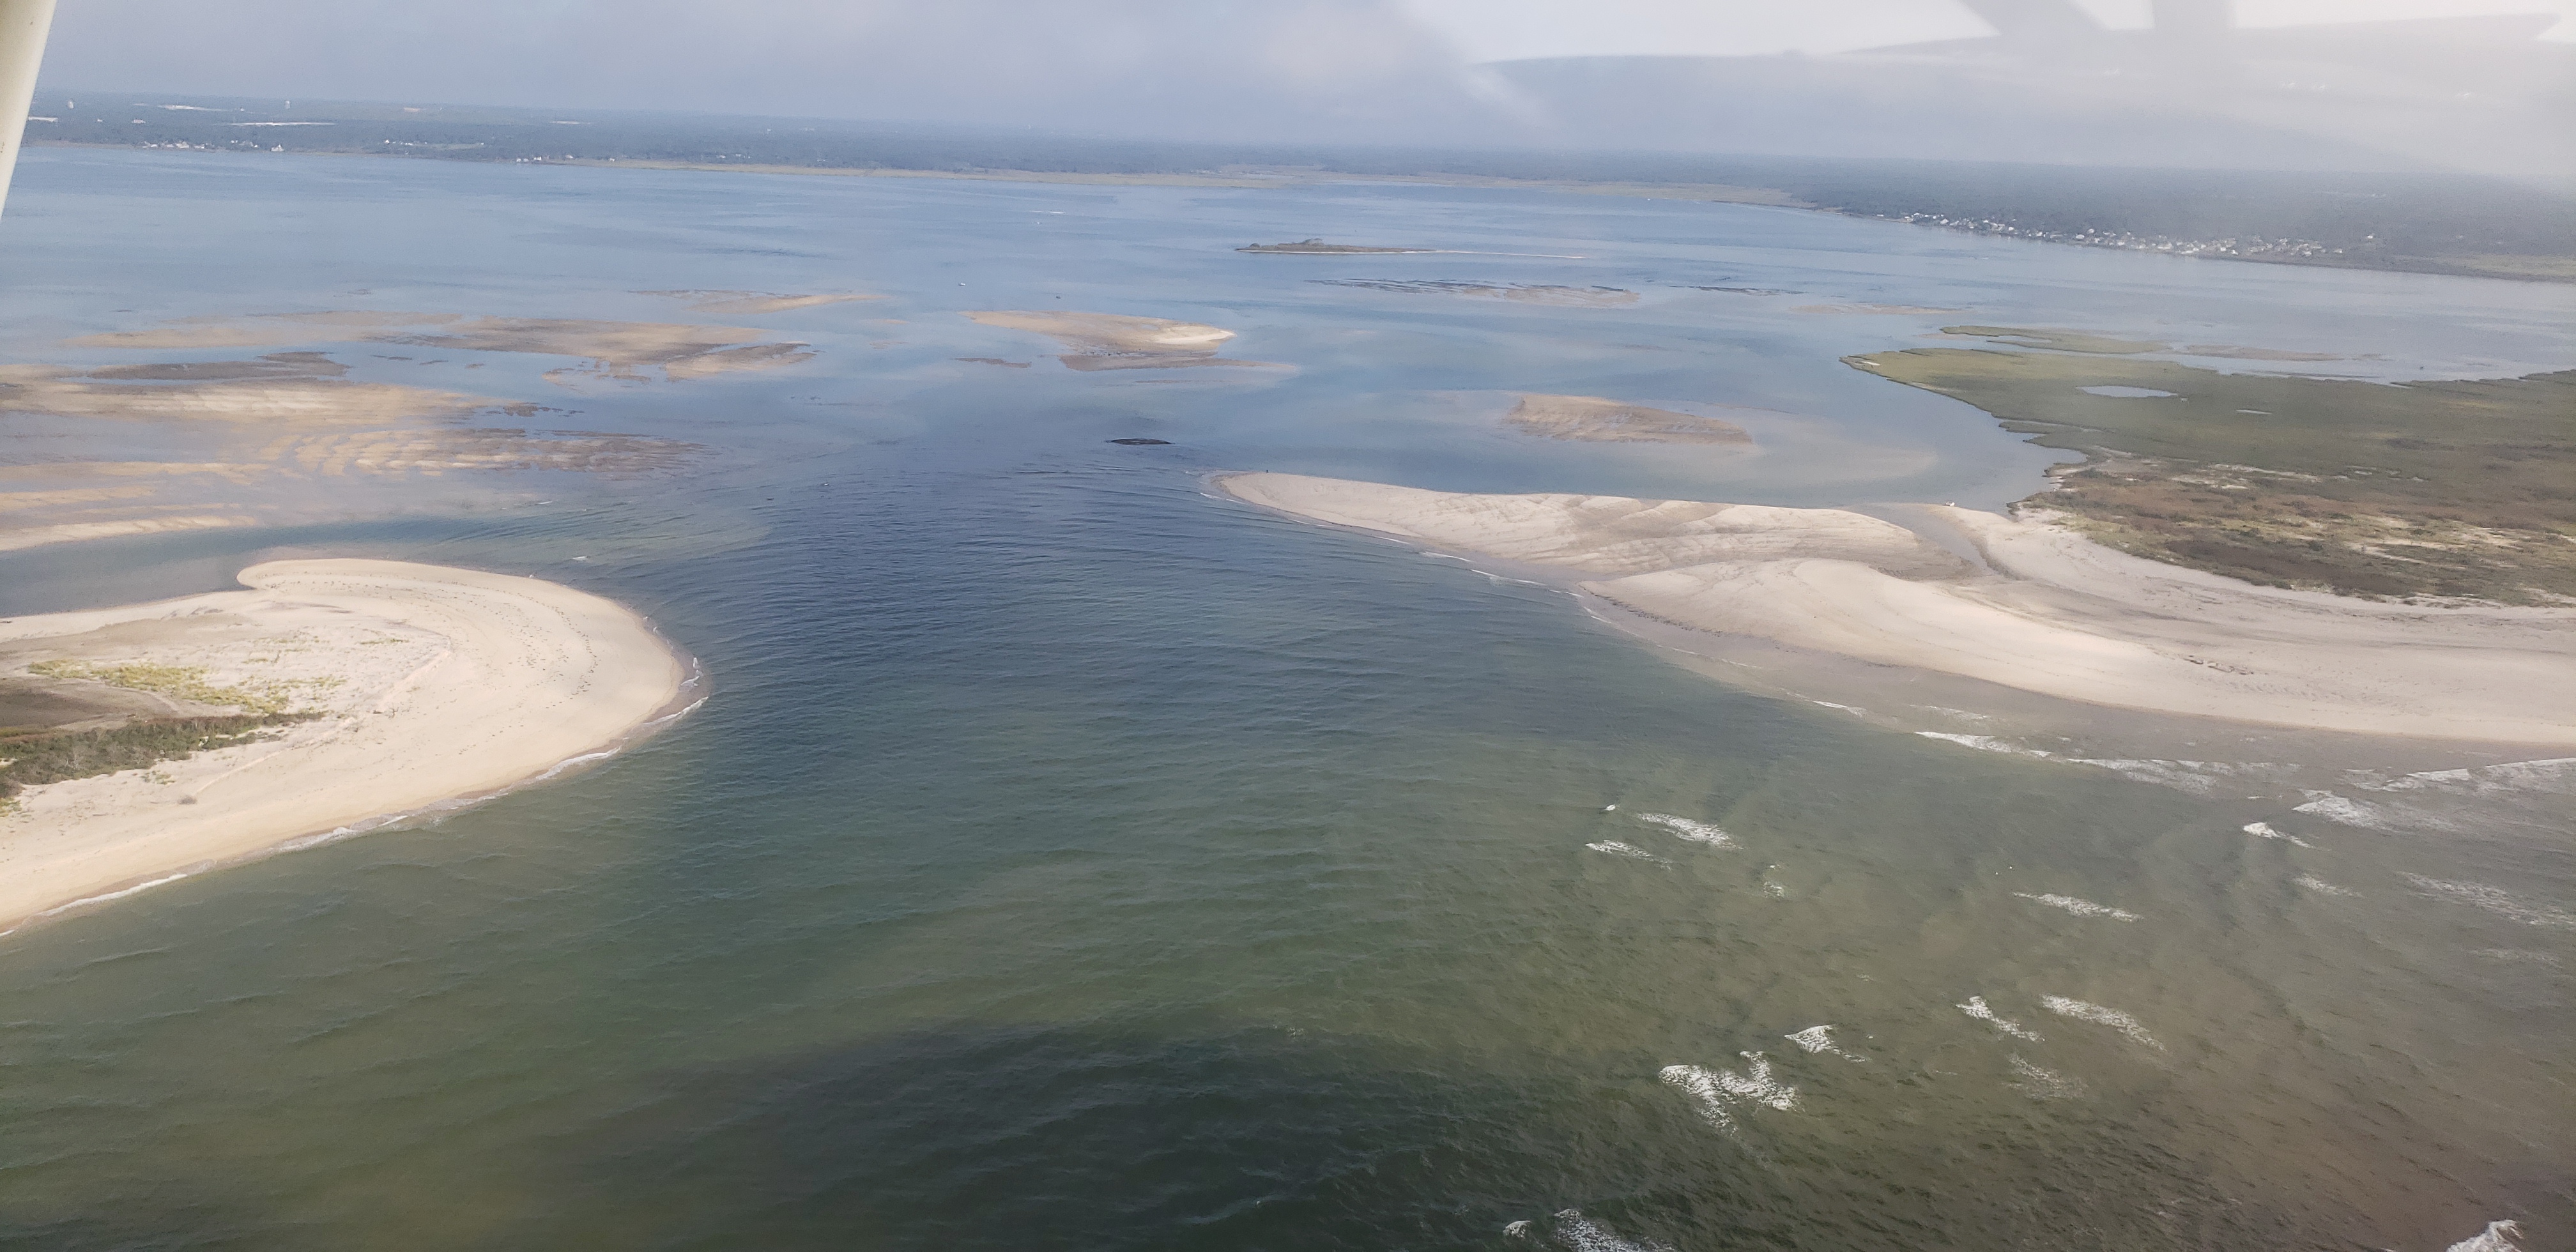 |
Oct 19, 2018 (CF)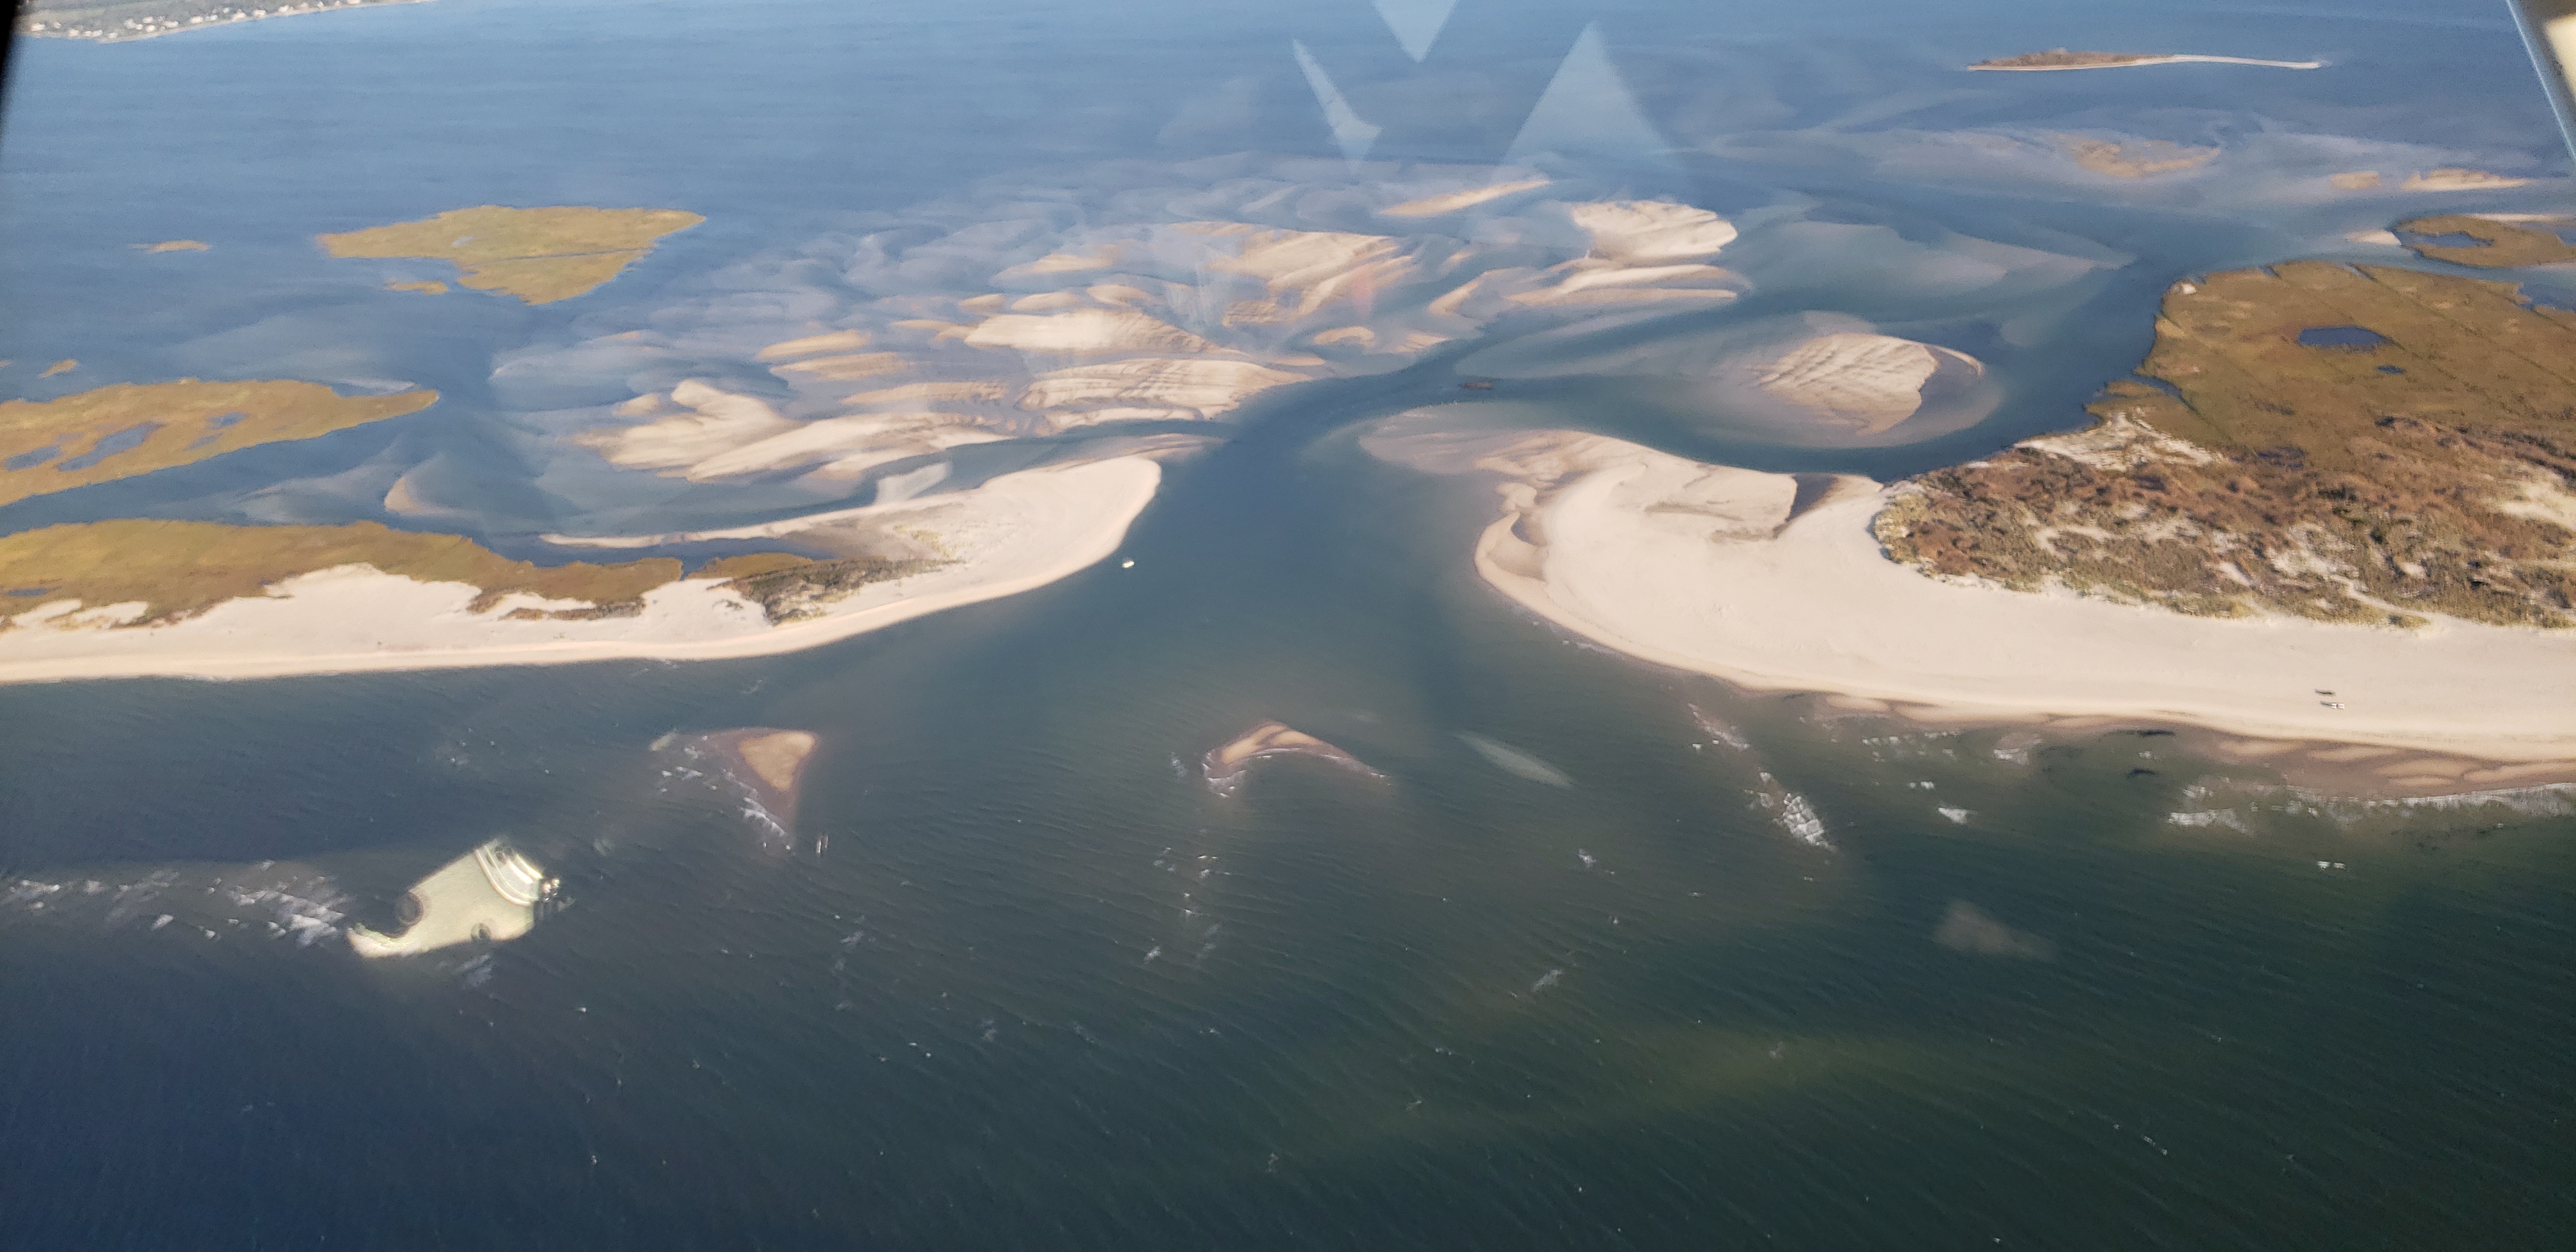 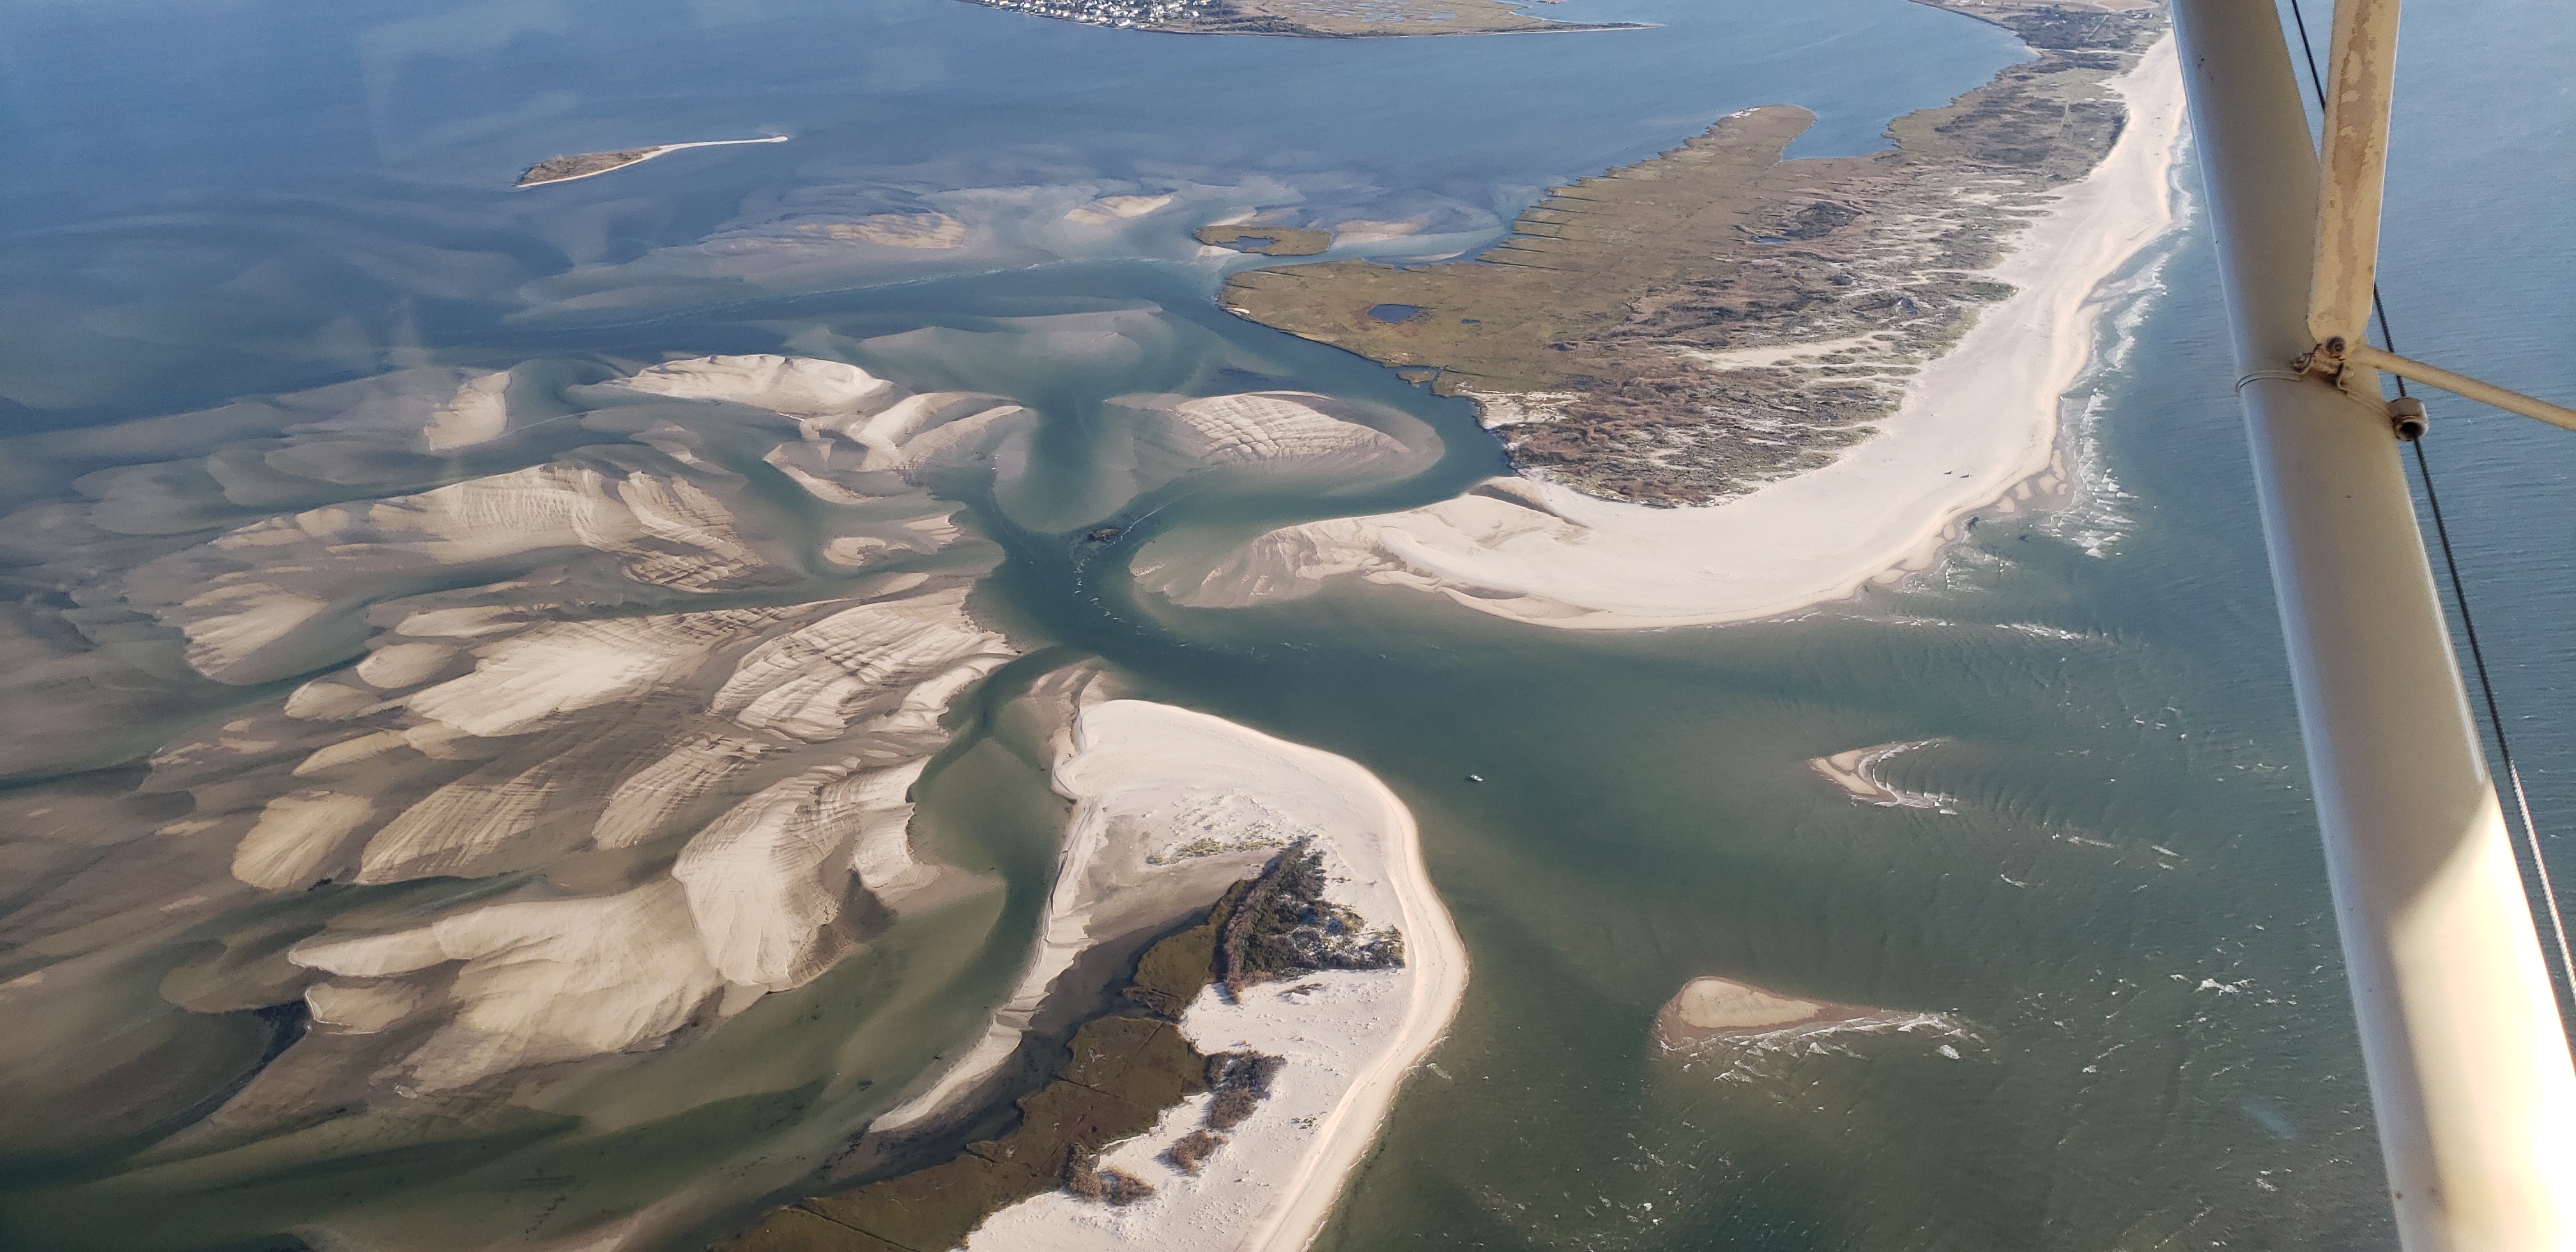 |
Nov 17, 2018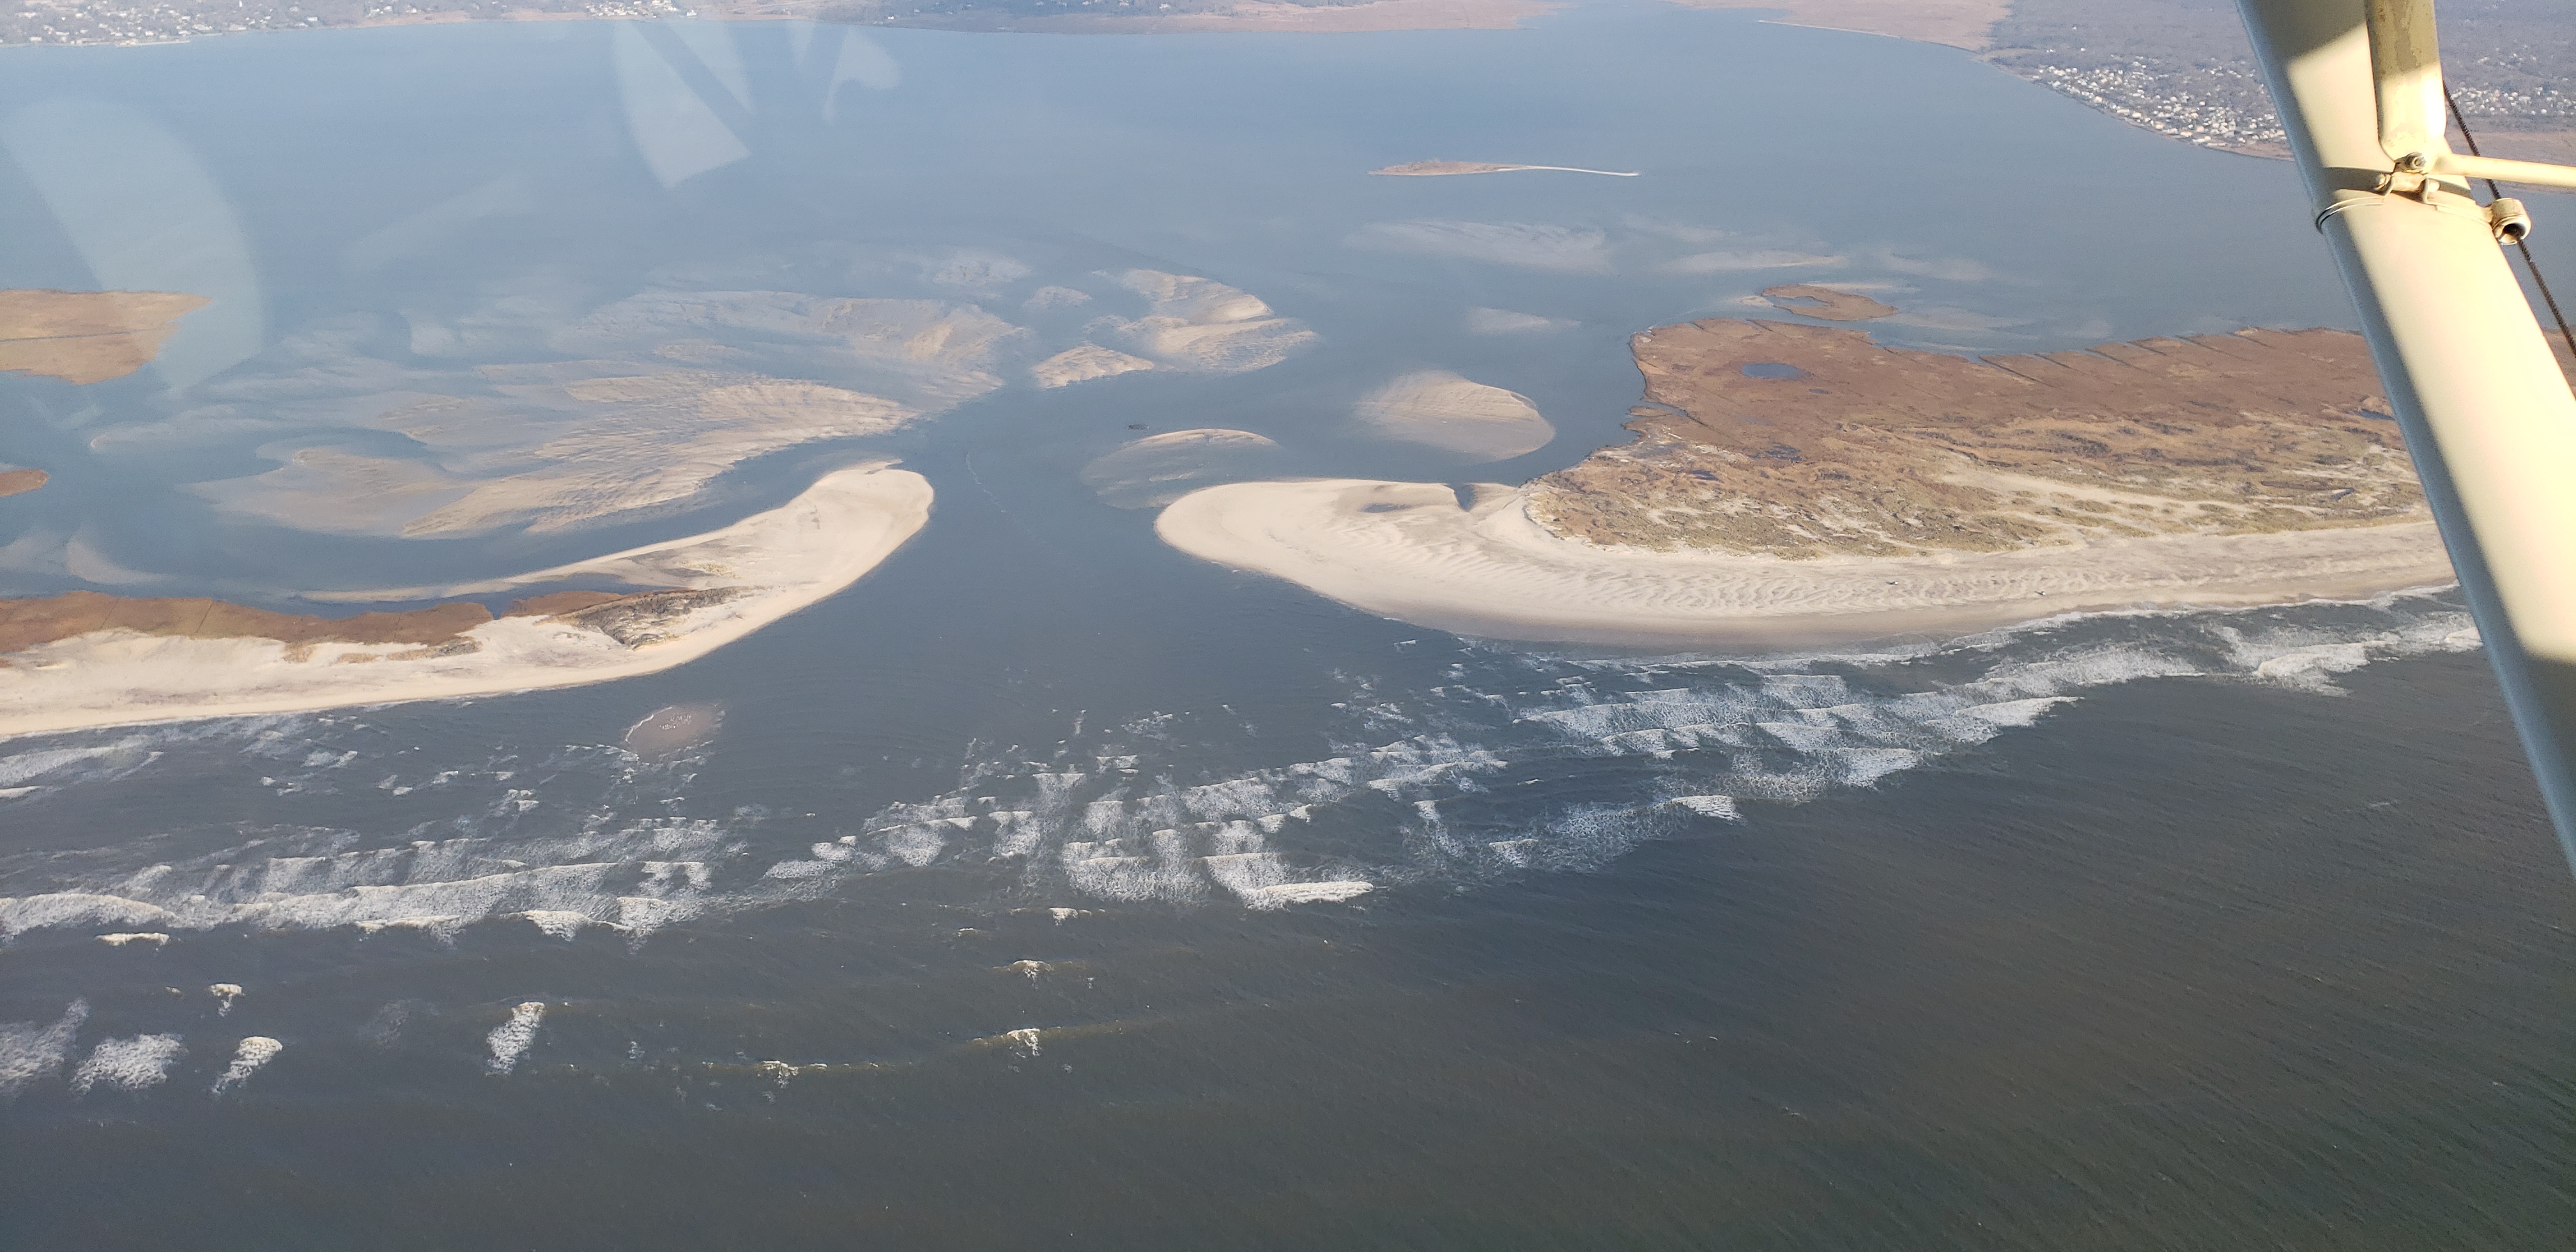 |
||||
Dec 19, 2018 (CF&YH)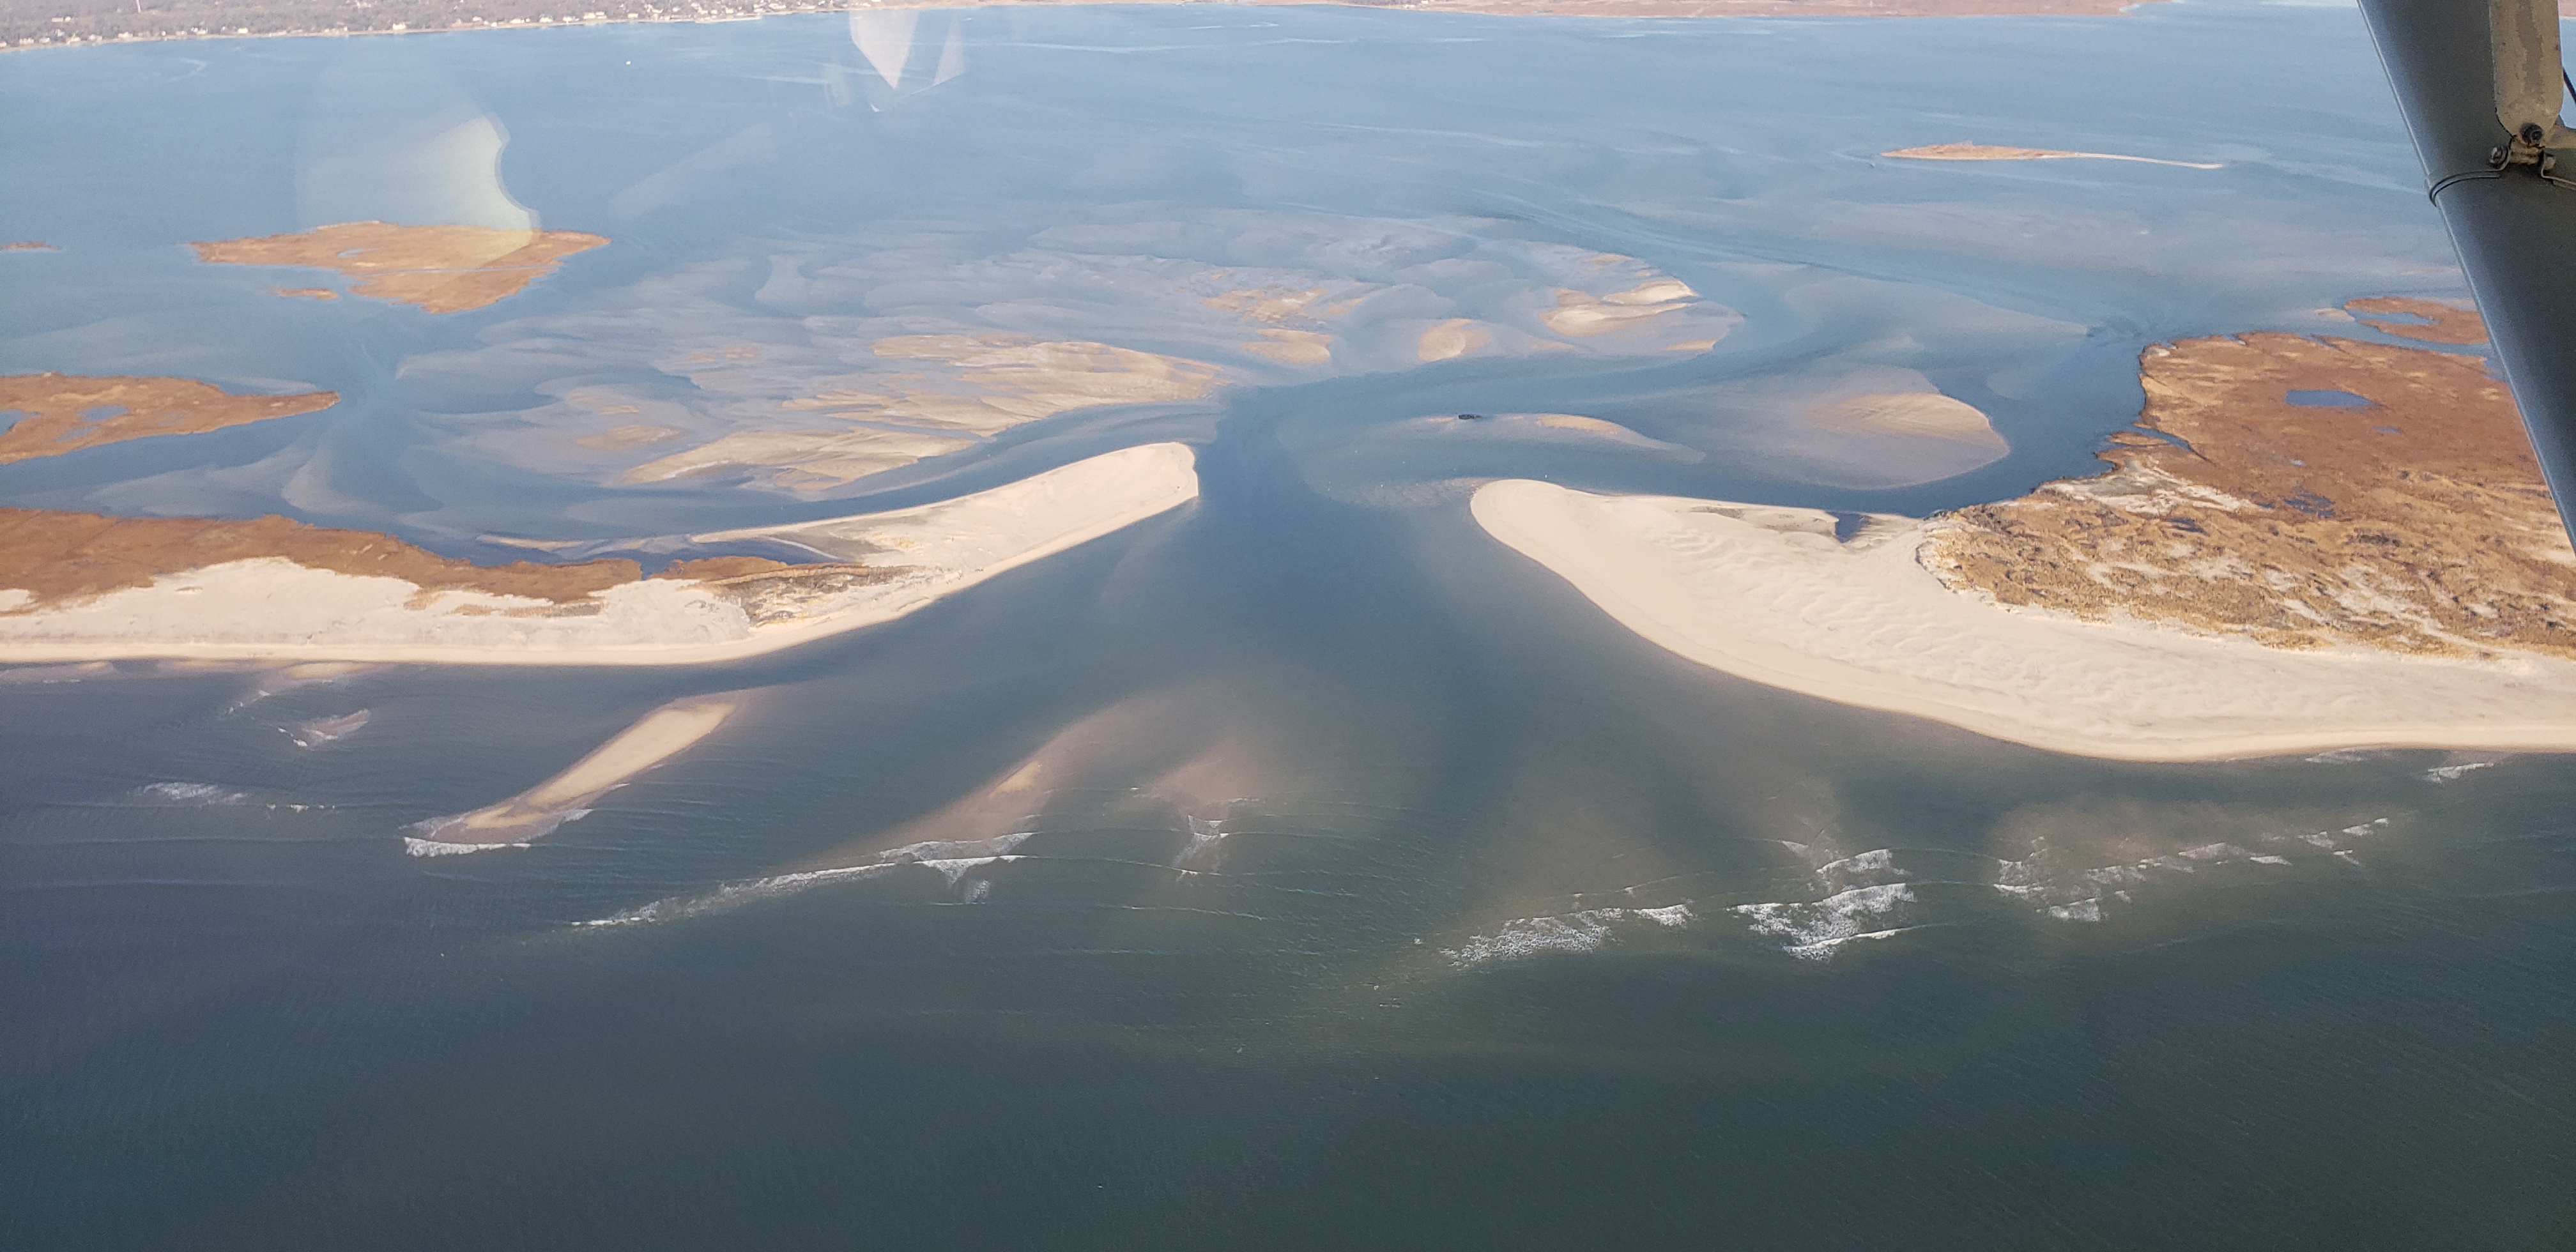 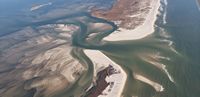 |
Jan 17, 2019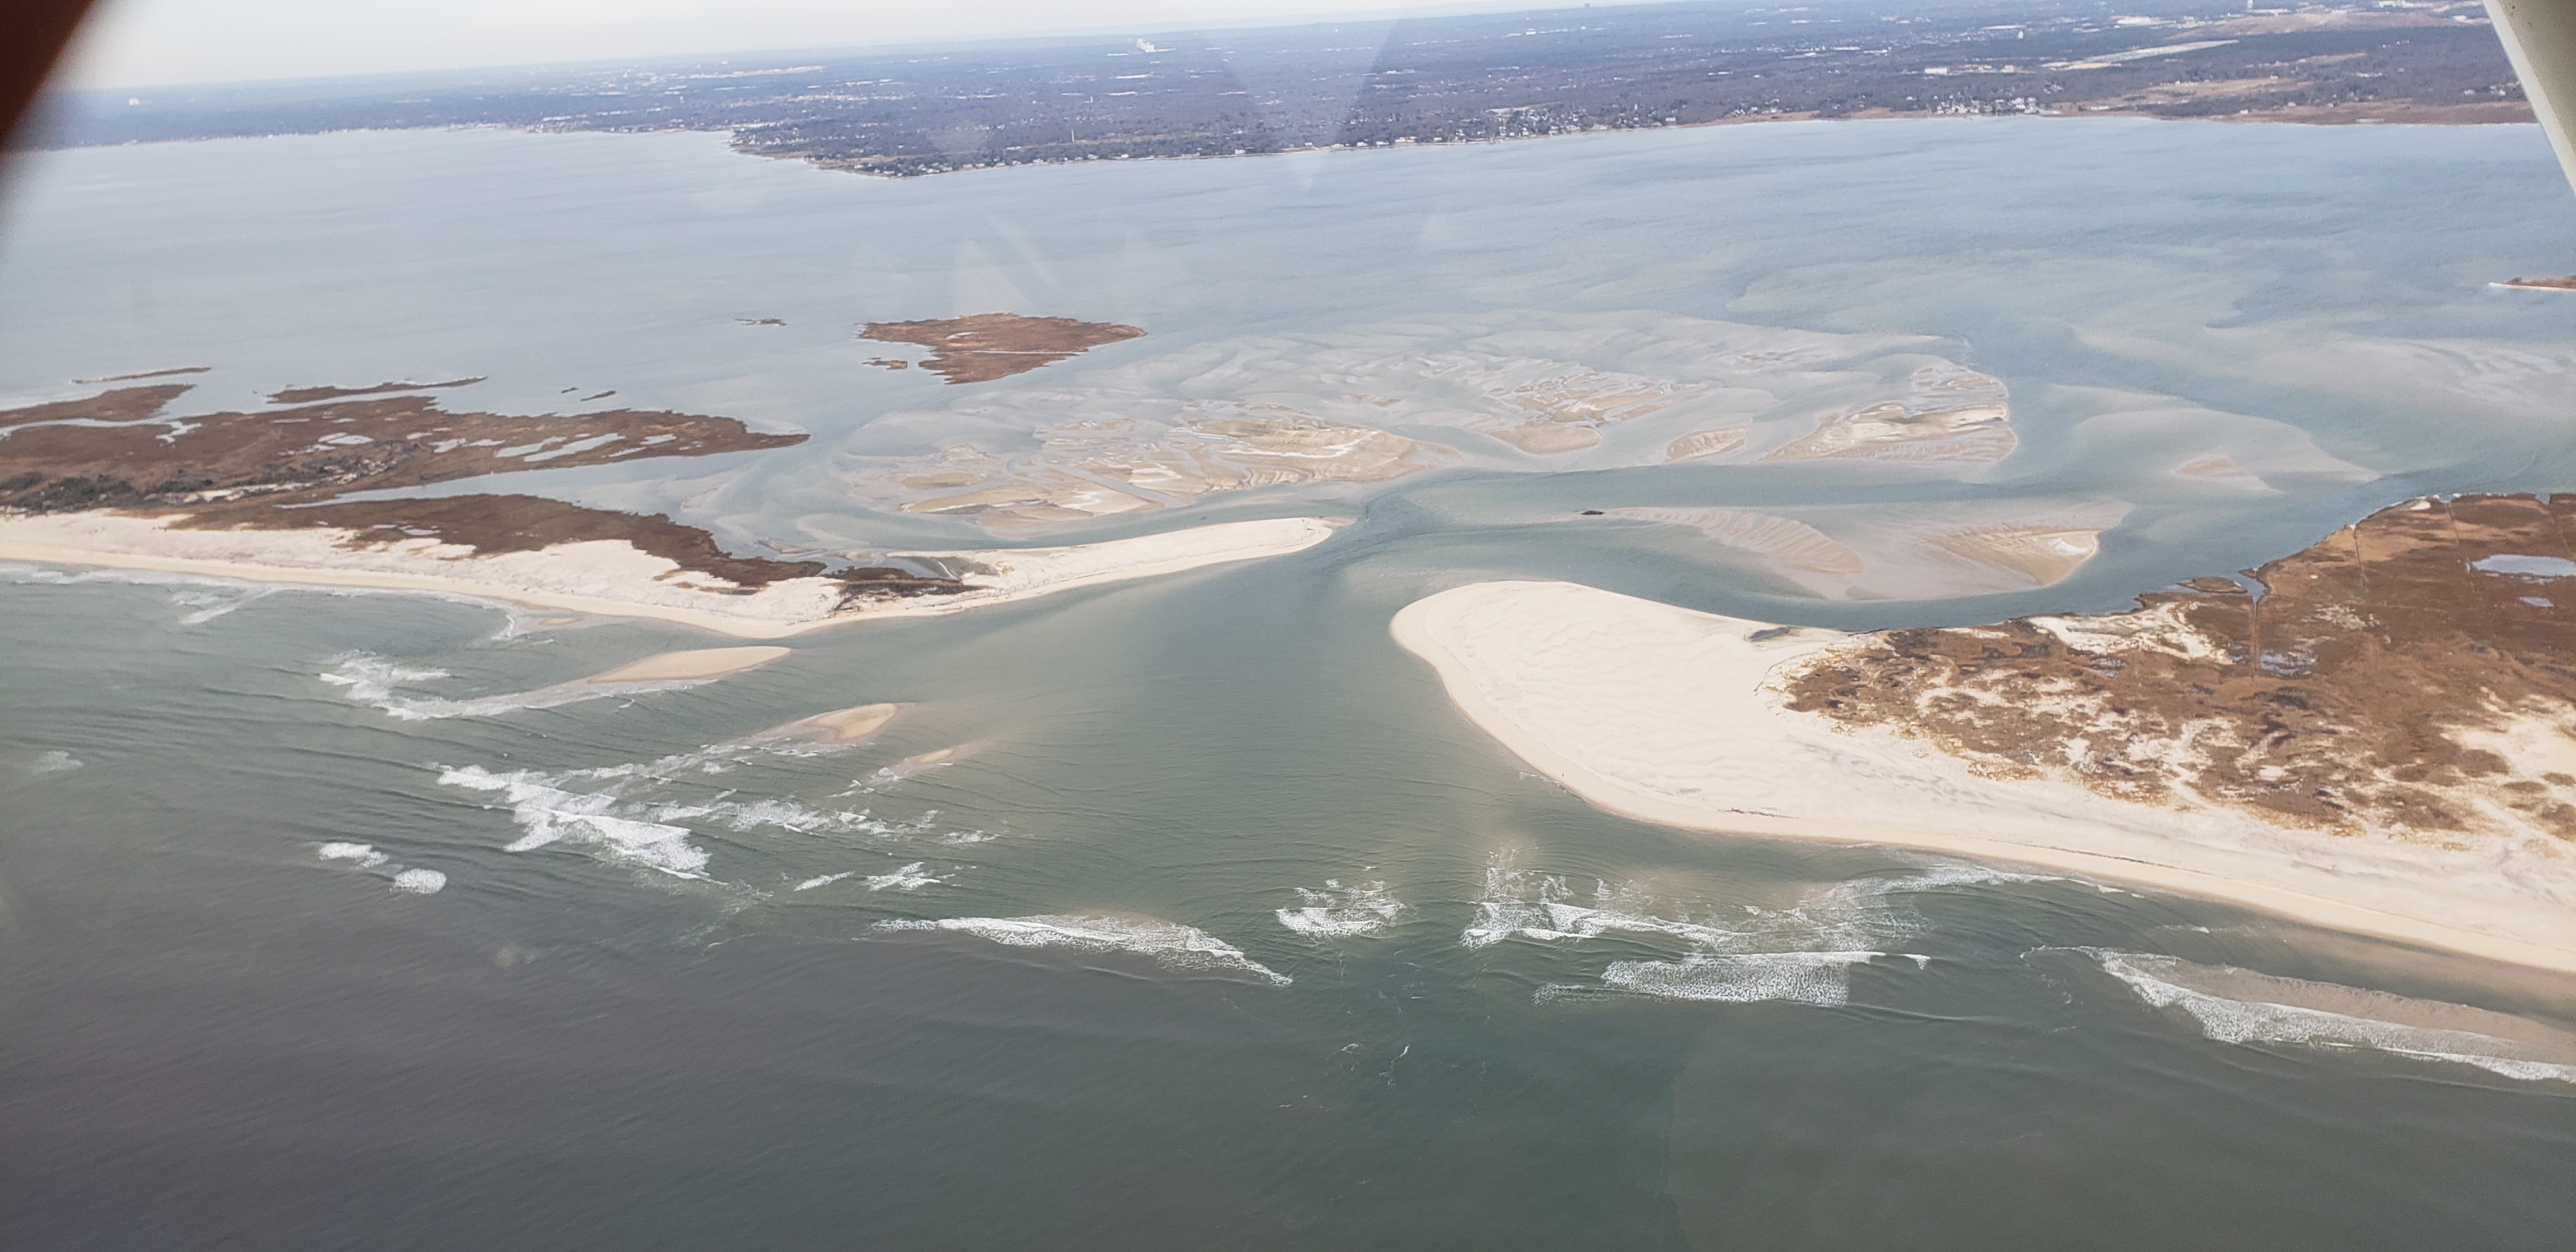  |
Feb 14, 2019 (CF&MB)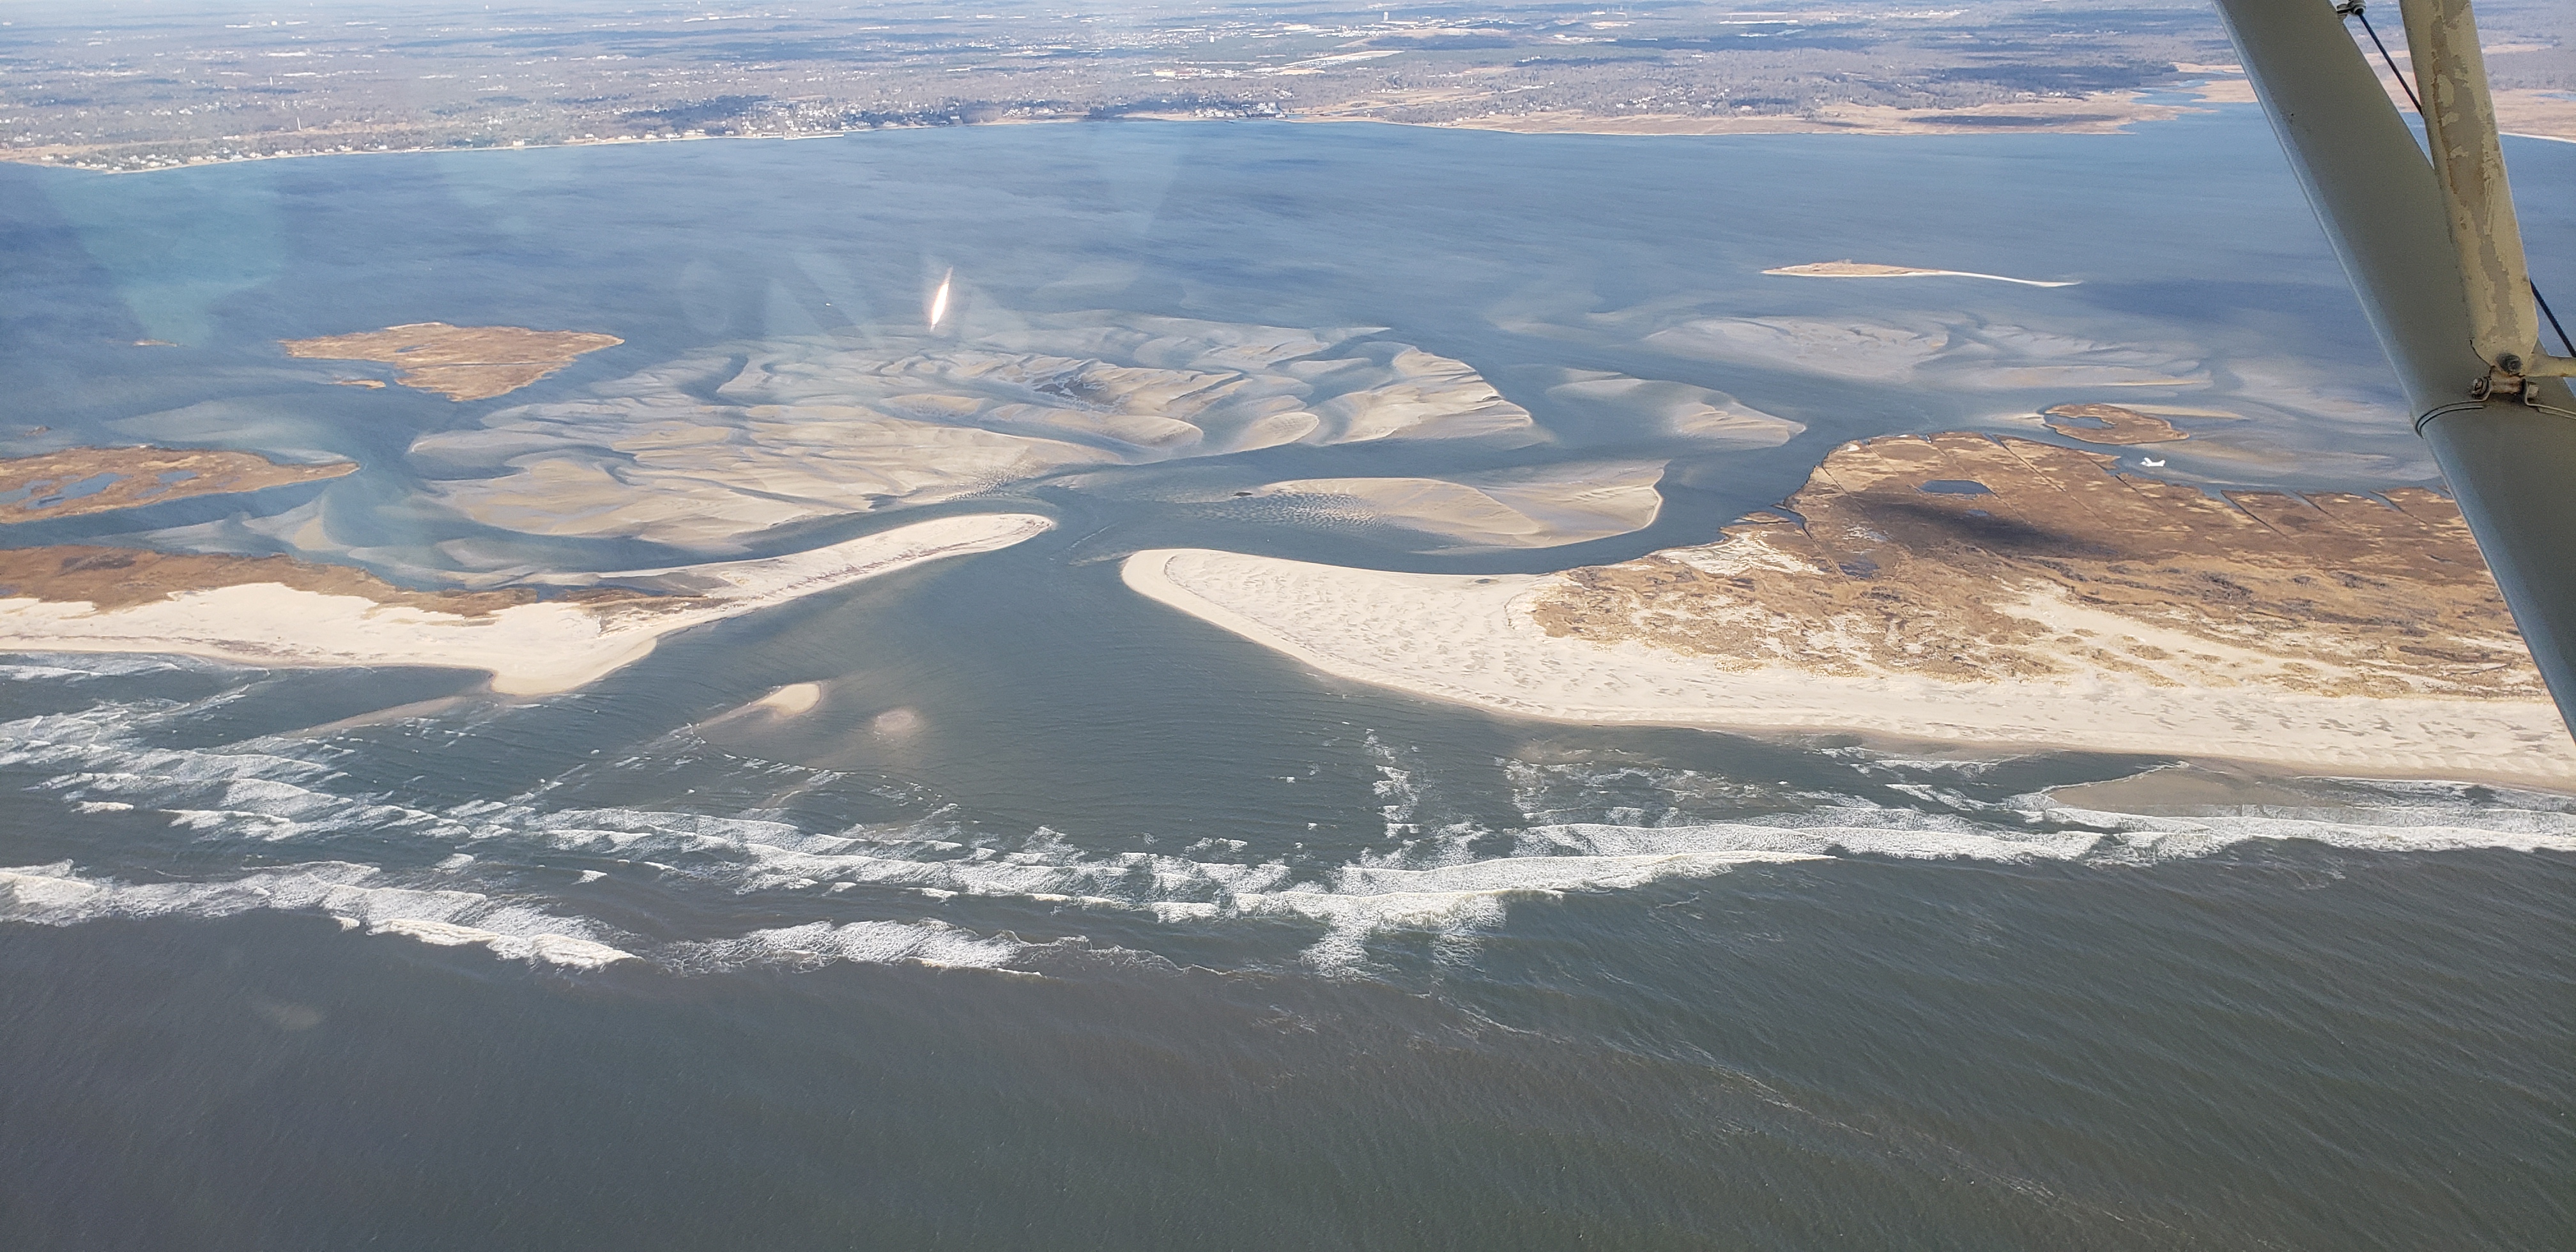 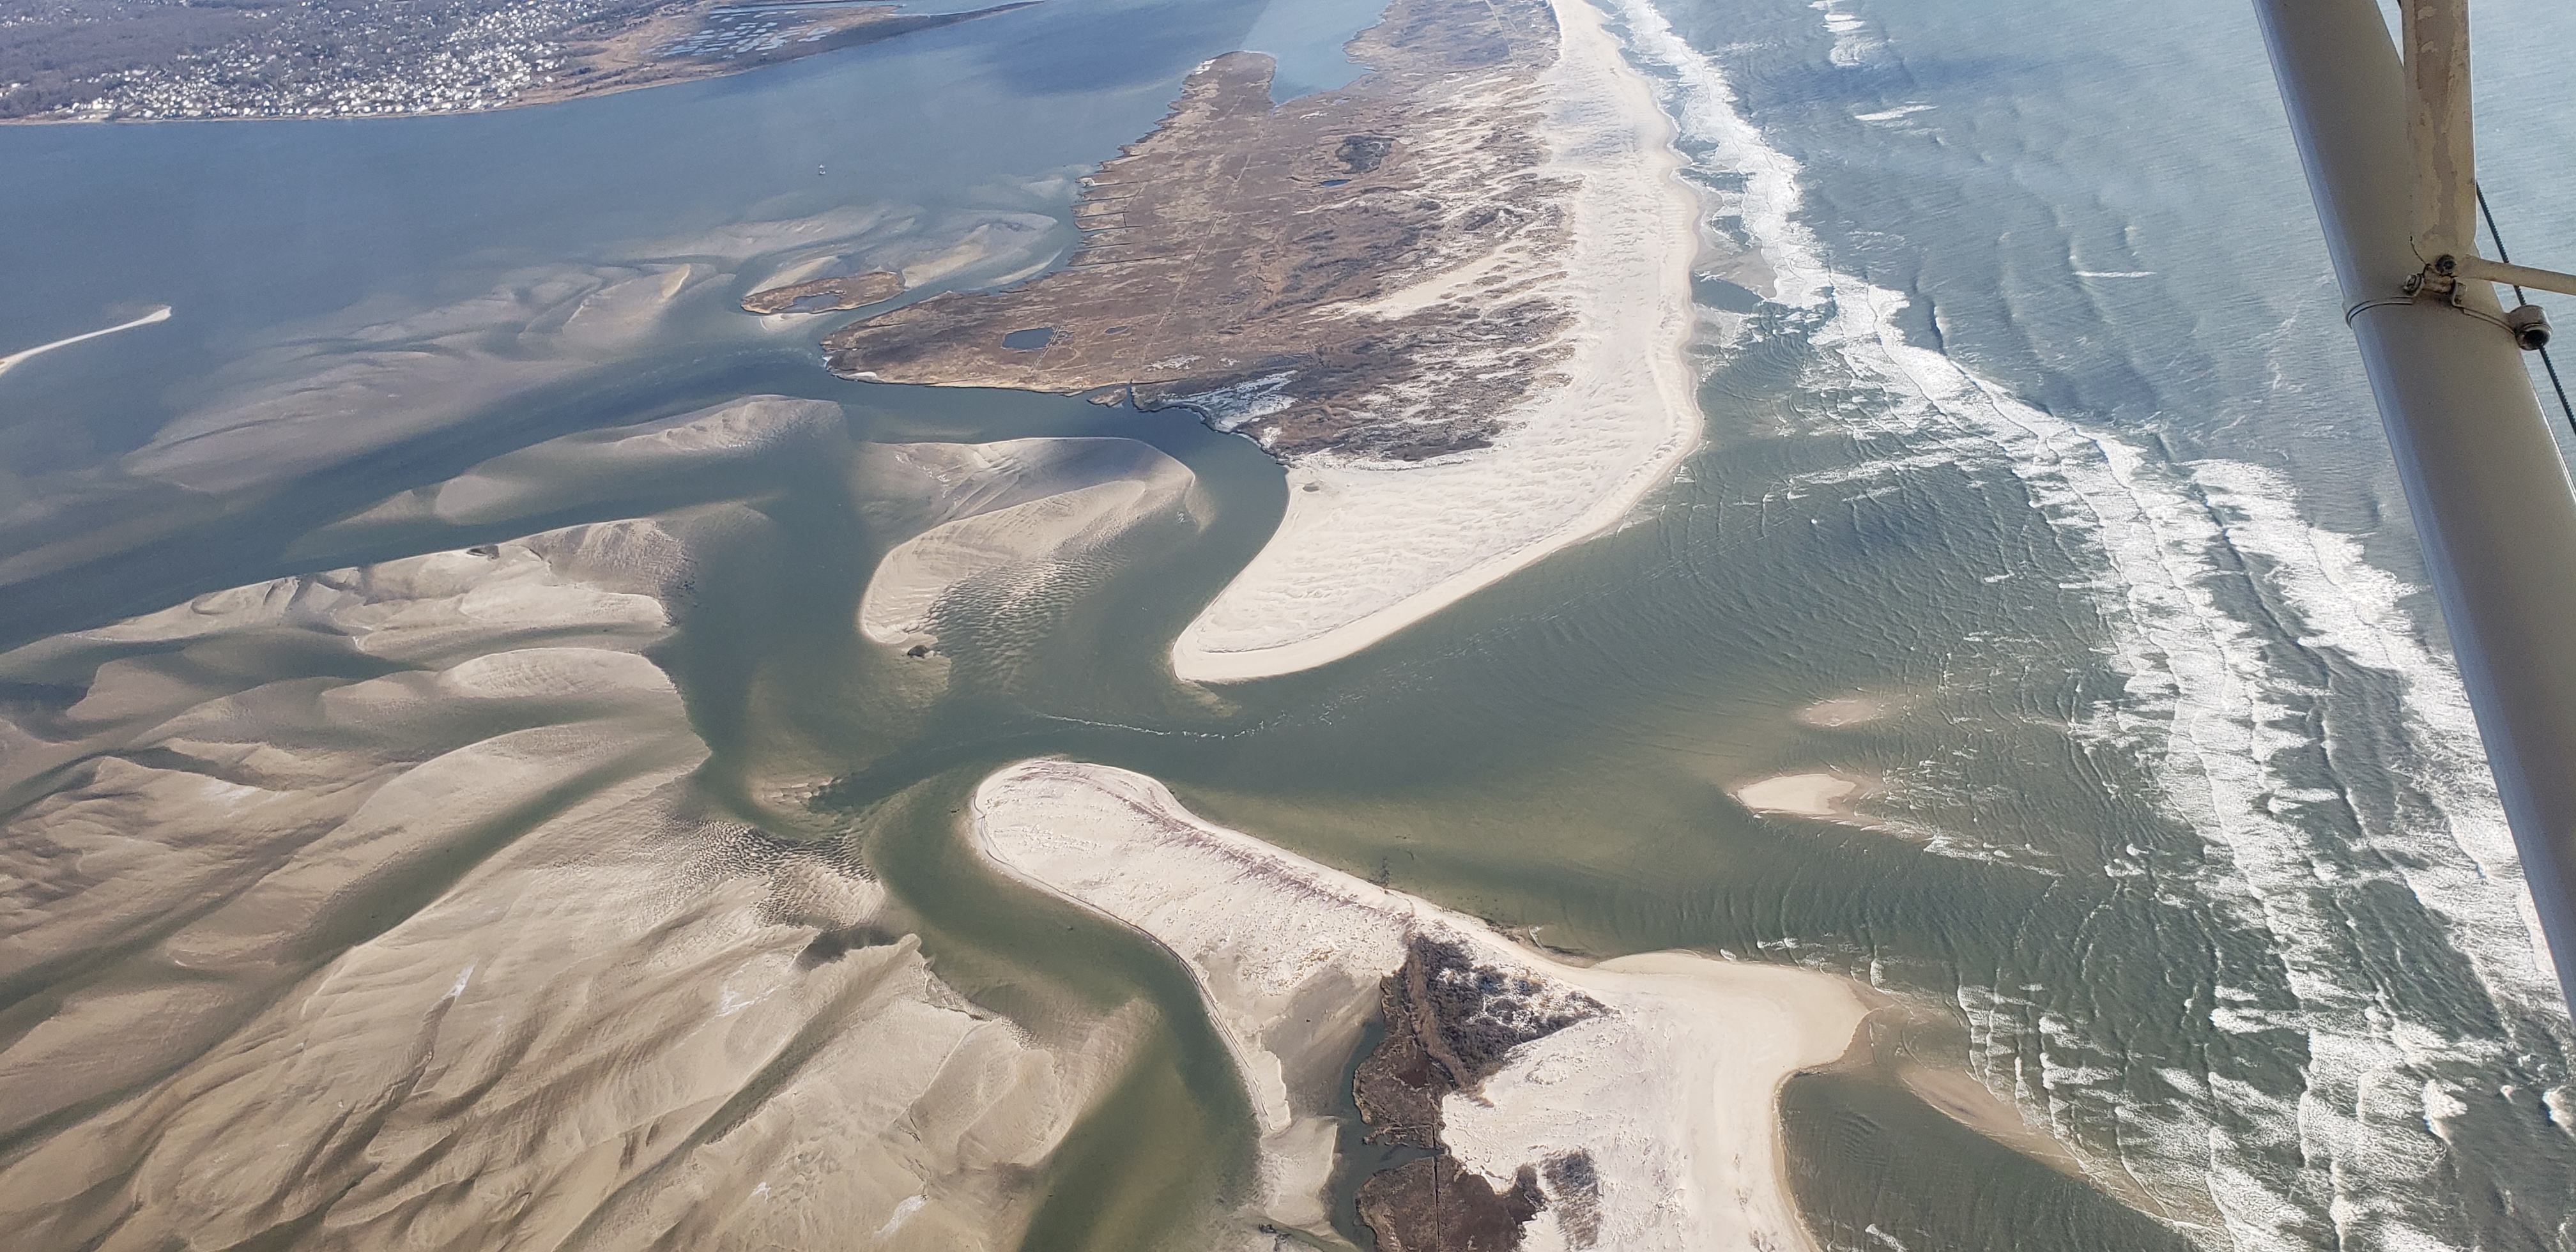 |
Feb 14, 2019 (MB) |
||||
| Mar 24, 2019 (CF&SB) High Tide 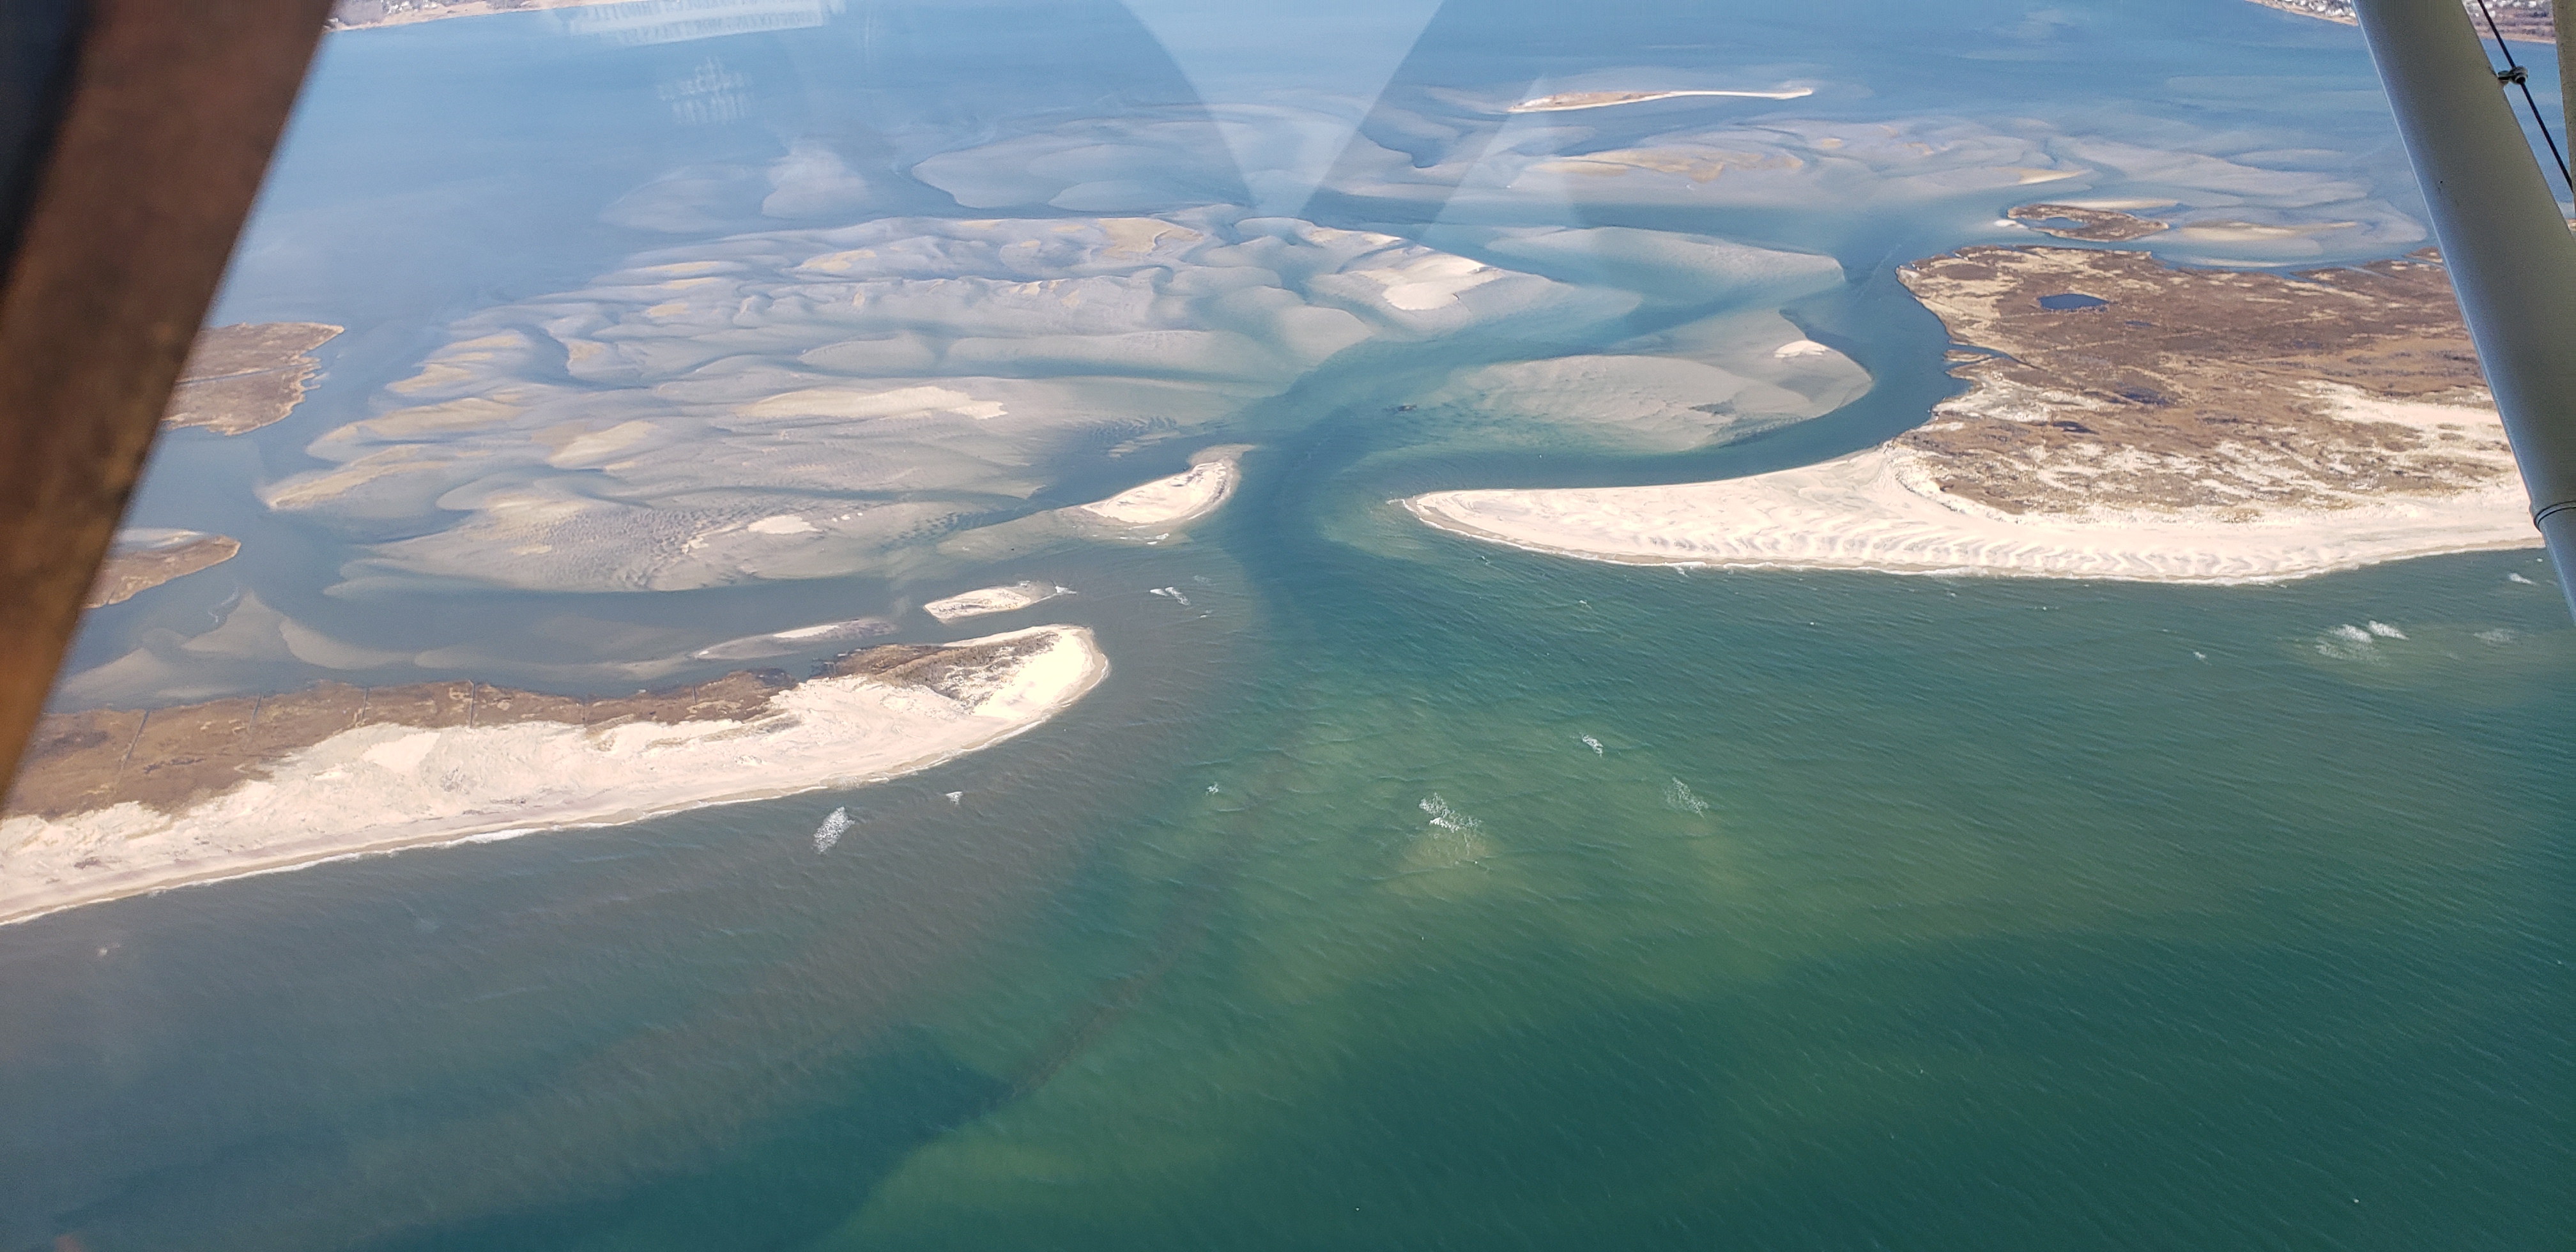 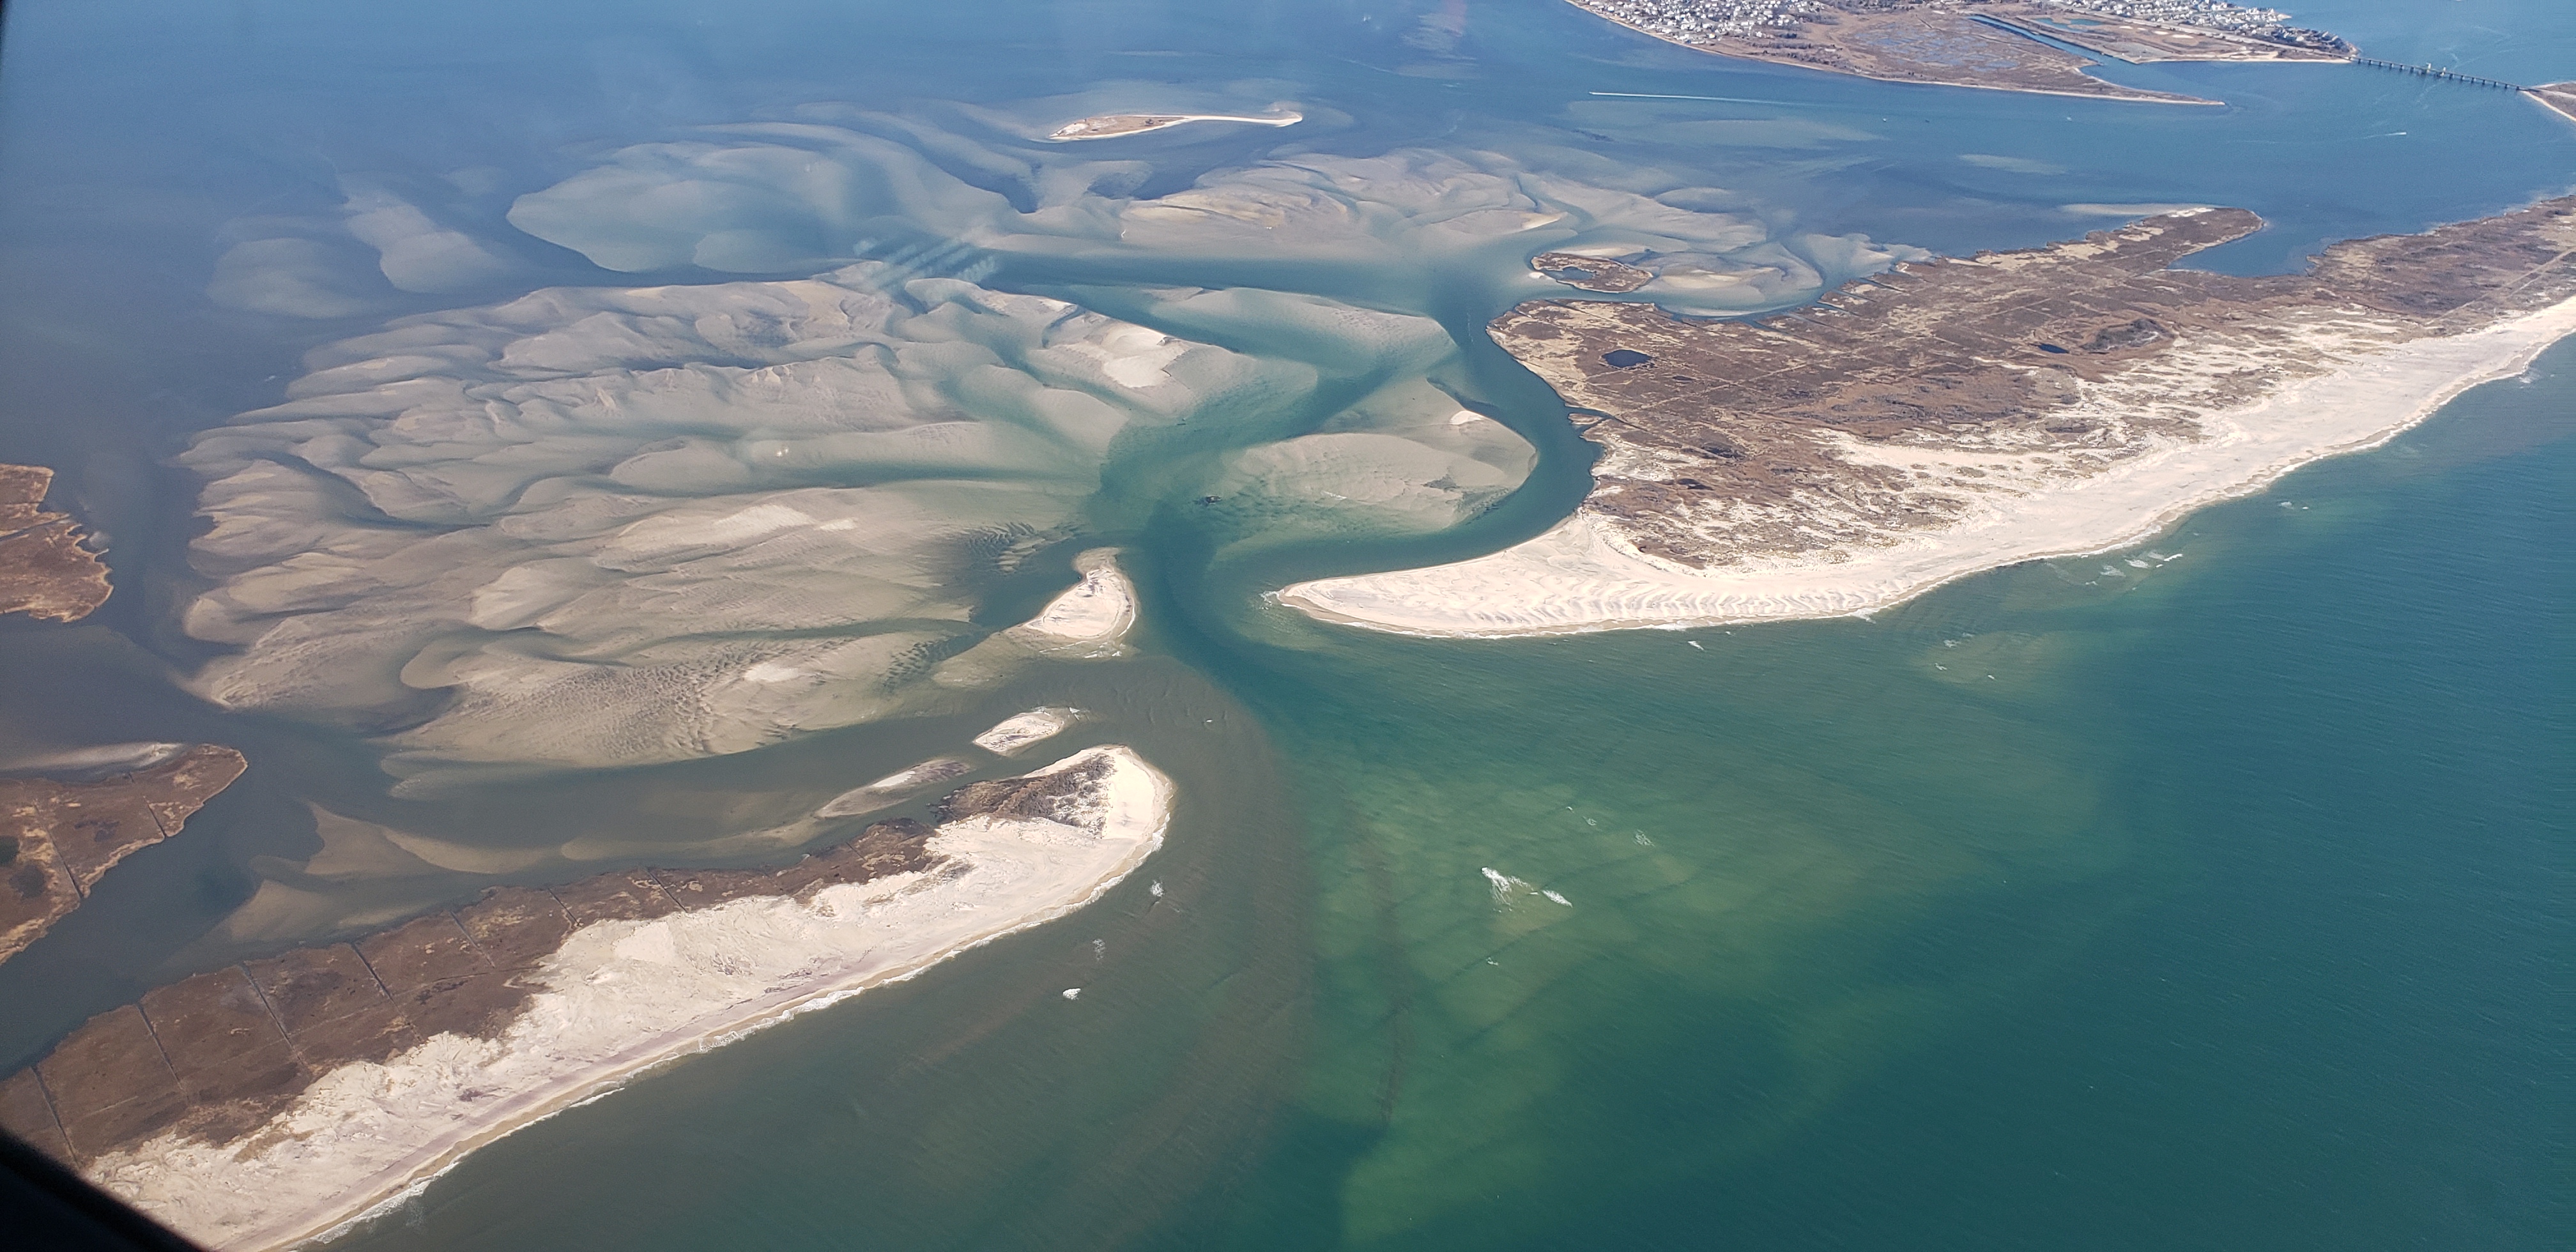 |
Apr 25, 2019 (RG)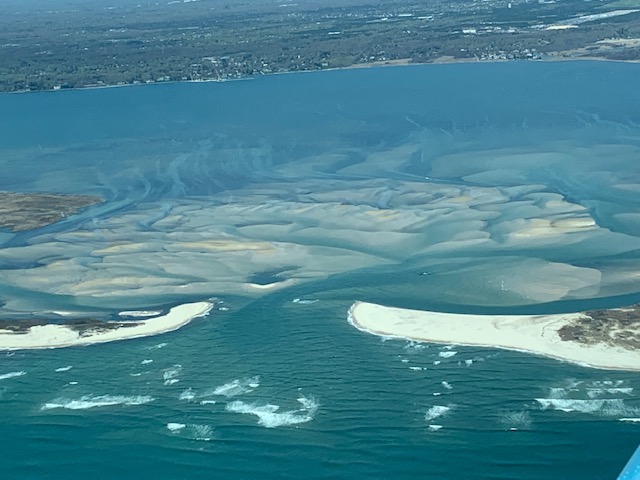 |
Apr 29, 2019 (CF) 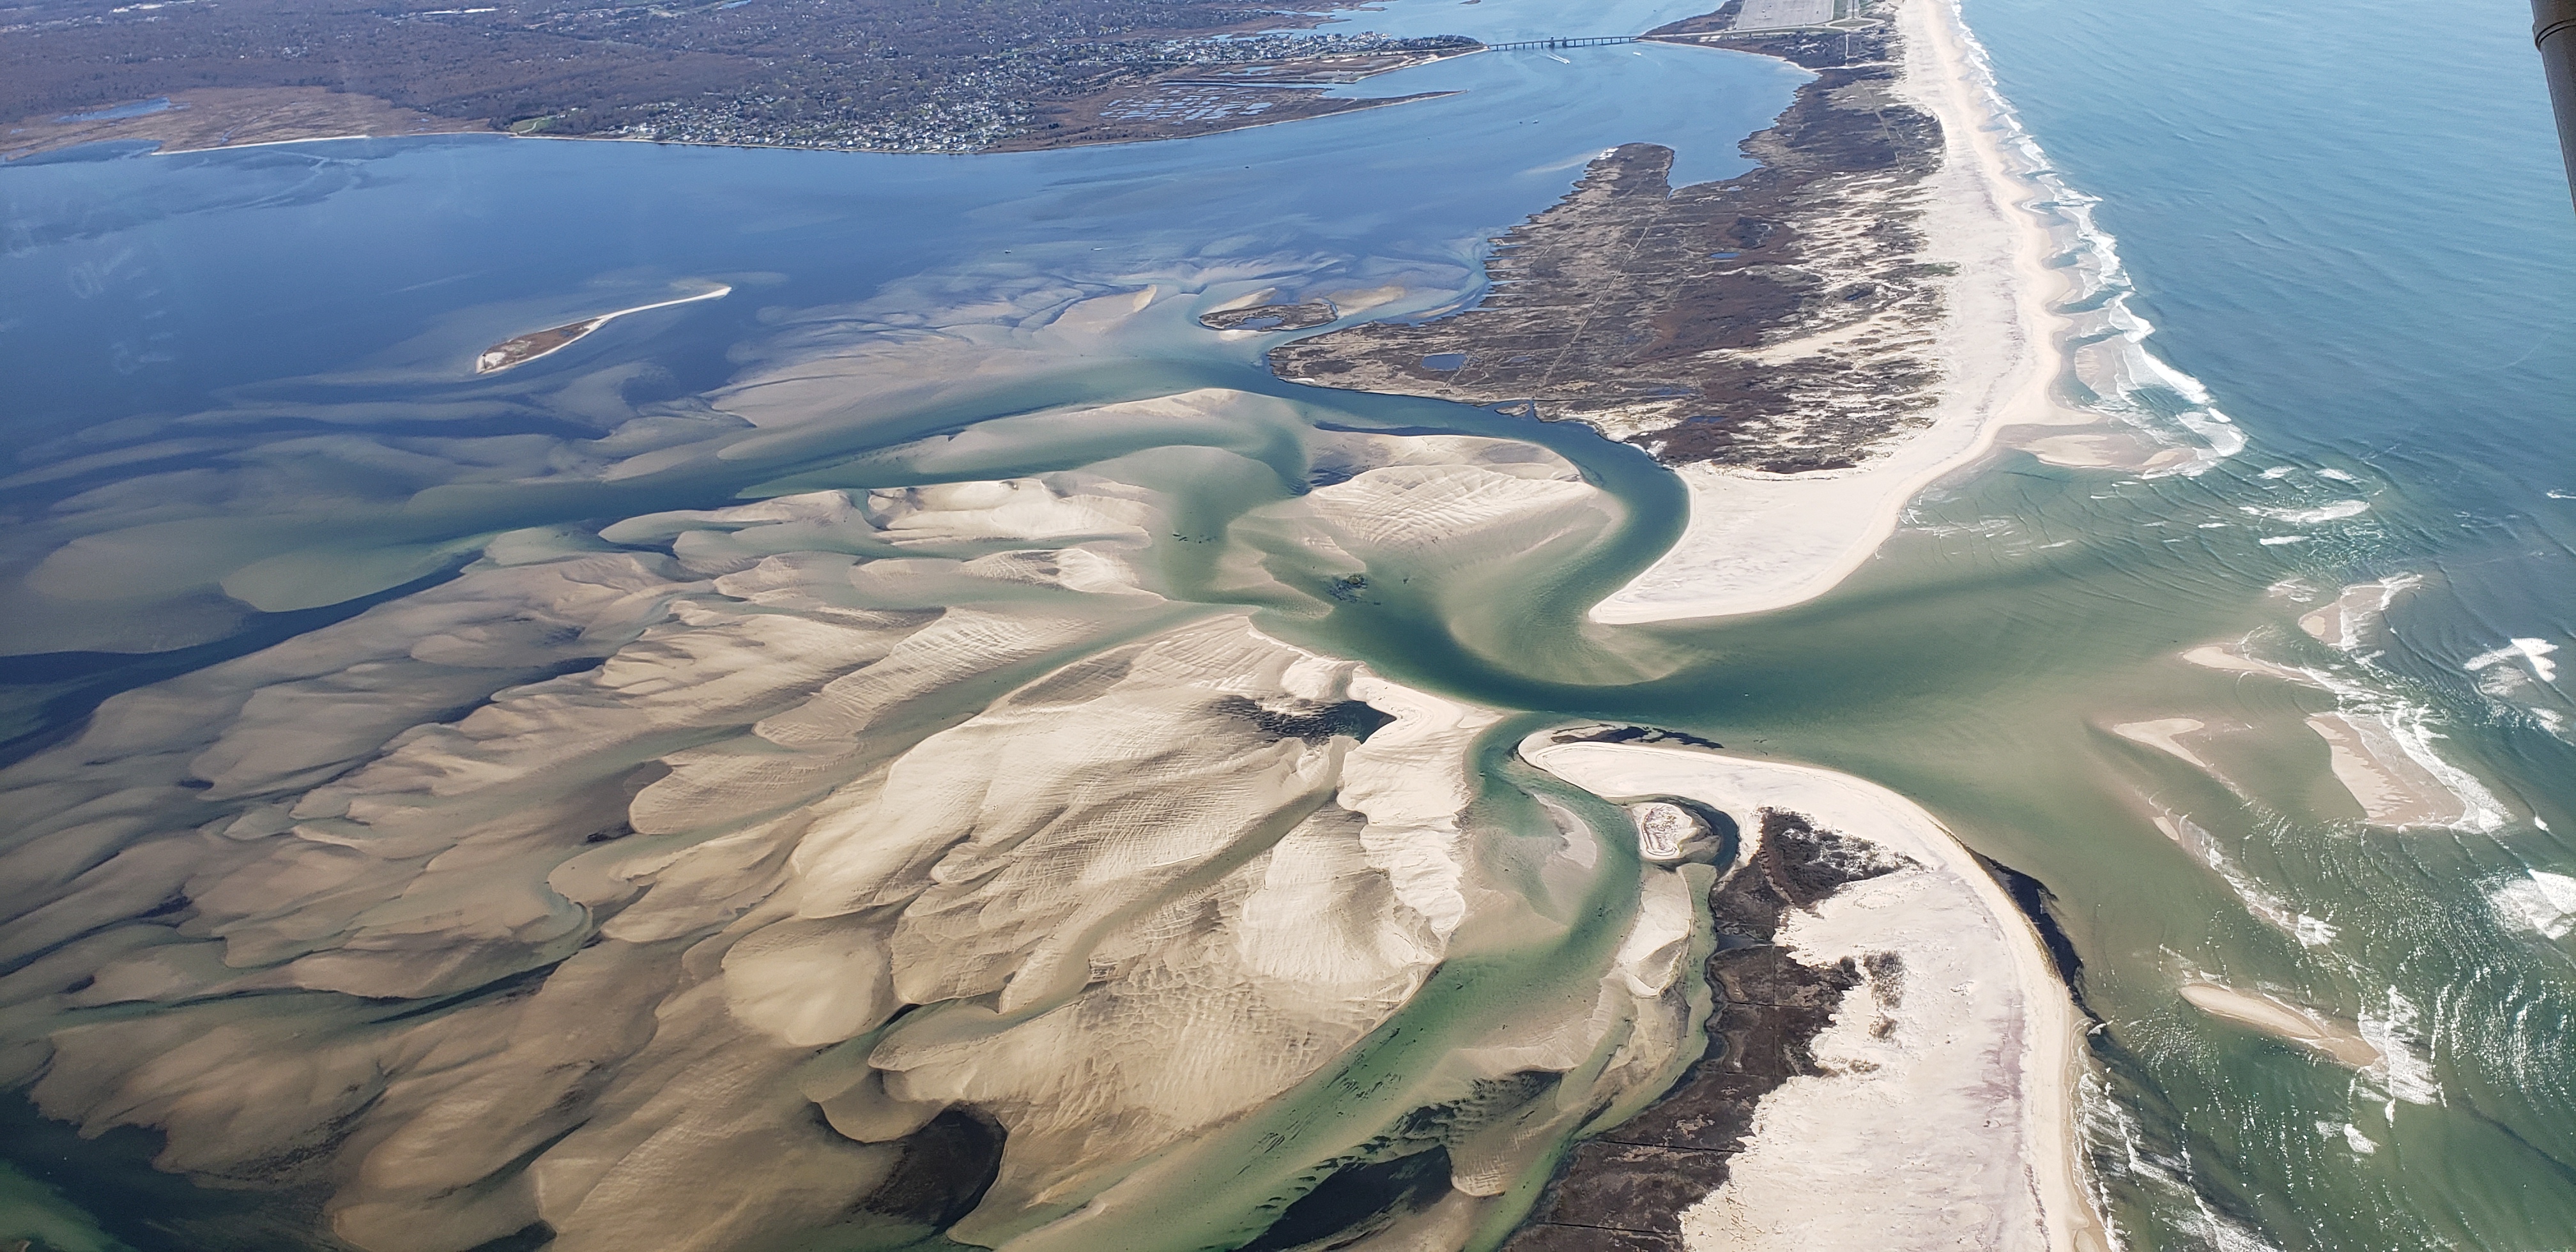 |
Apr 29, 2019 (CF) |
||||
May 27, 2019 (CF)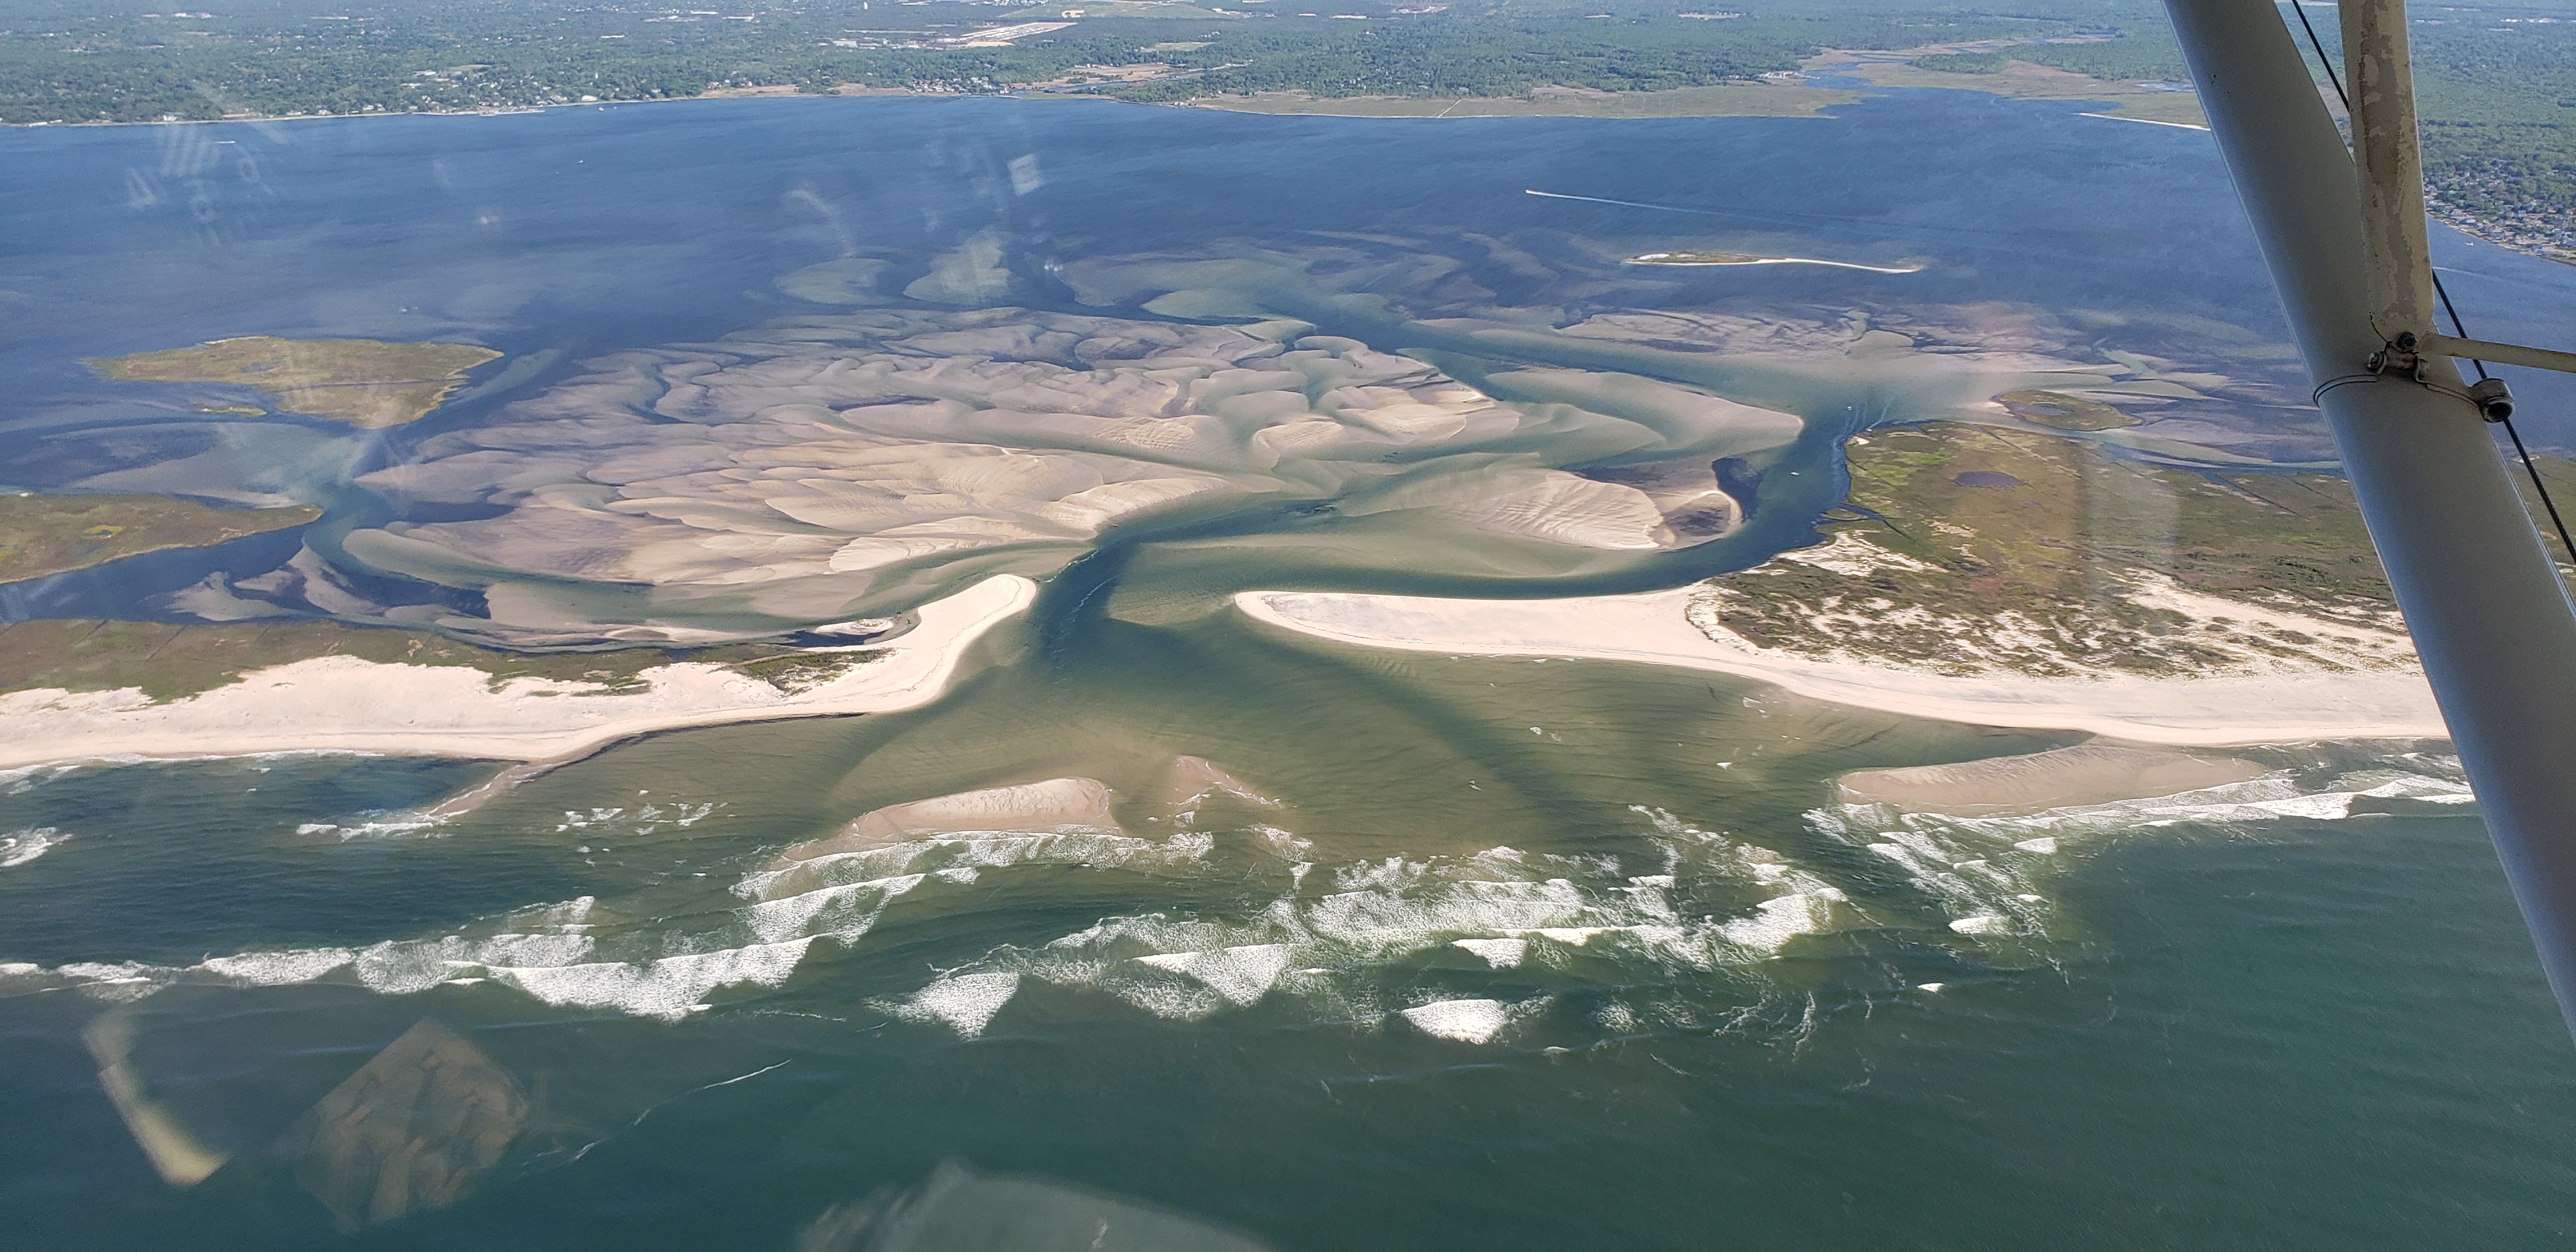  |
May 27, 2019 (CF)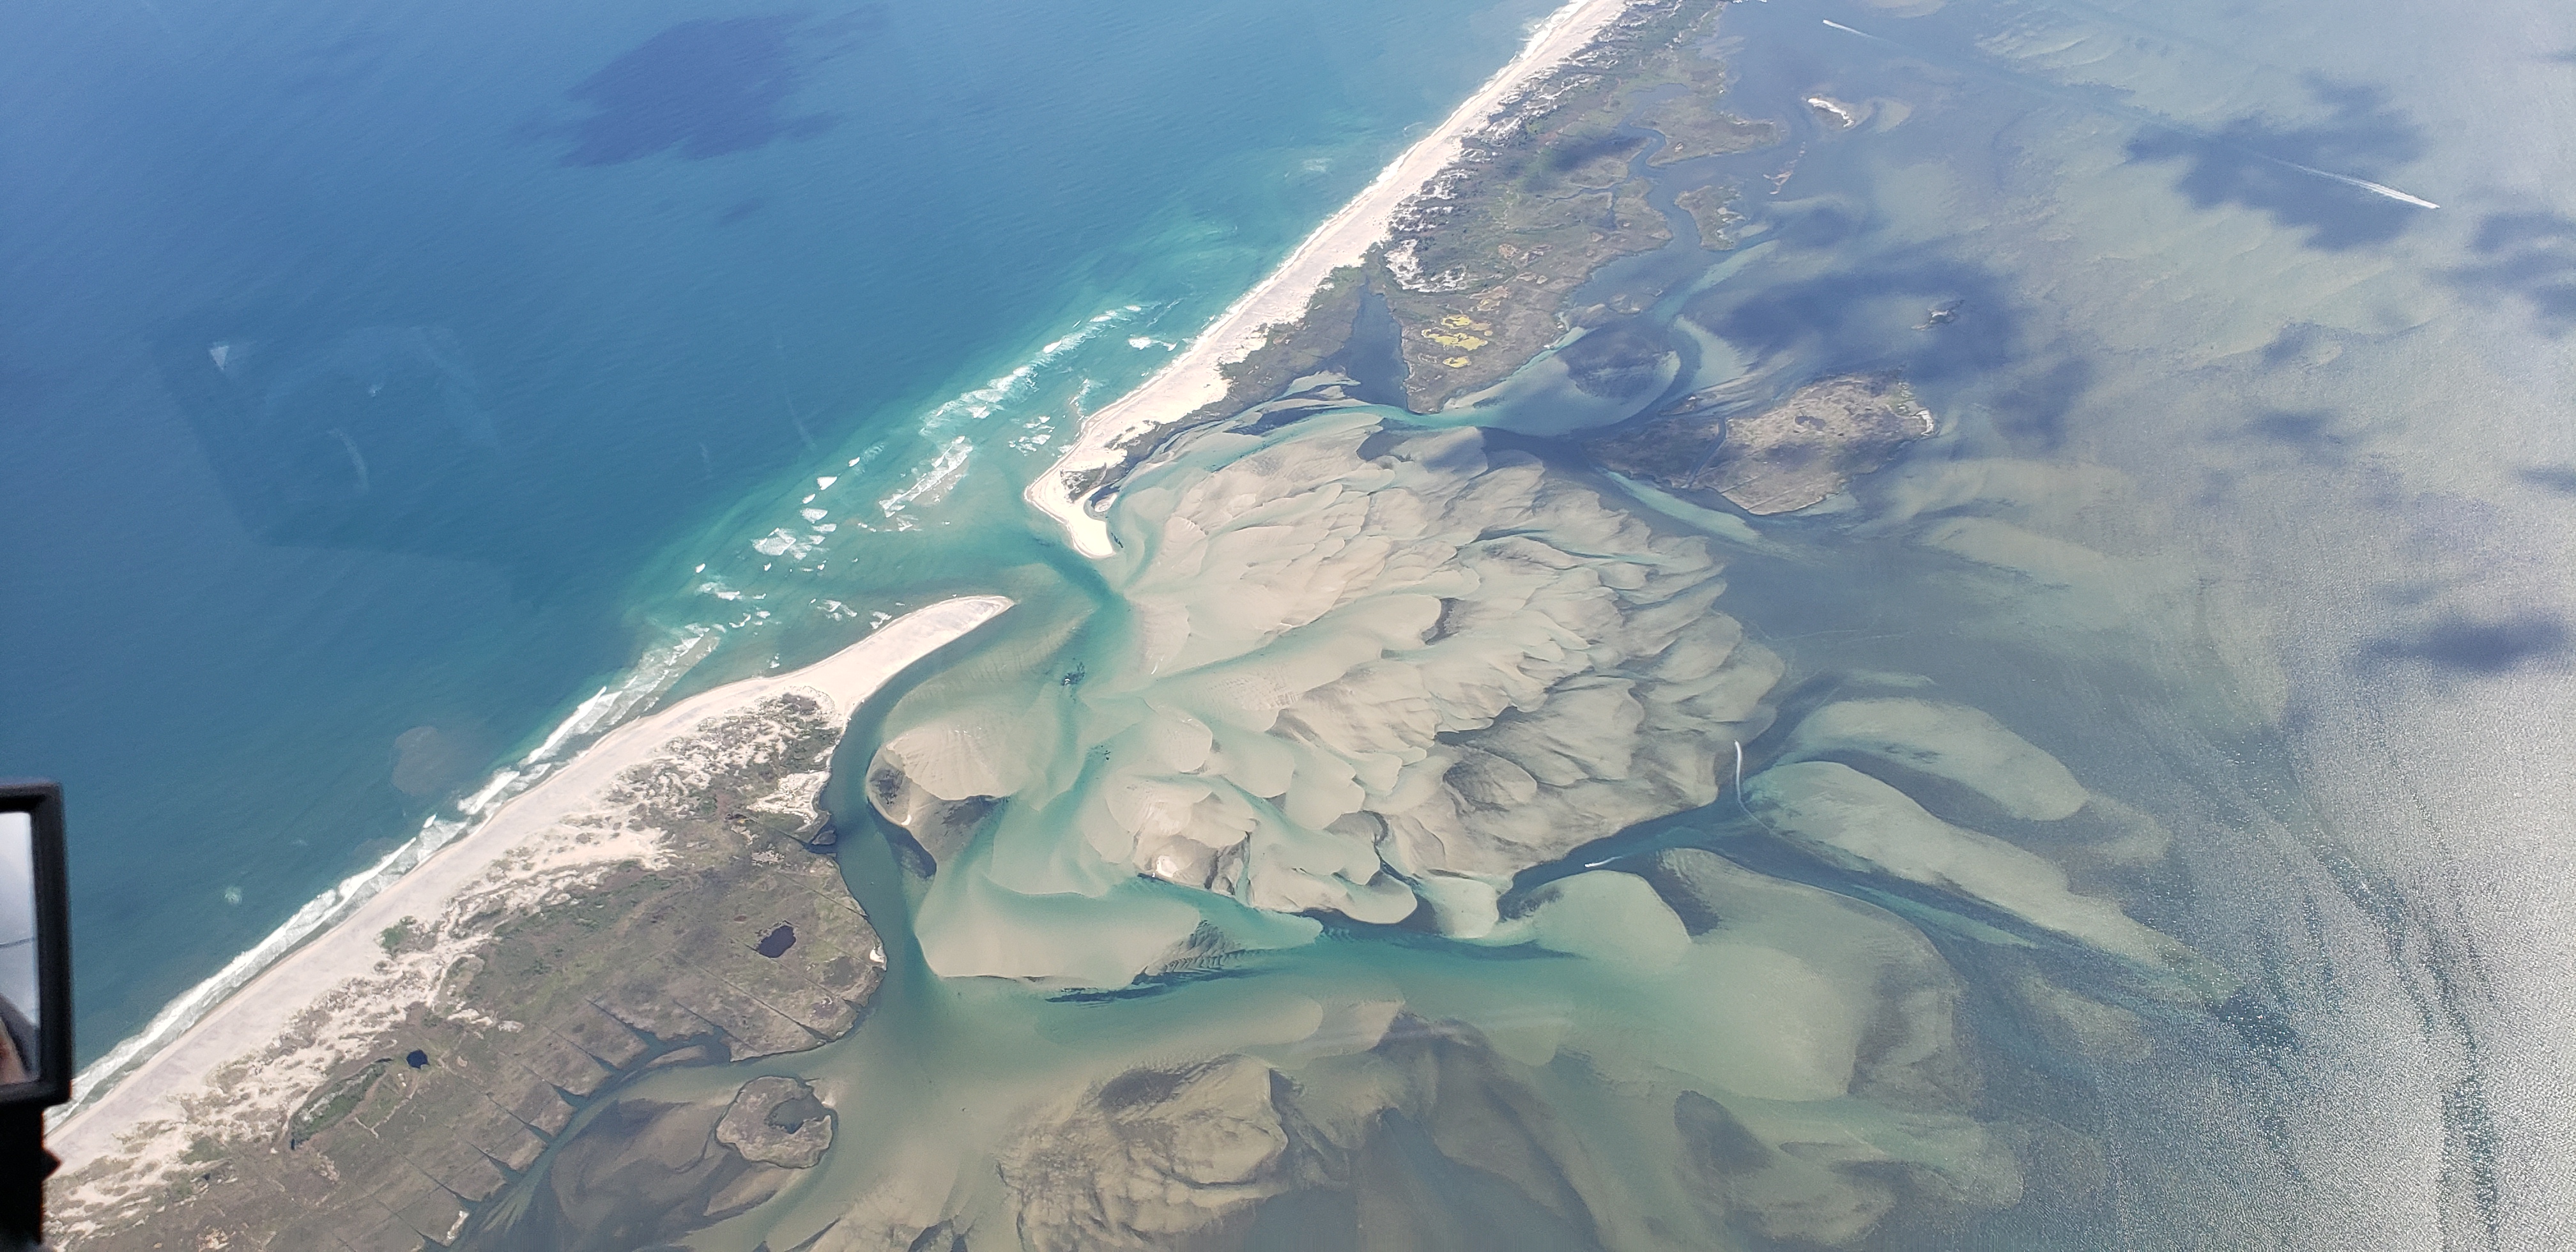 |
June 26, 2019 (CF)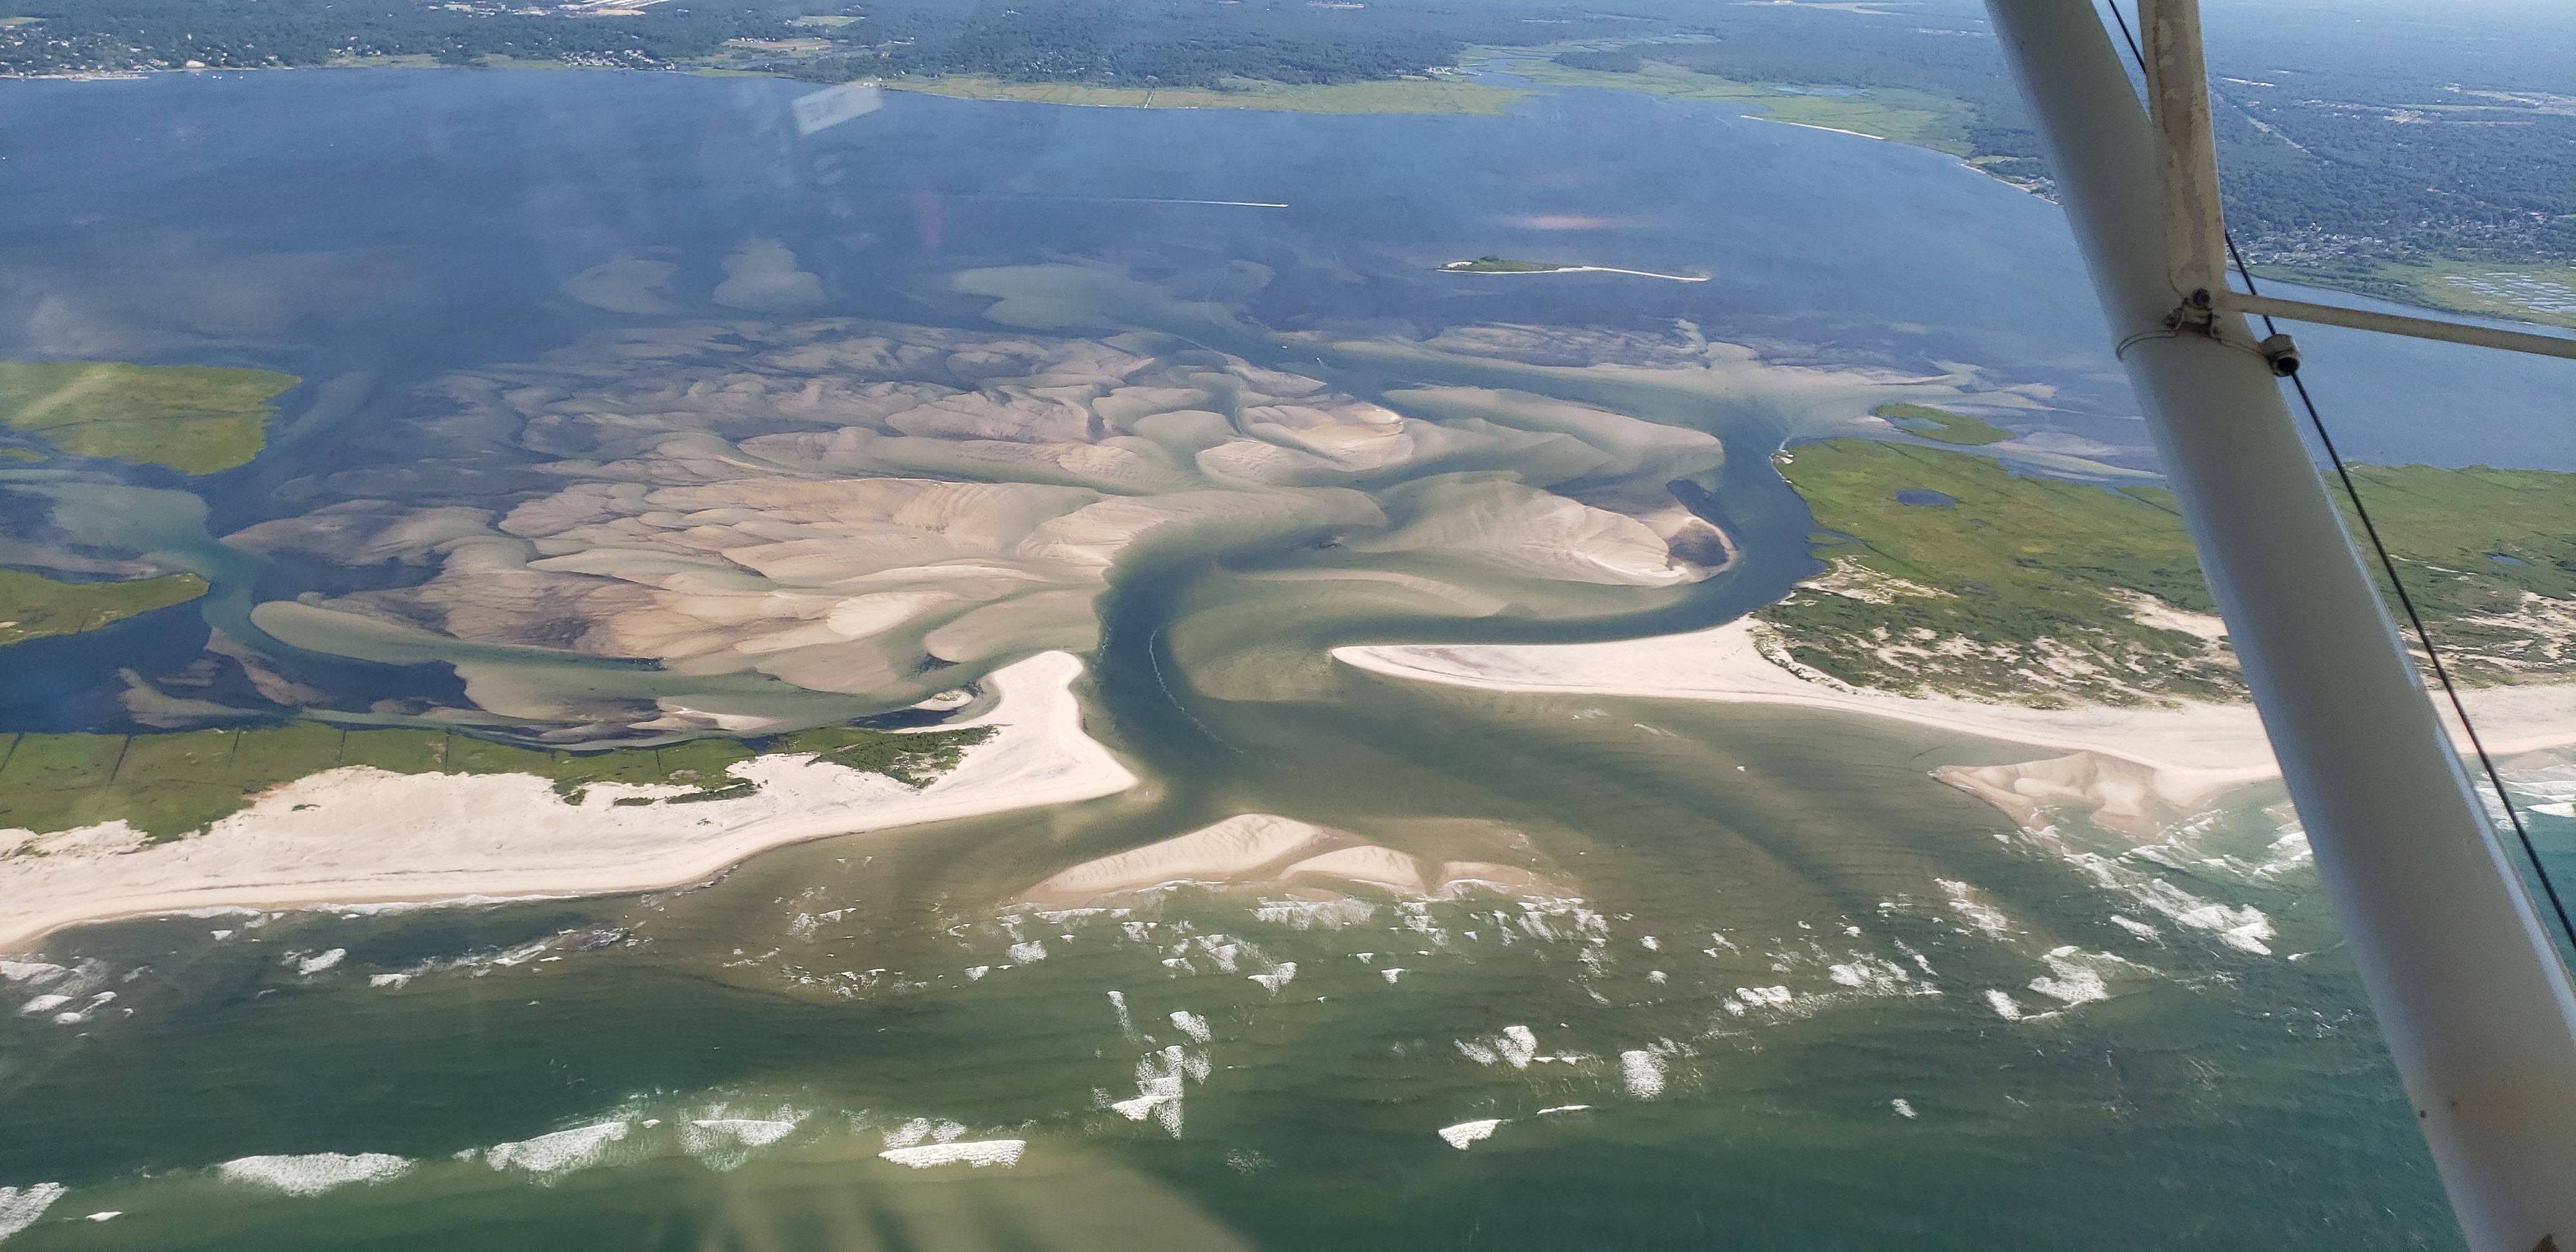 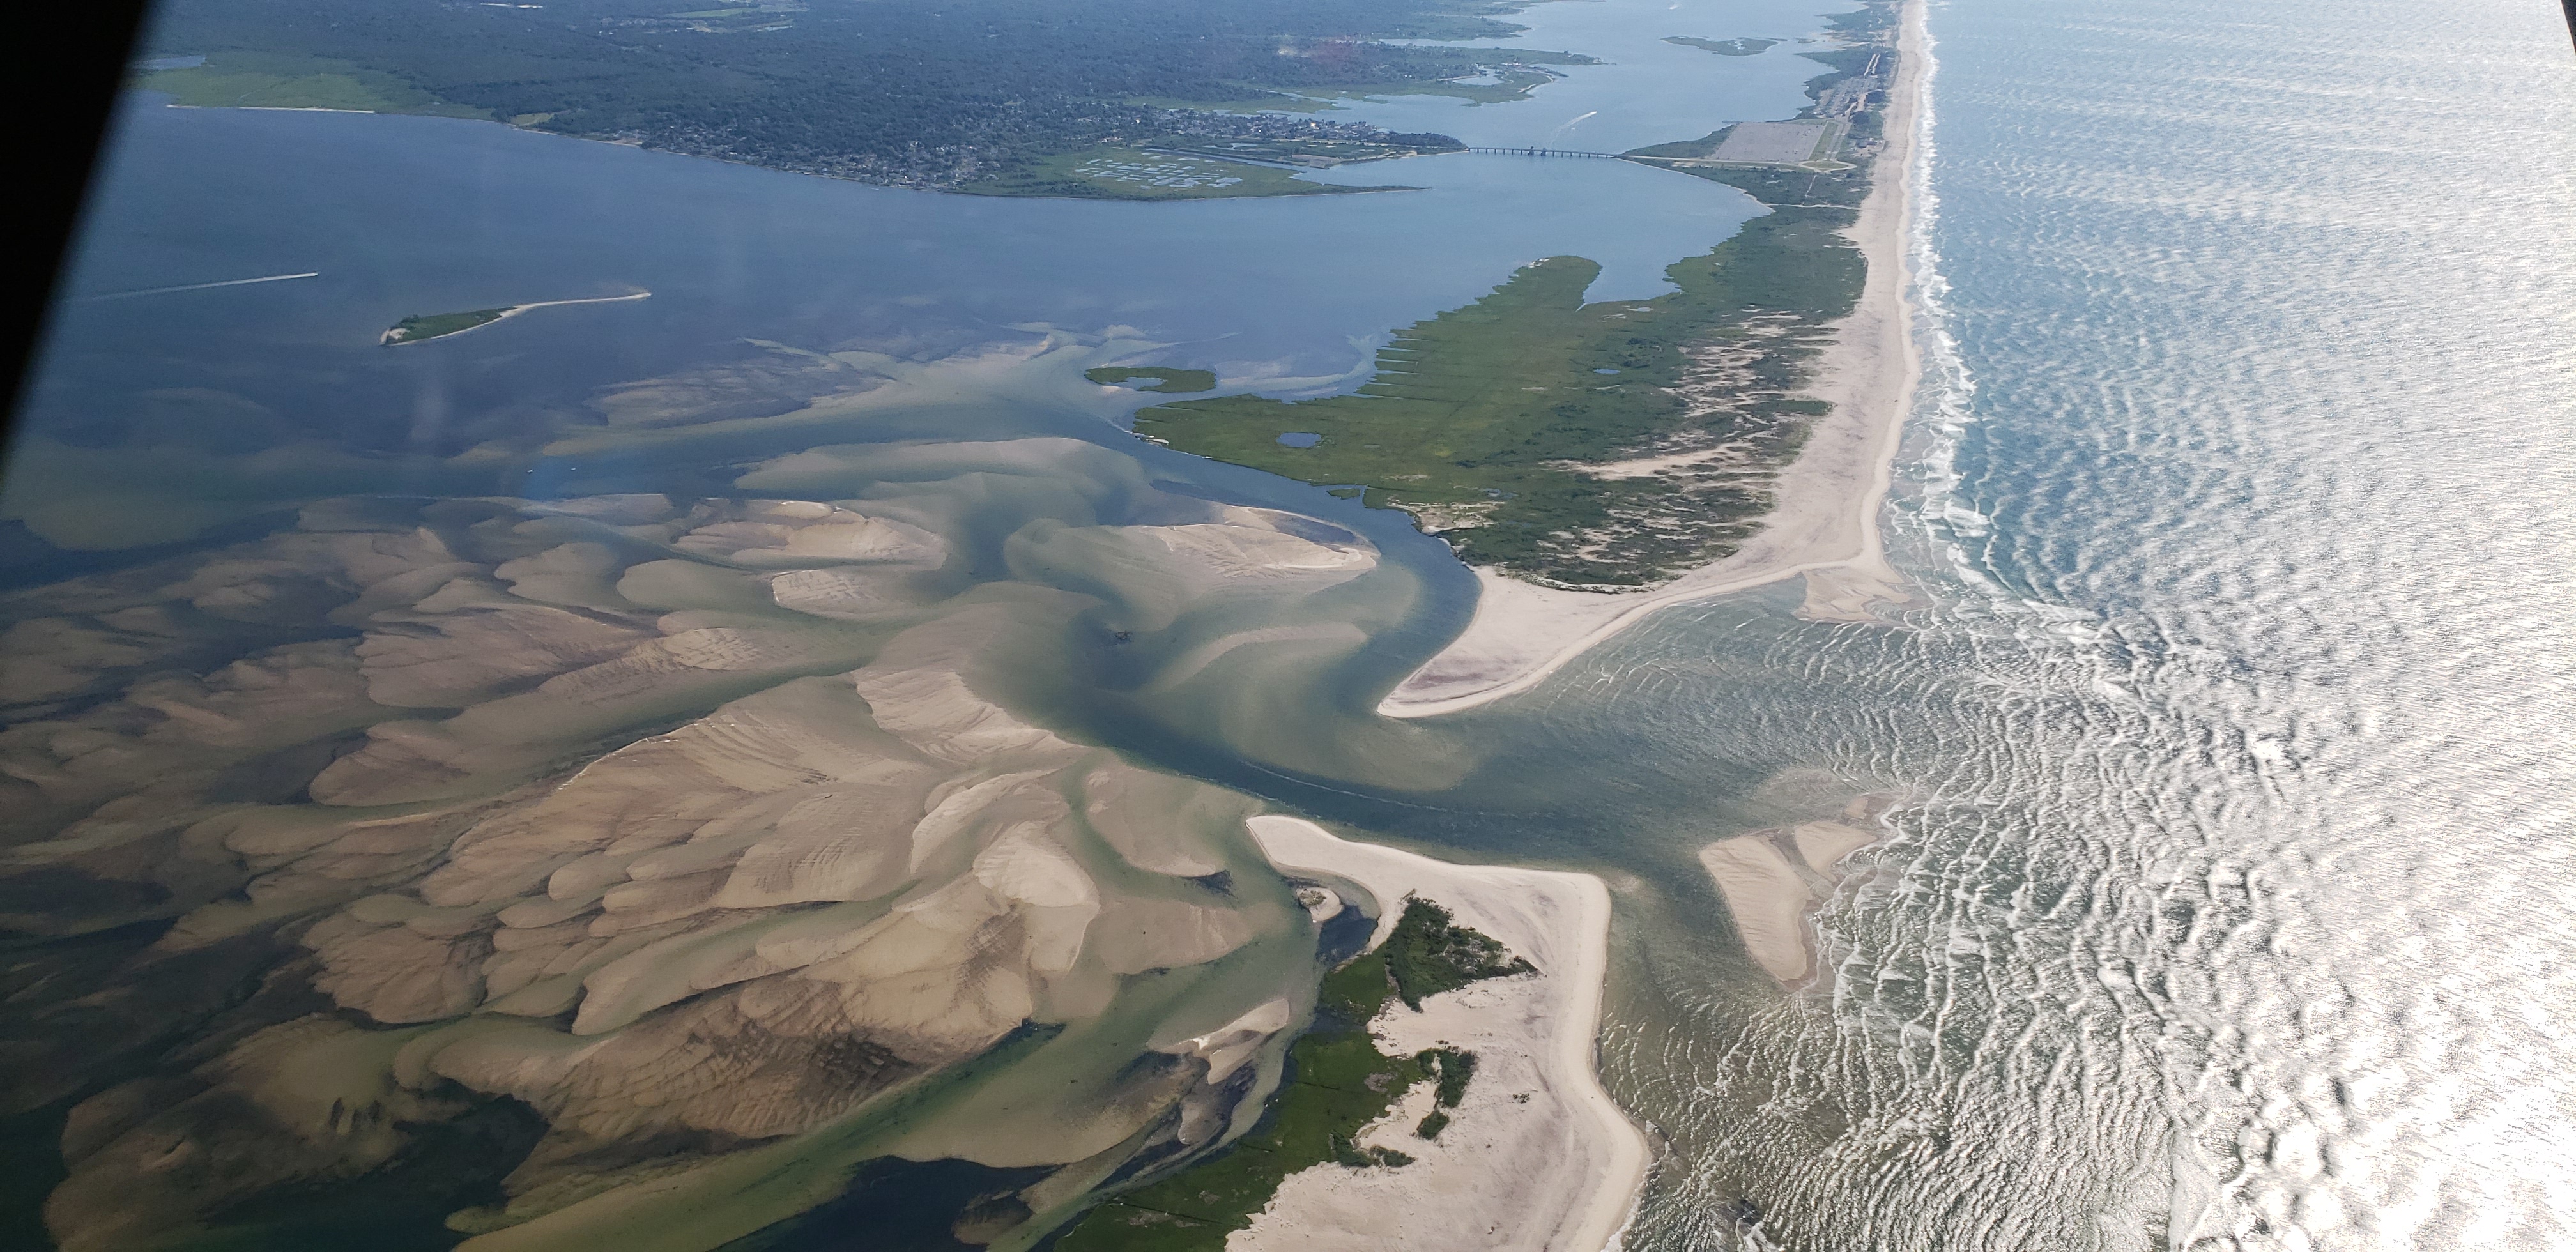 |
Aug 24, 2019 (CF)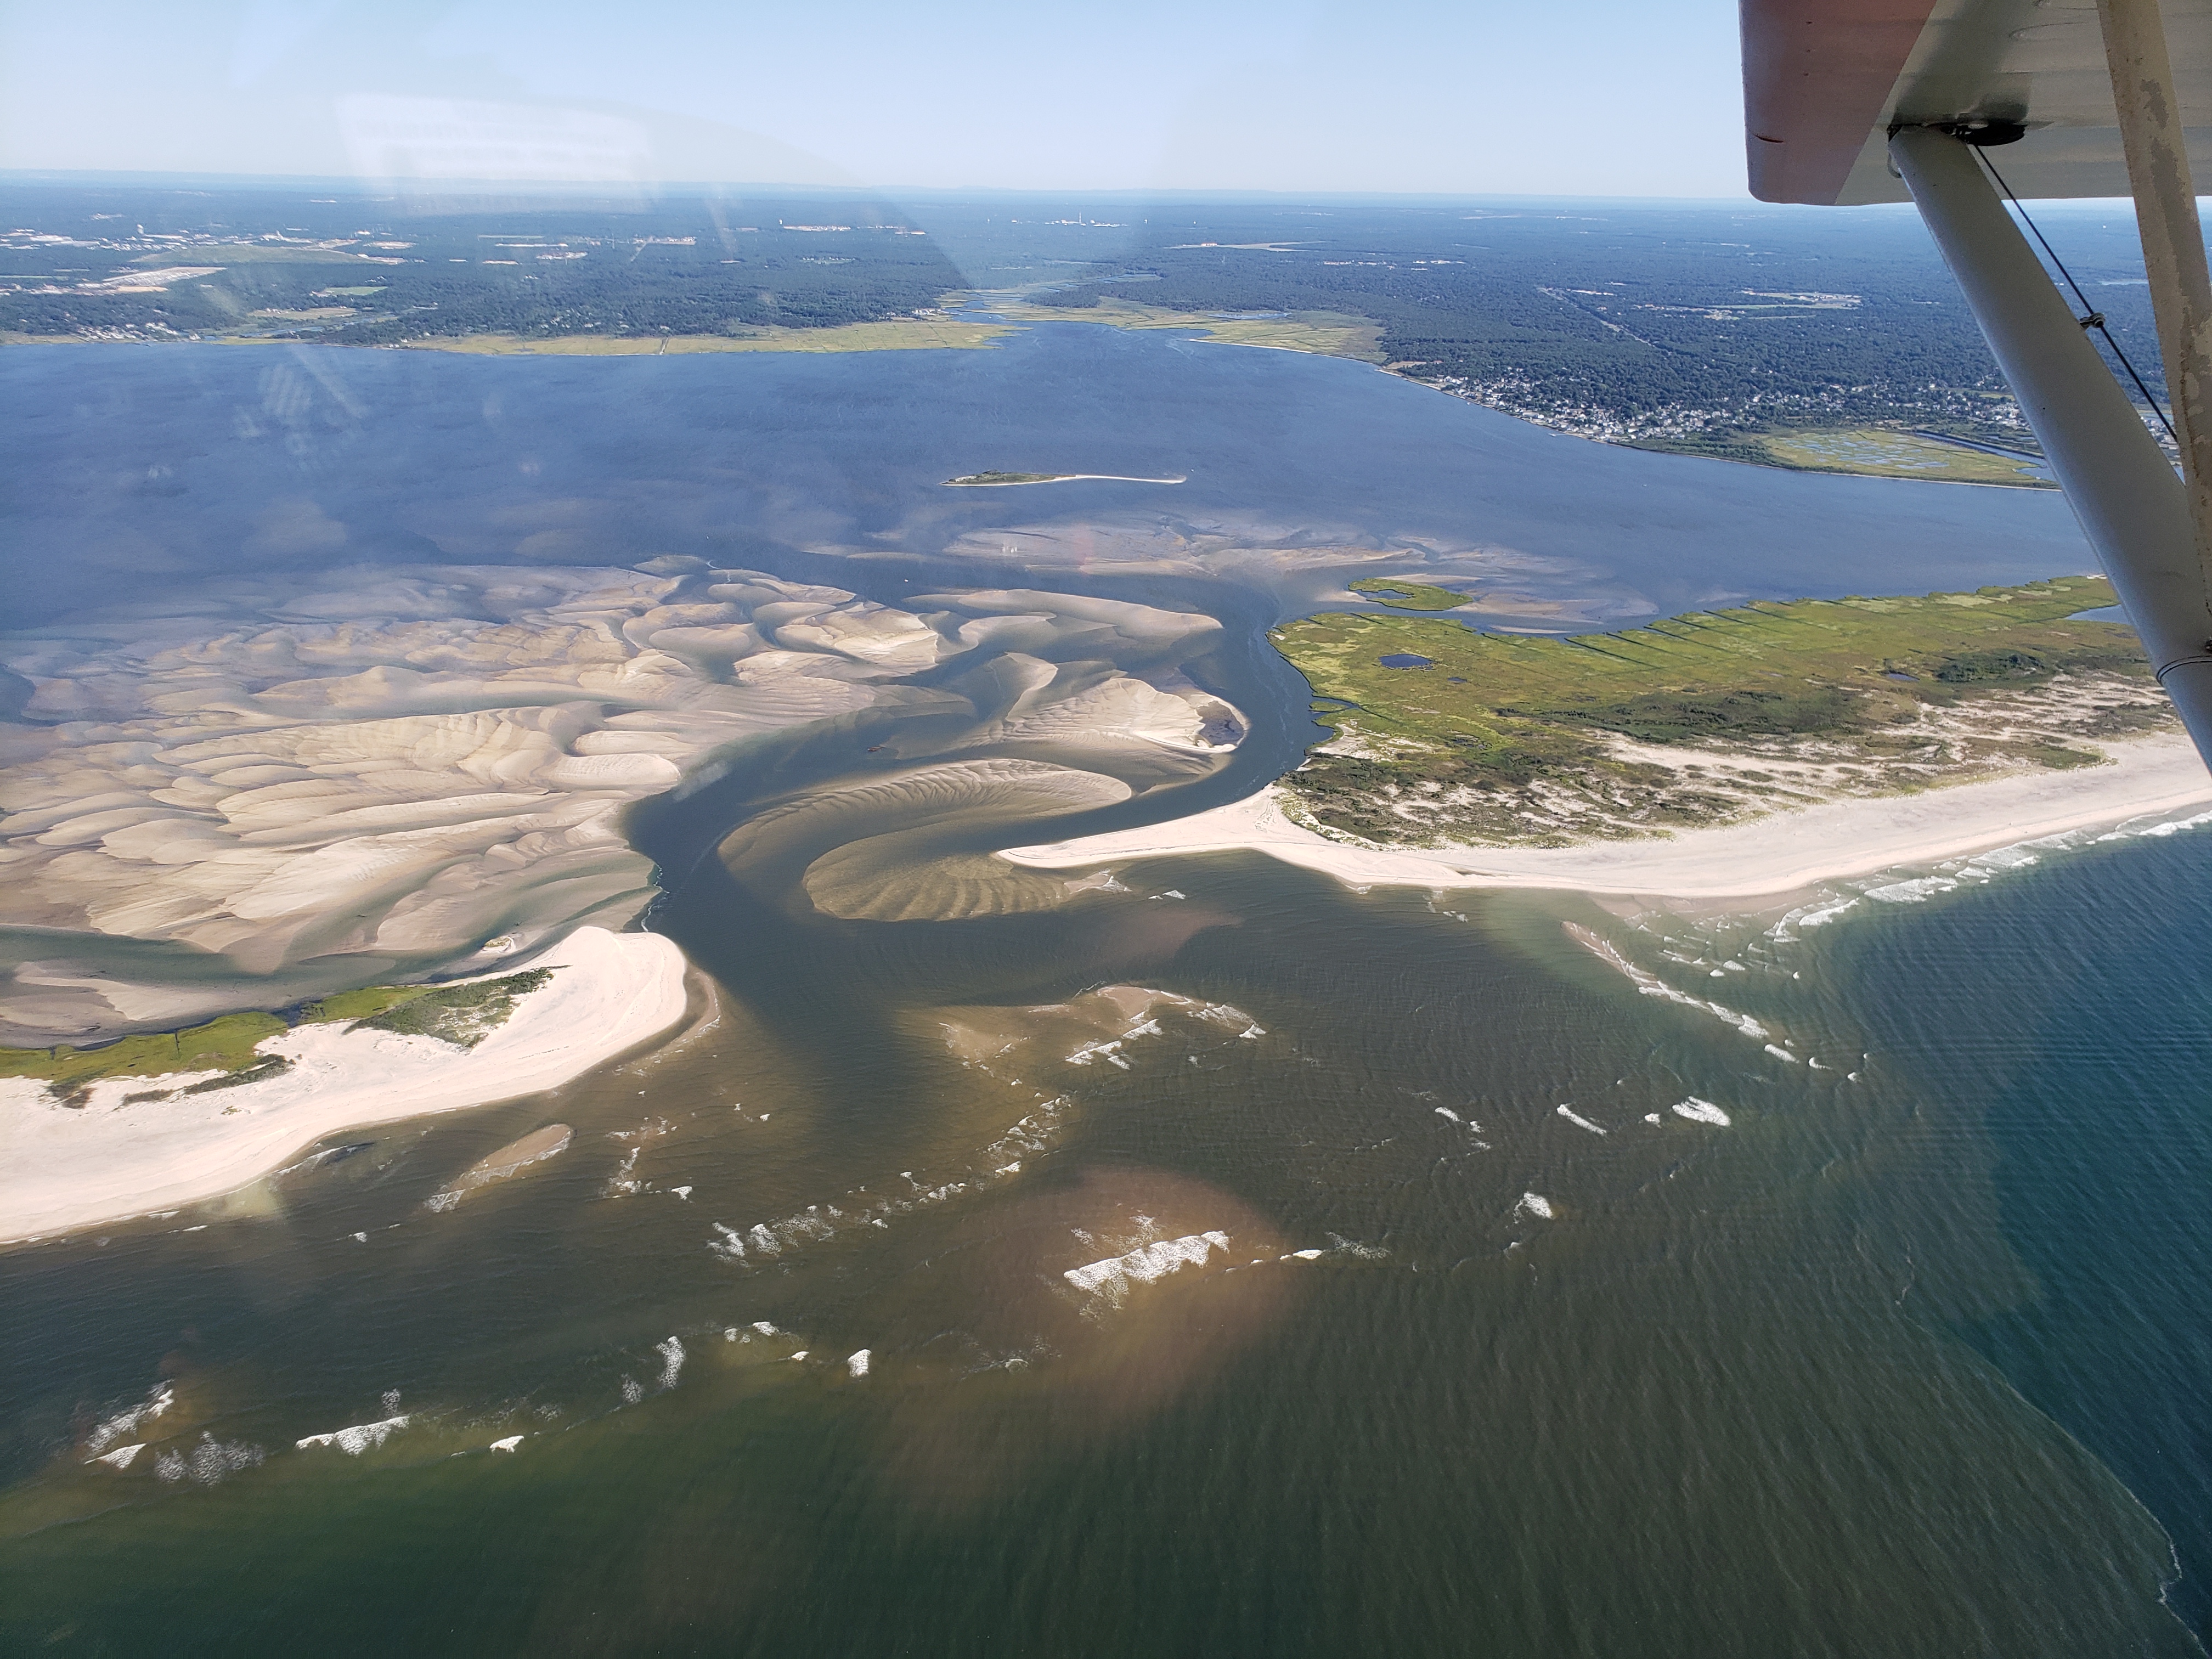 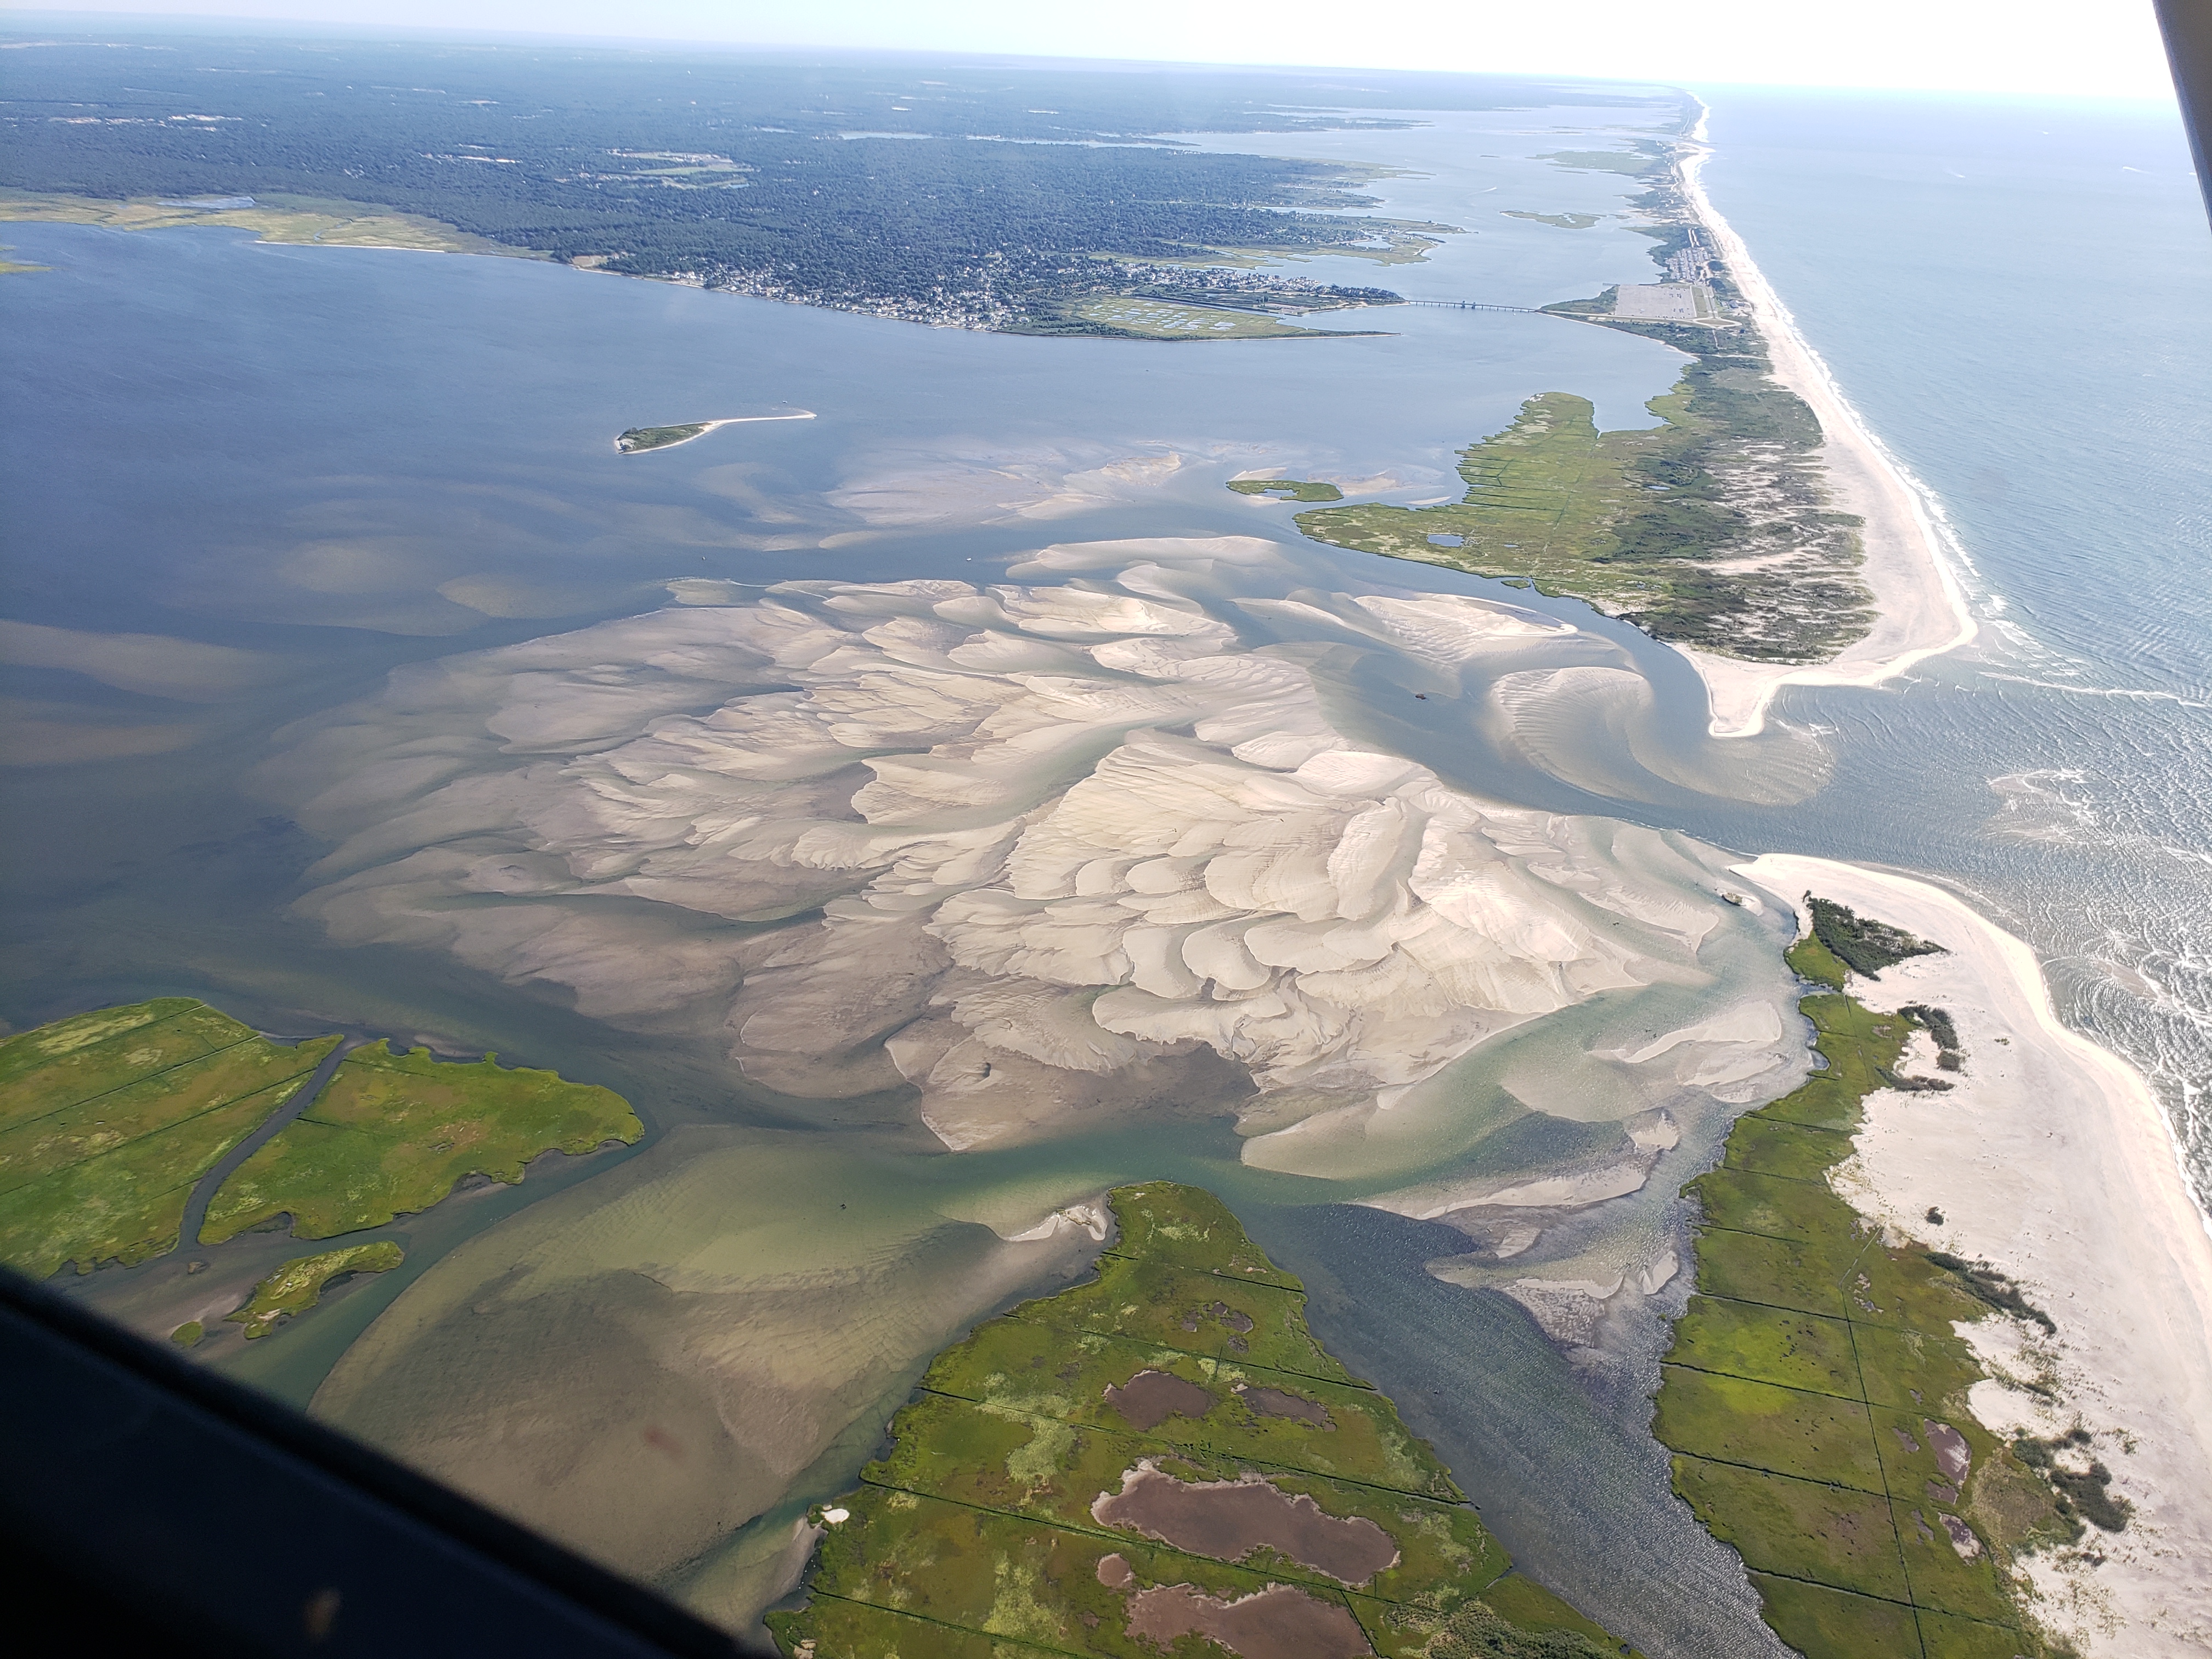 |
||||
Sept 23, 2019 (CF)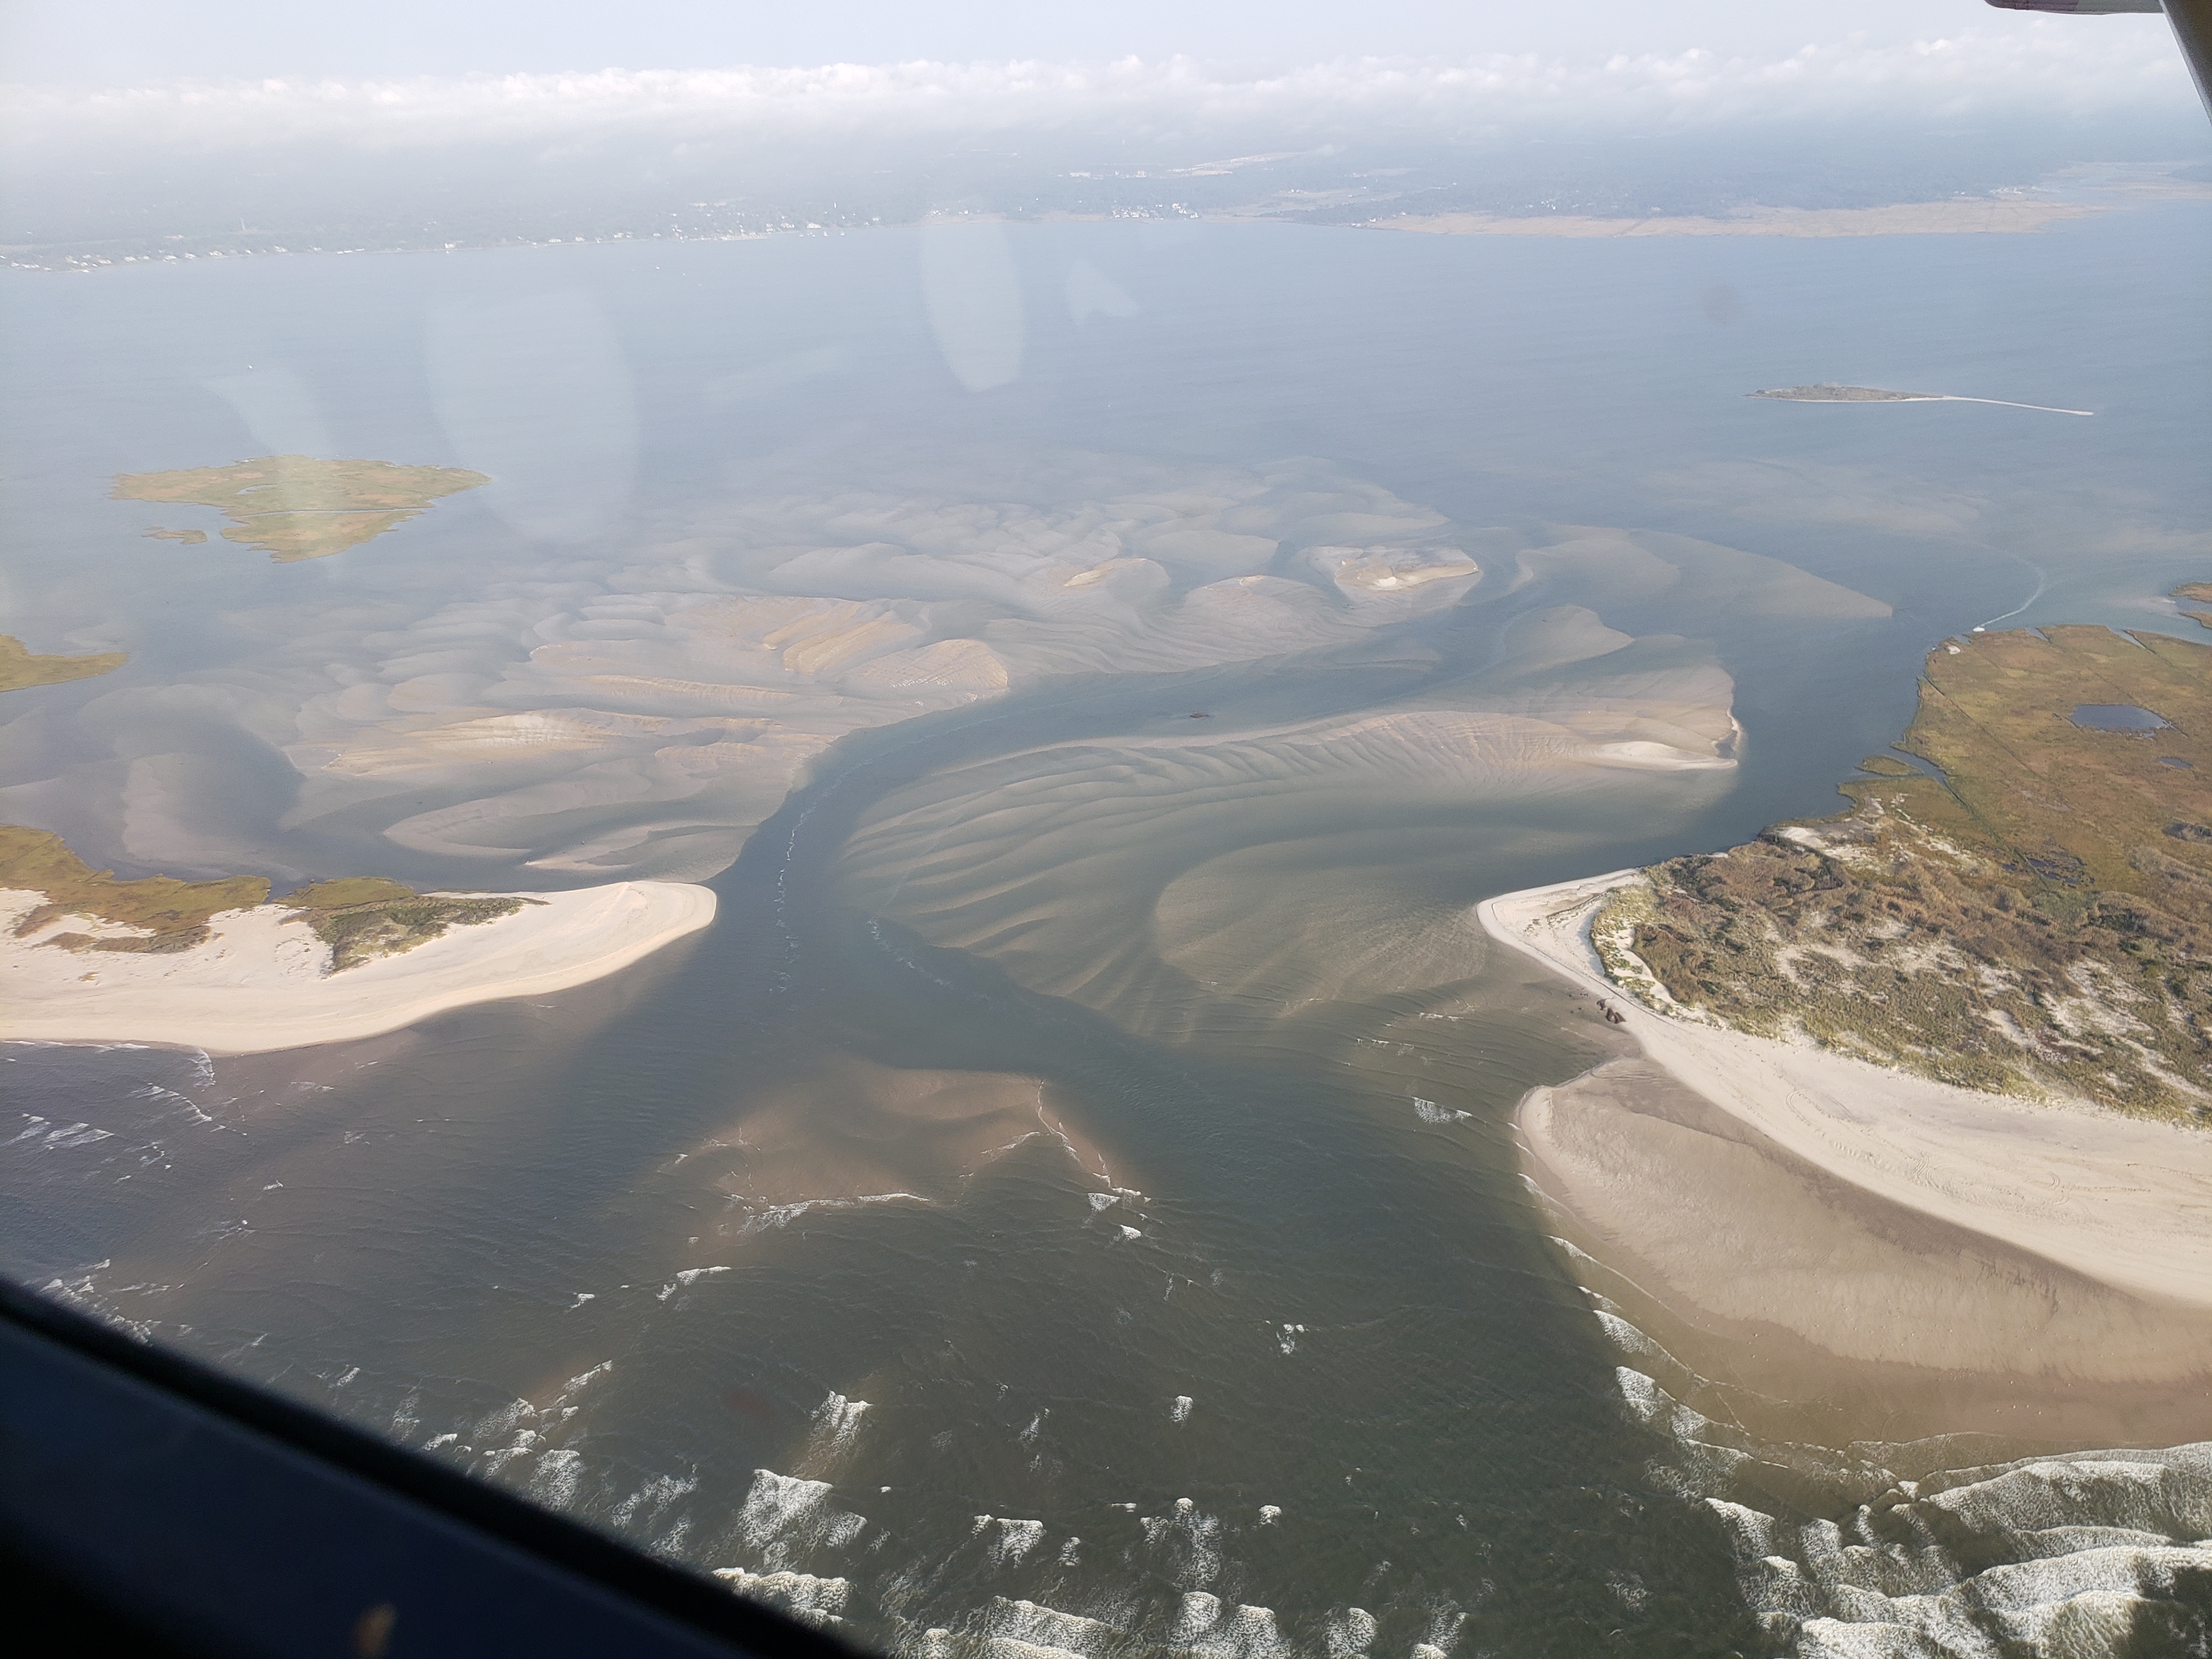 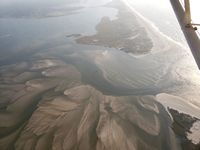 |
Oct 24, 2019 (CF)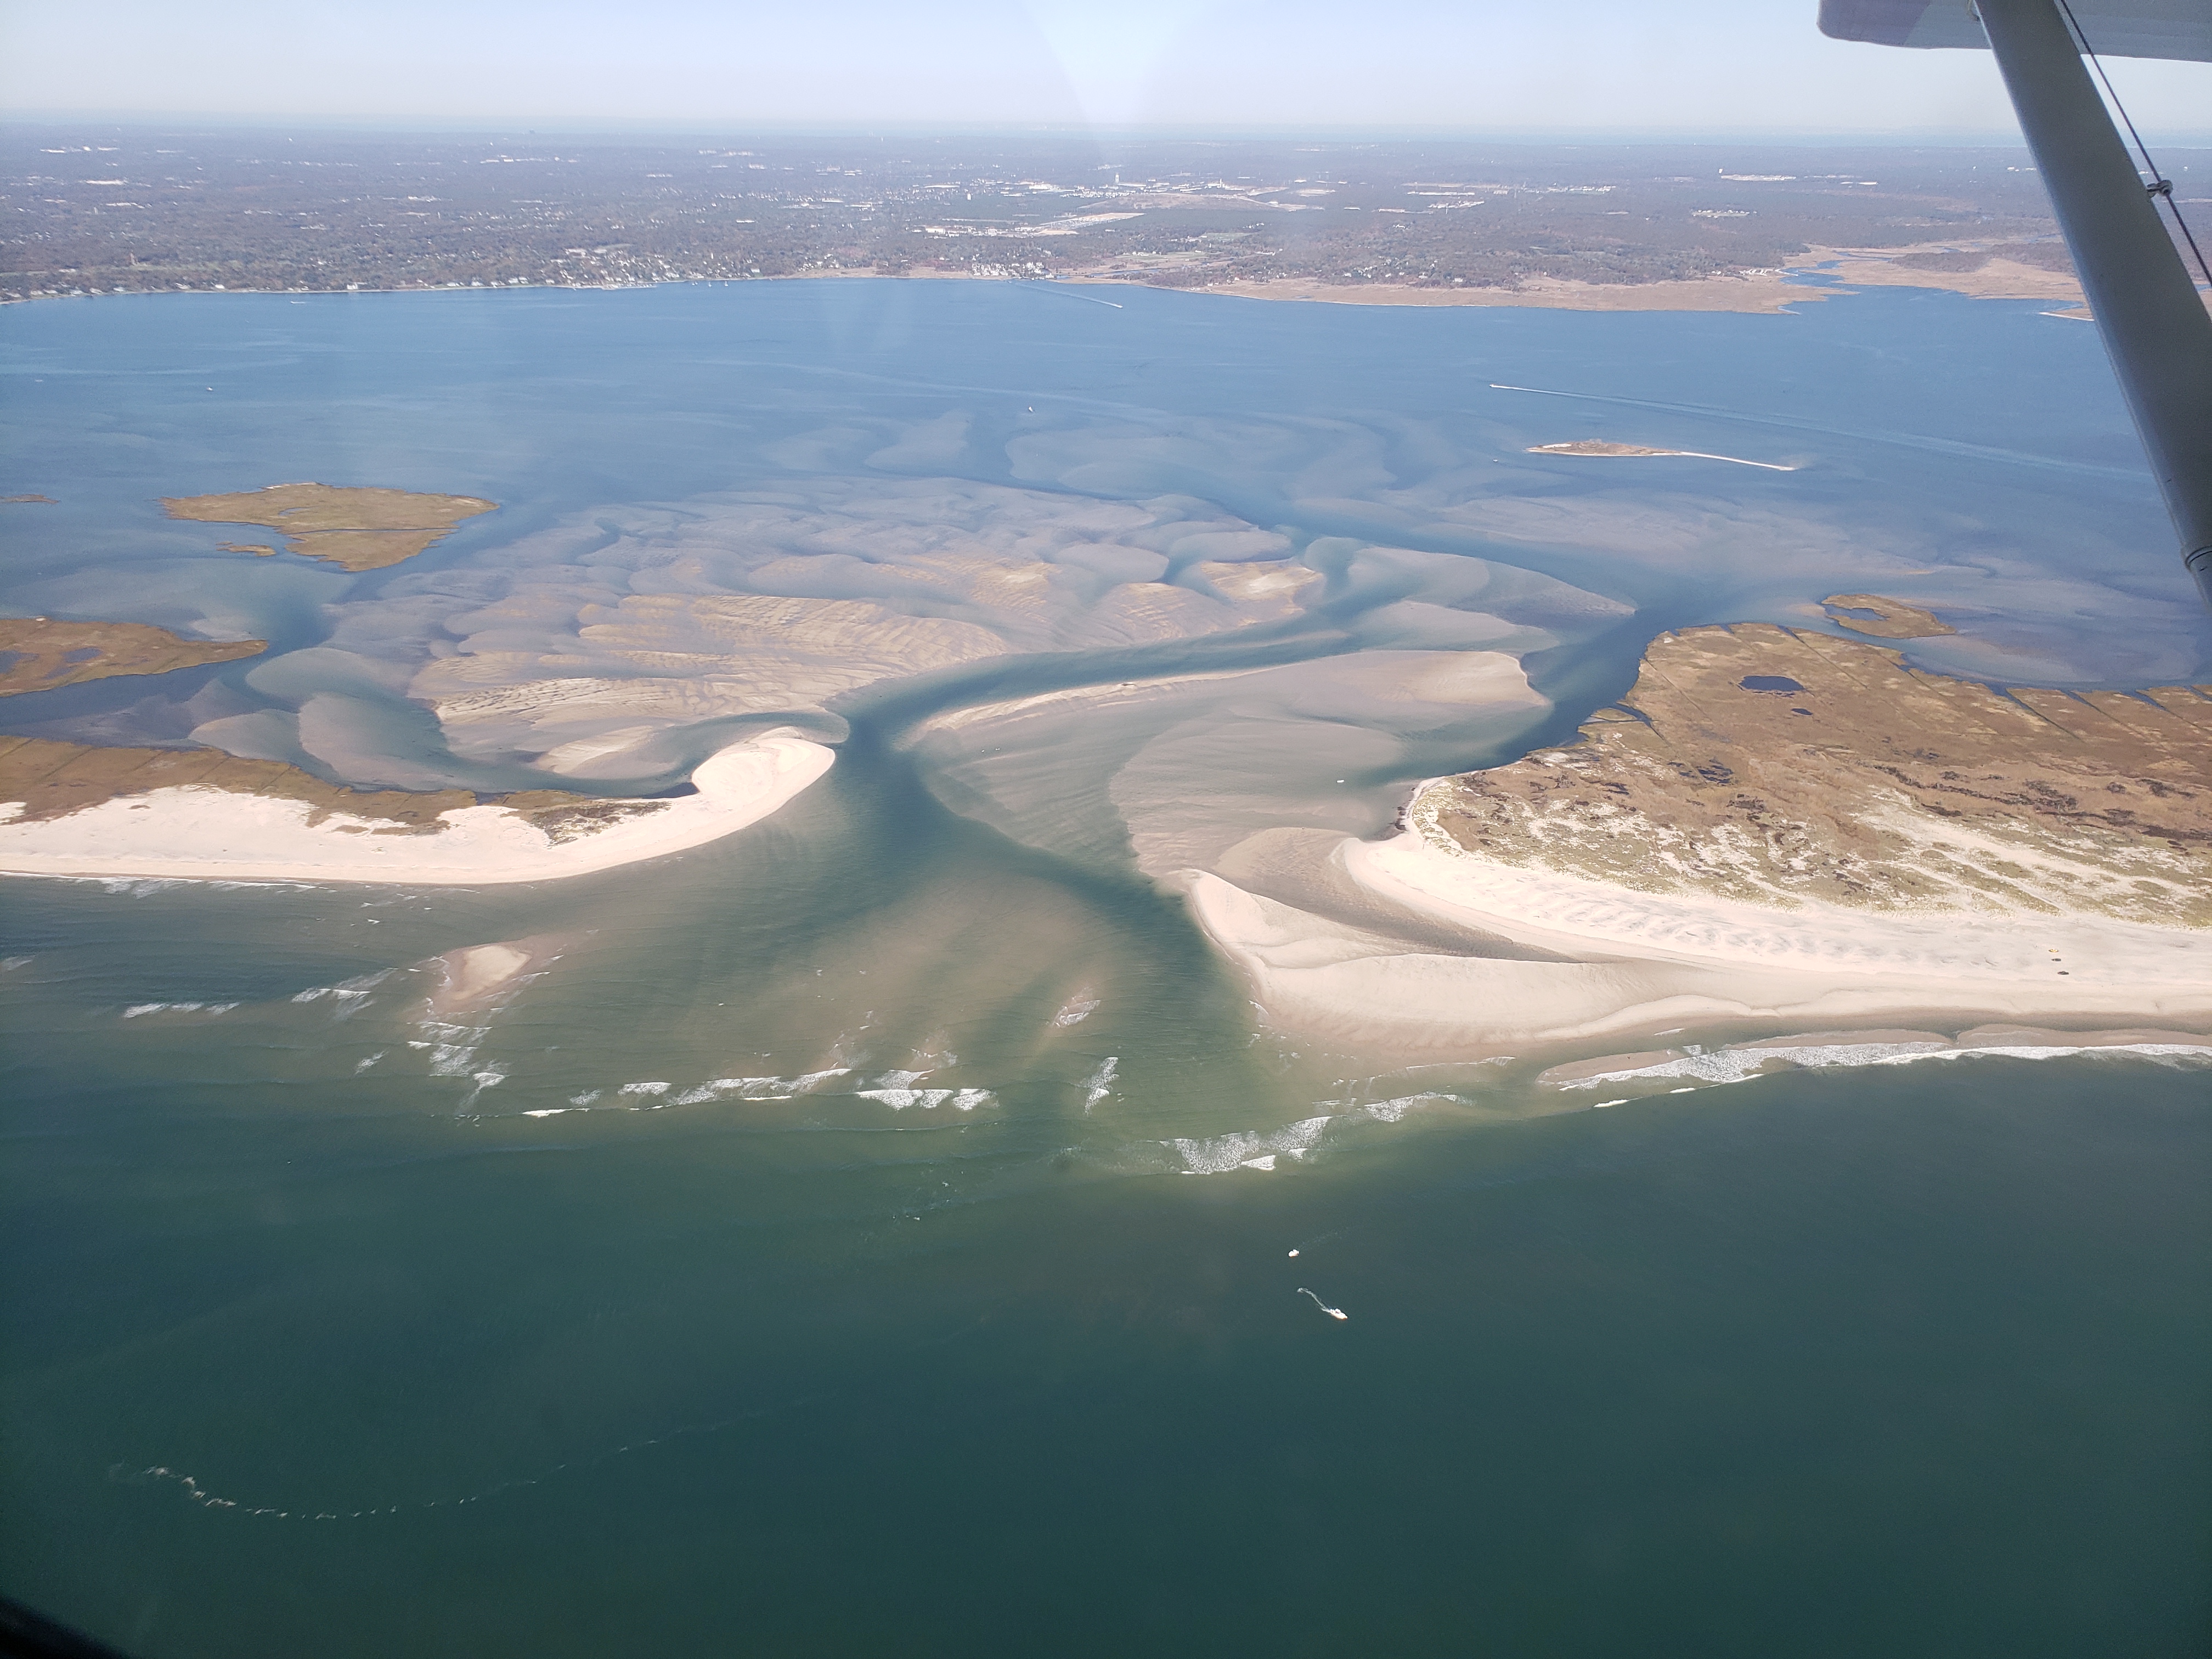  |
Dec 8, 2019 (CF)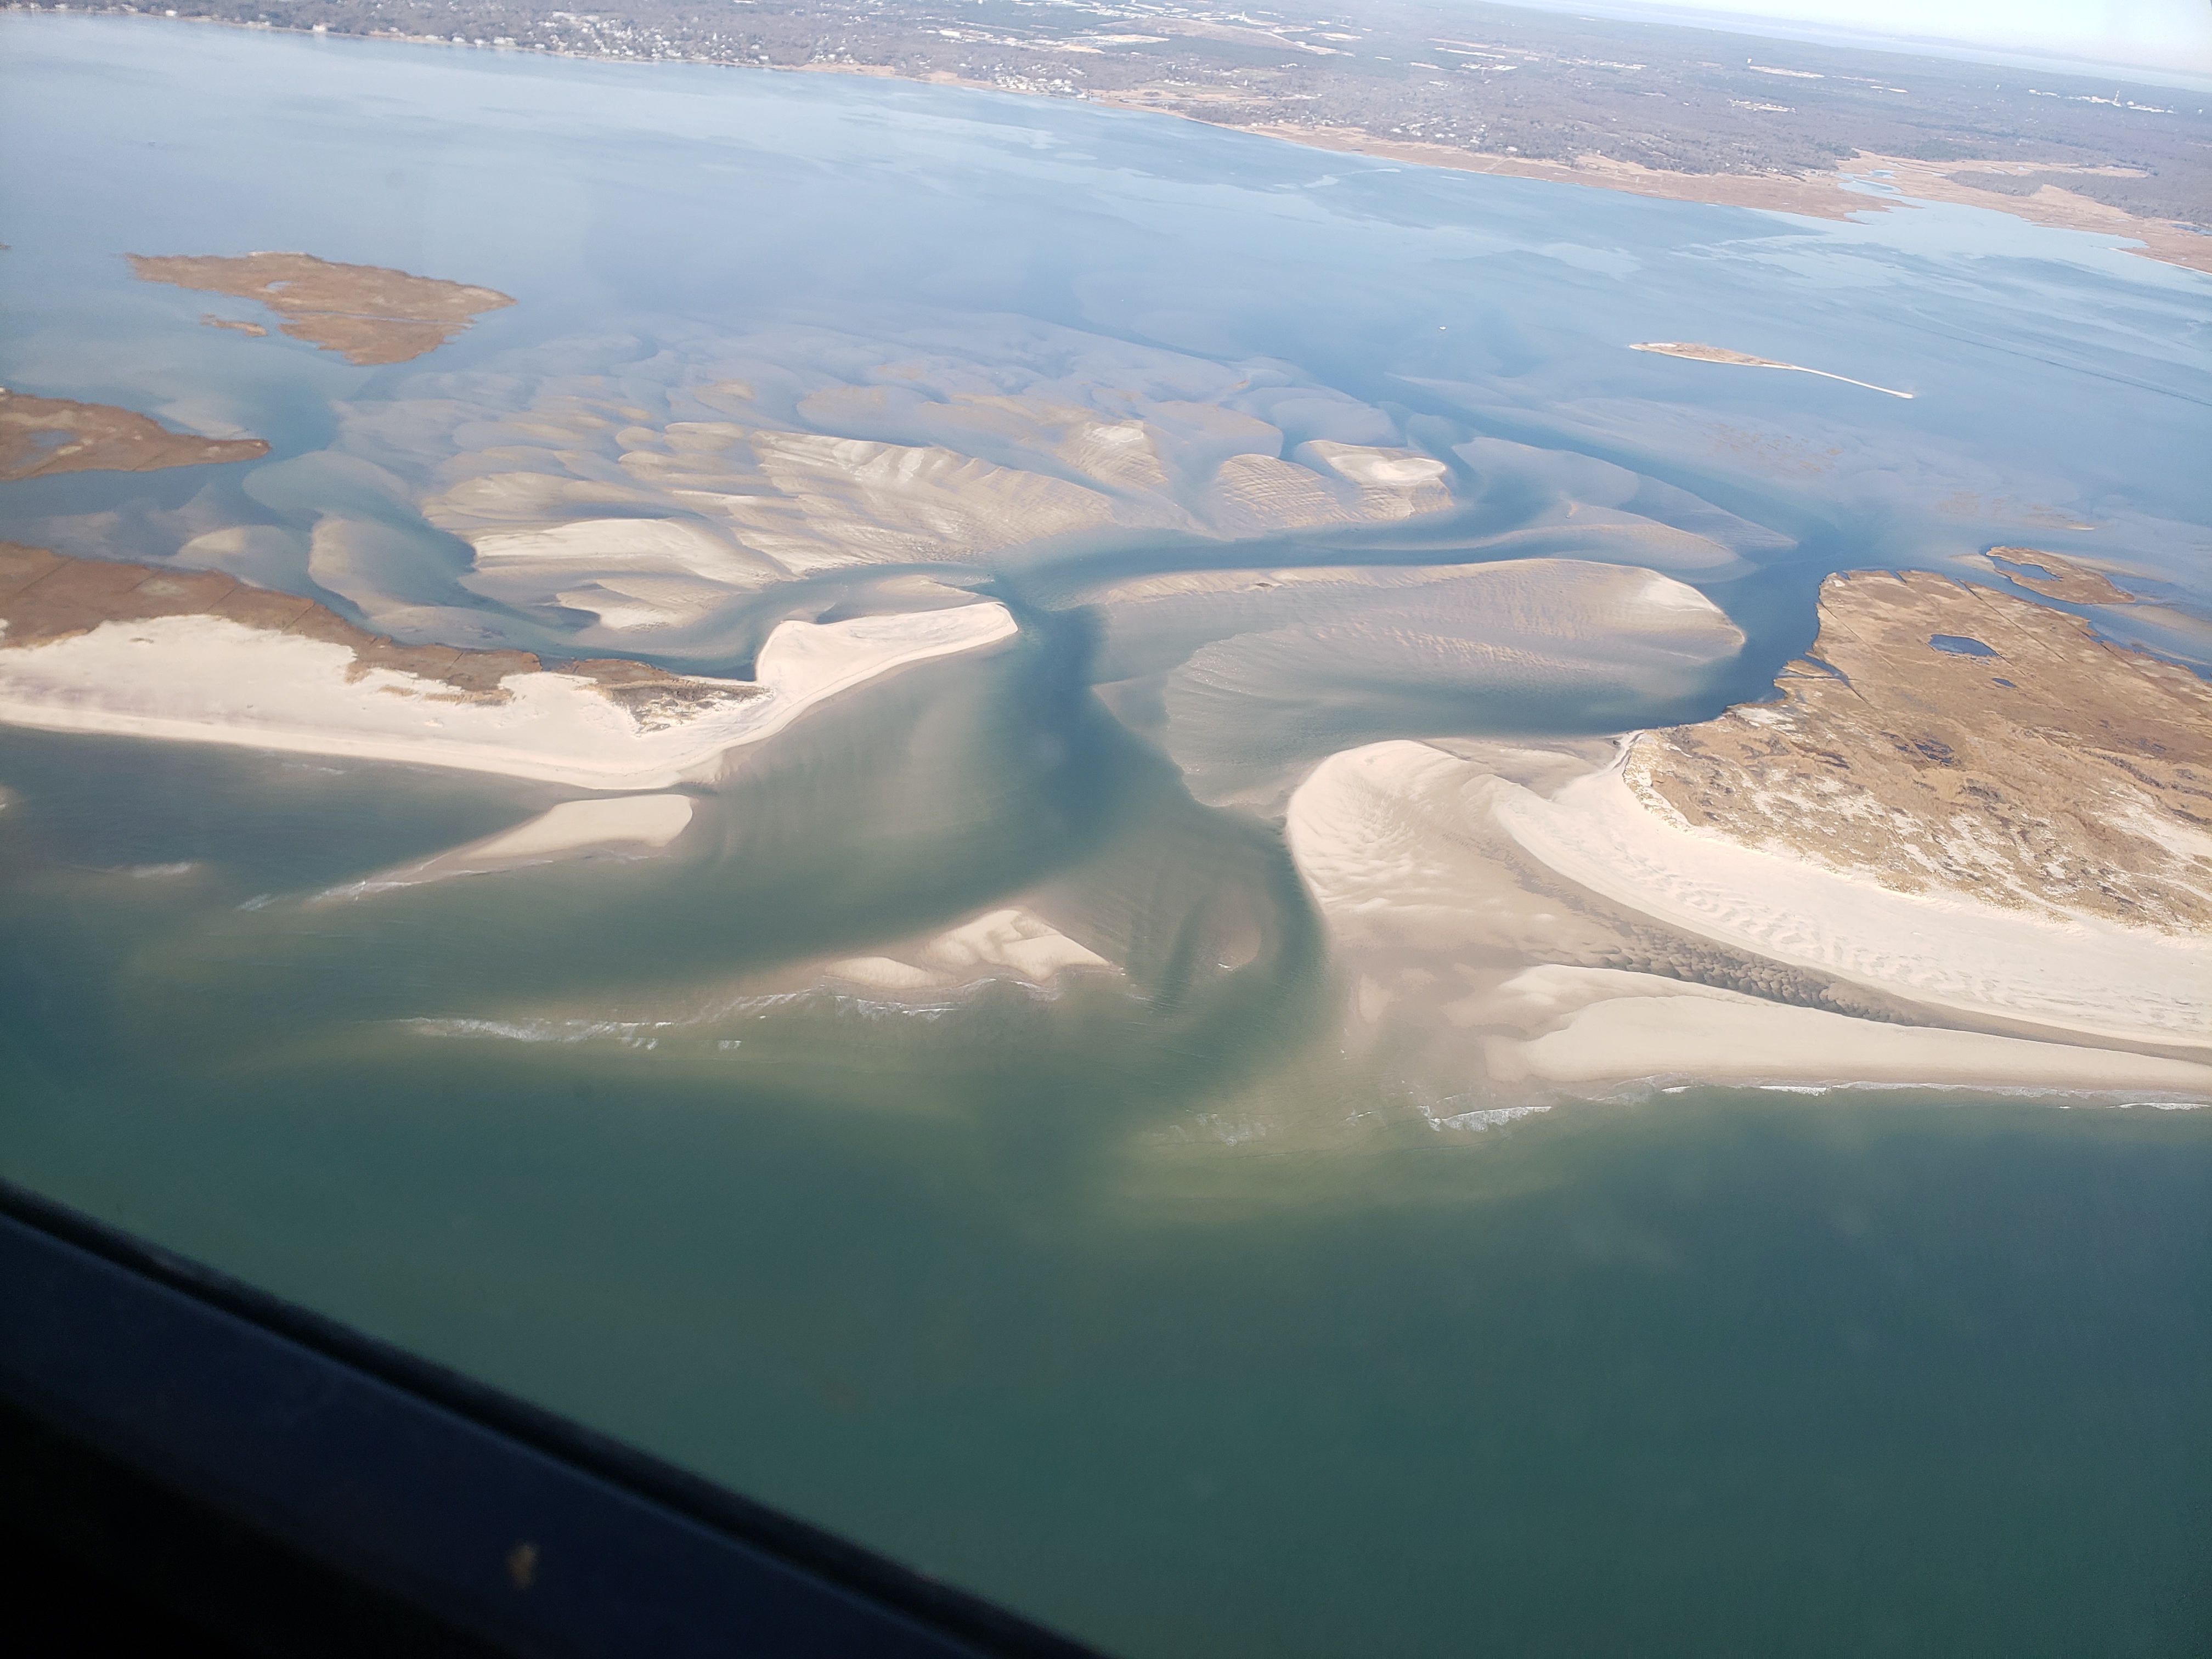 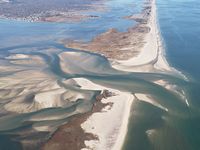 |
Dec 8, 2019 (CF)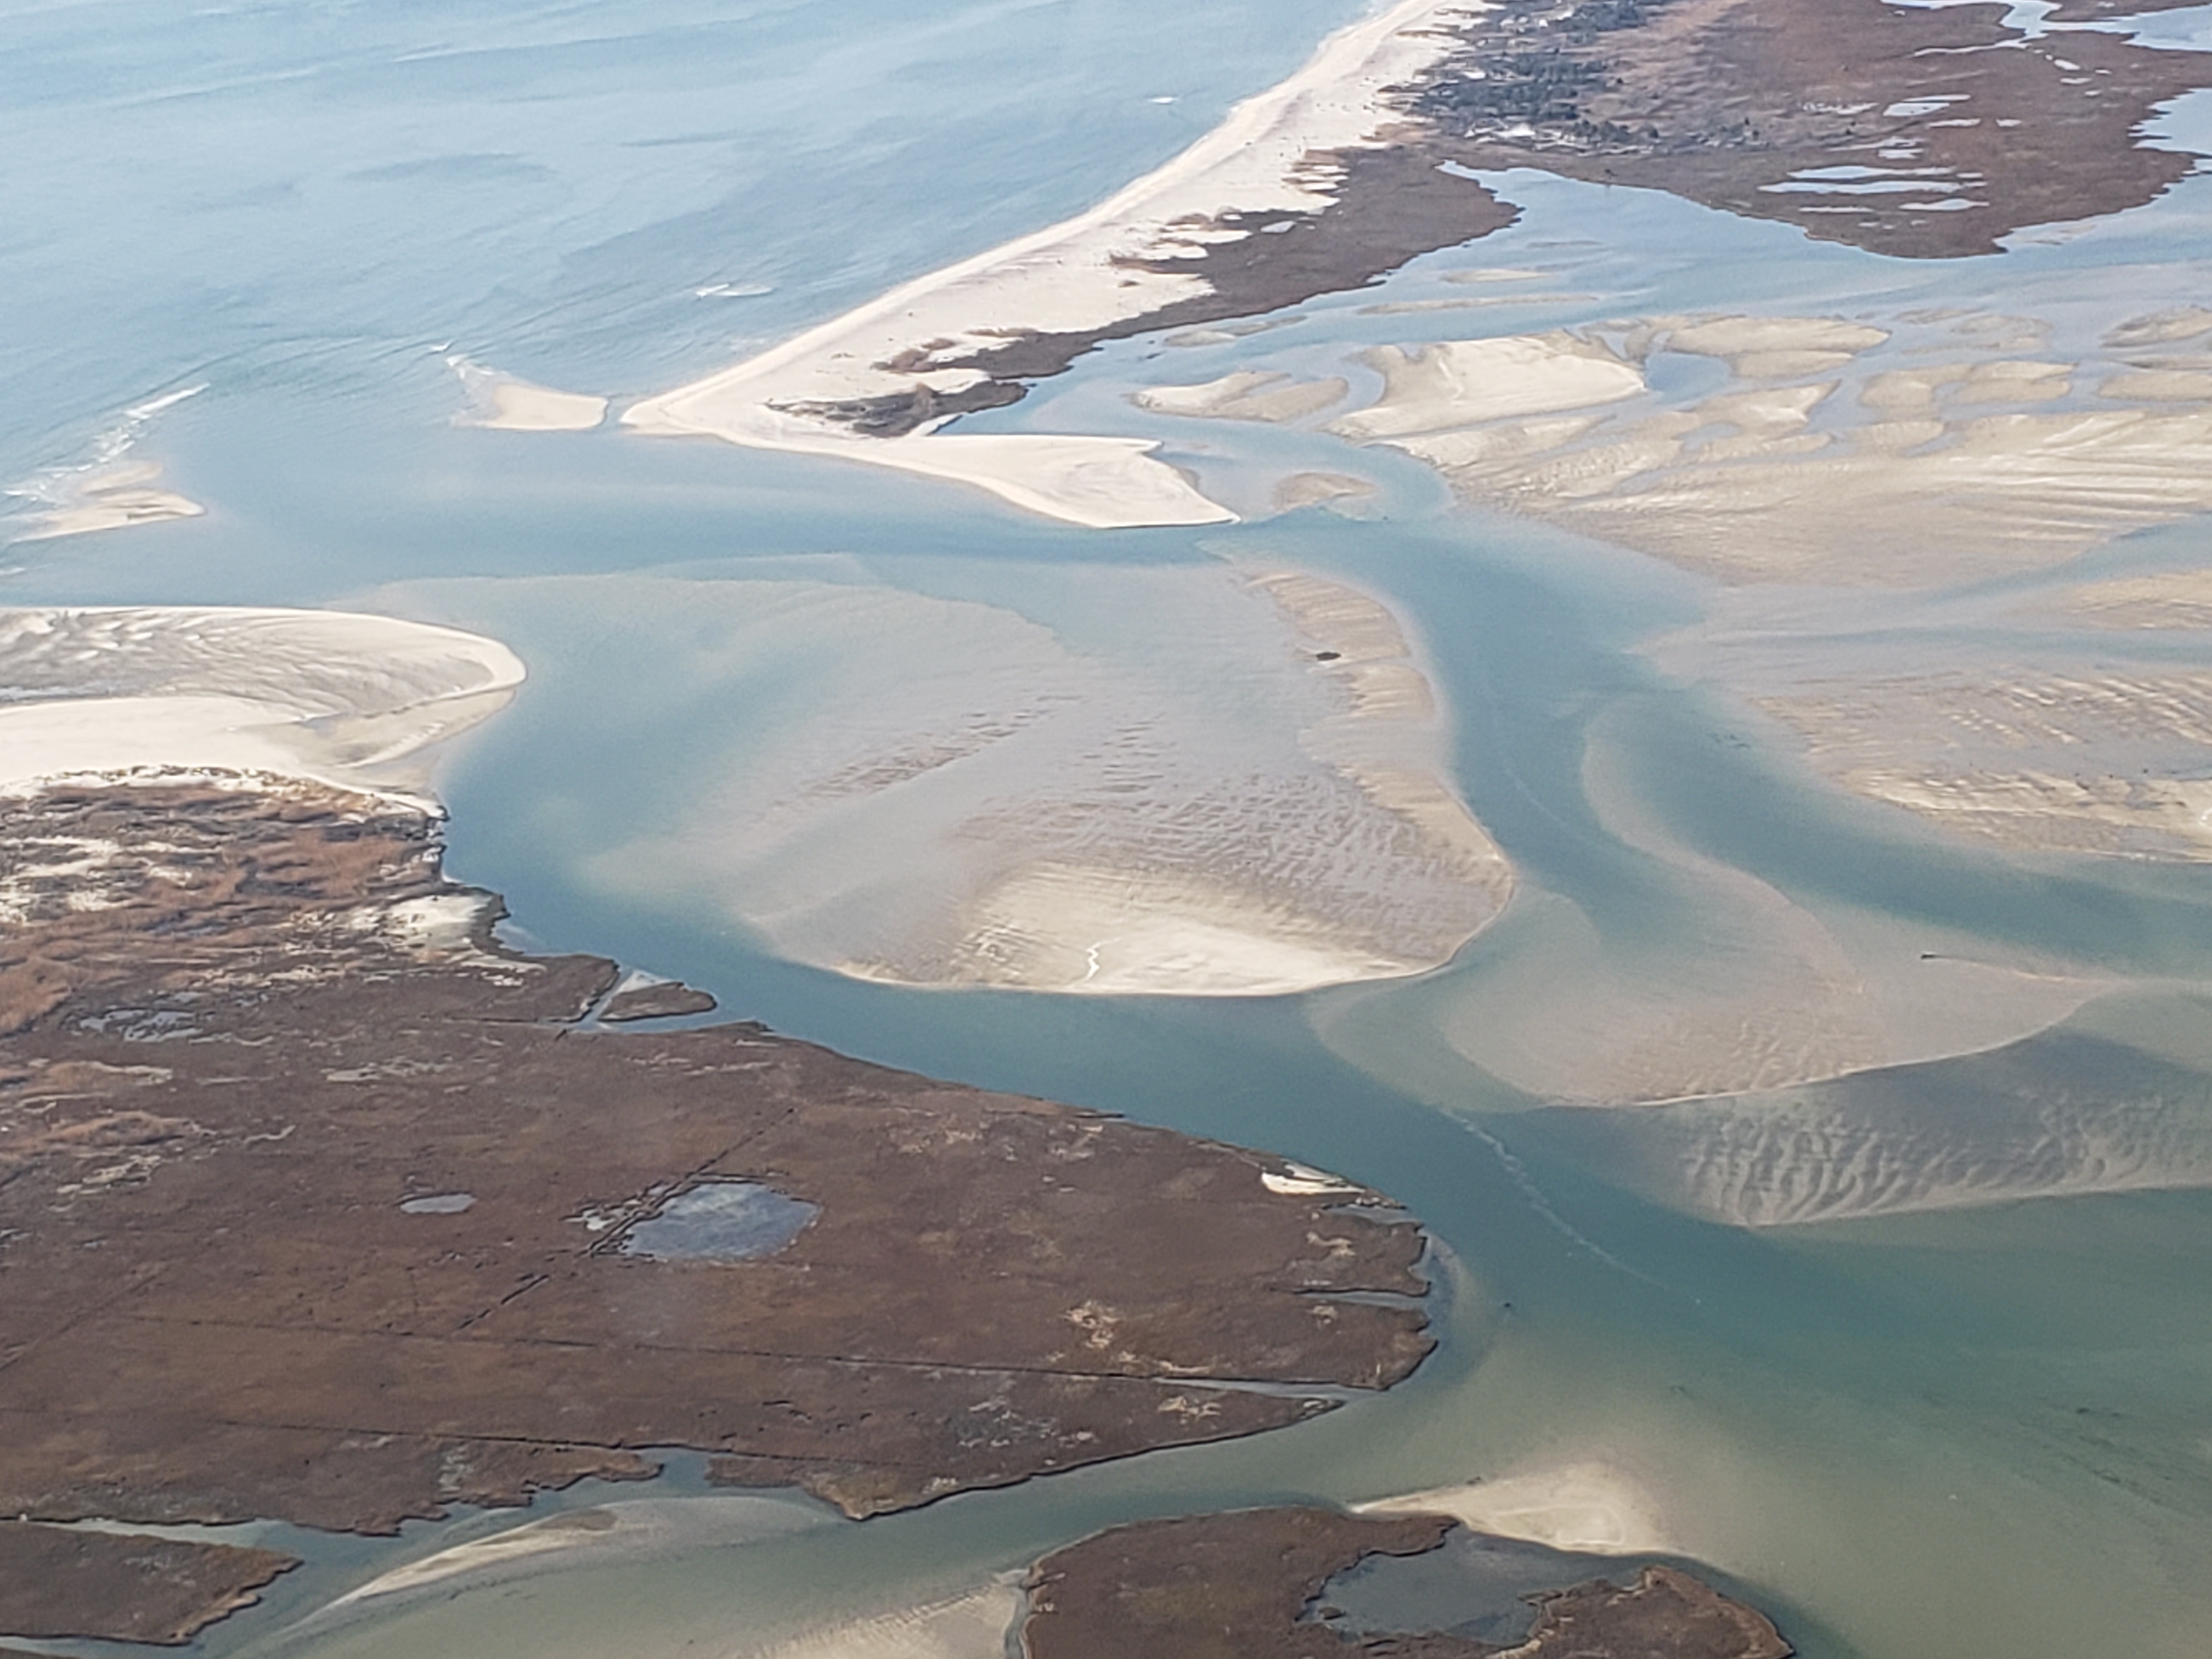 |
||||
Jan 22, 2020 (CF)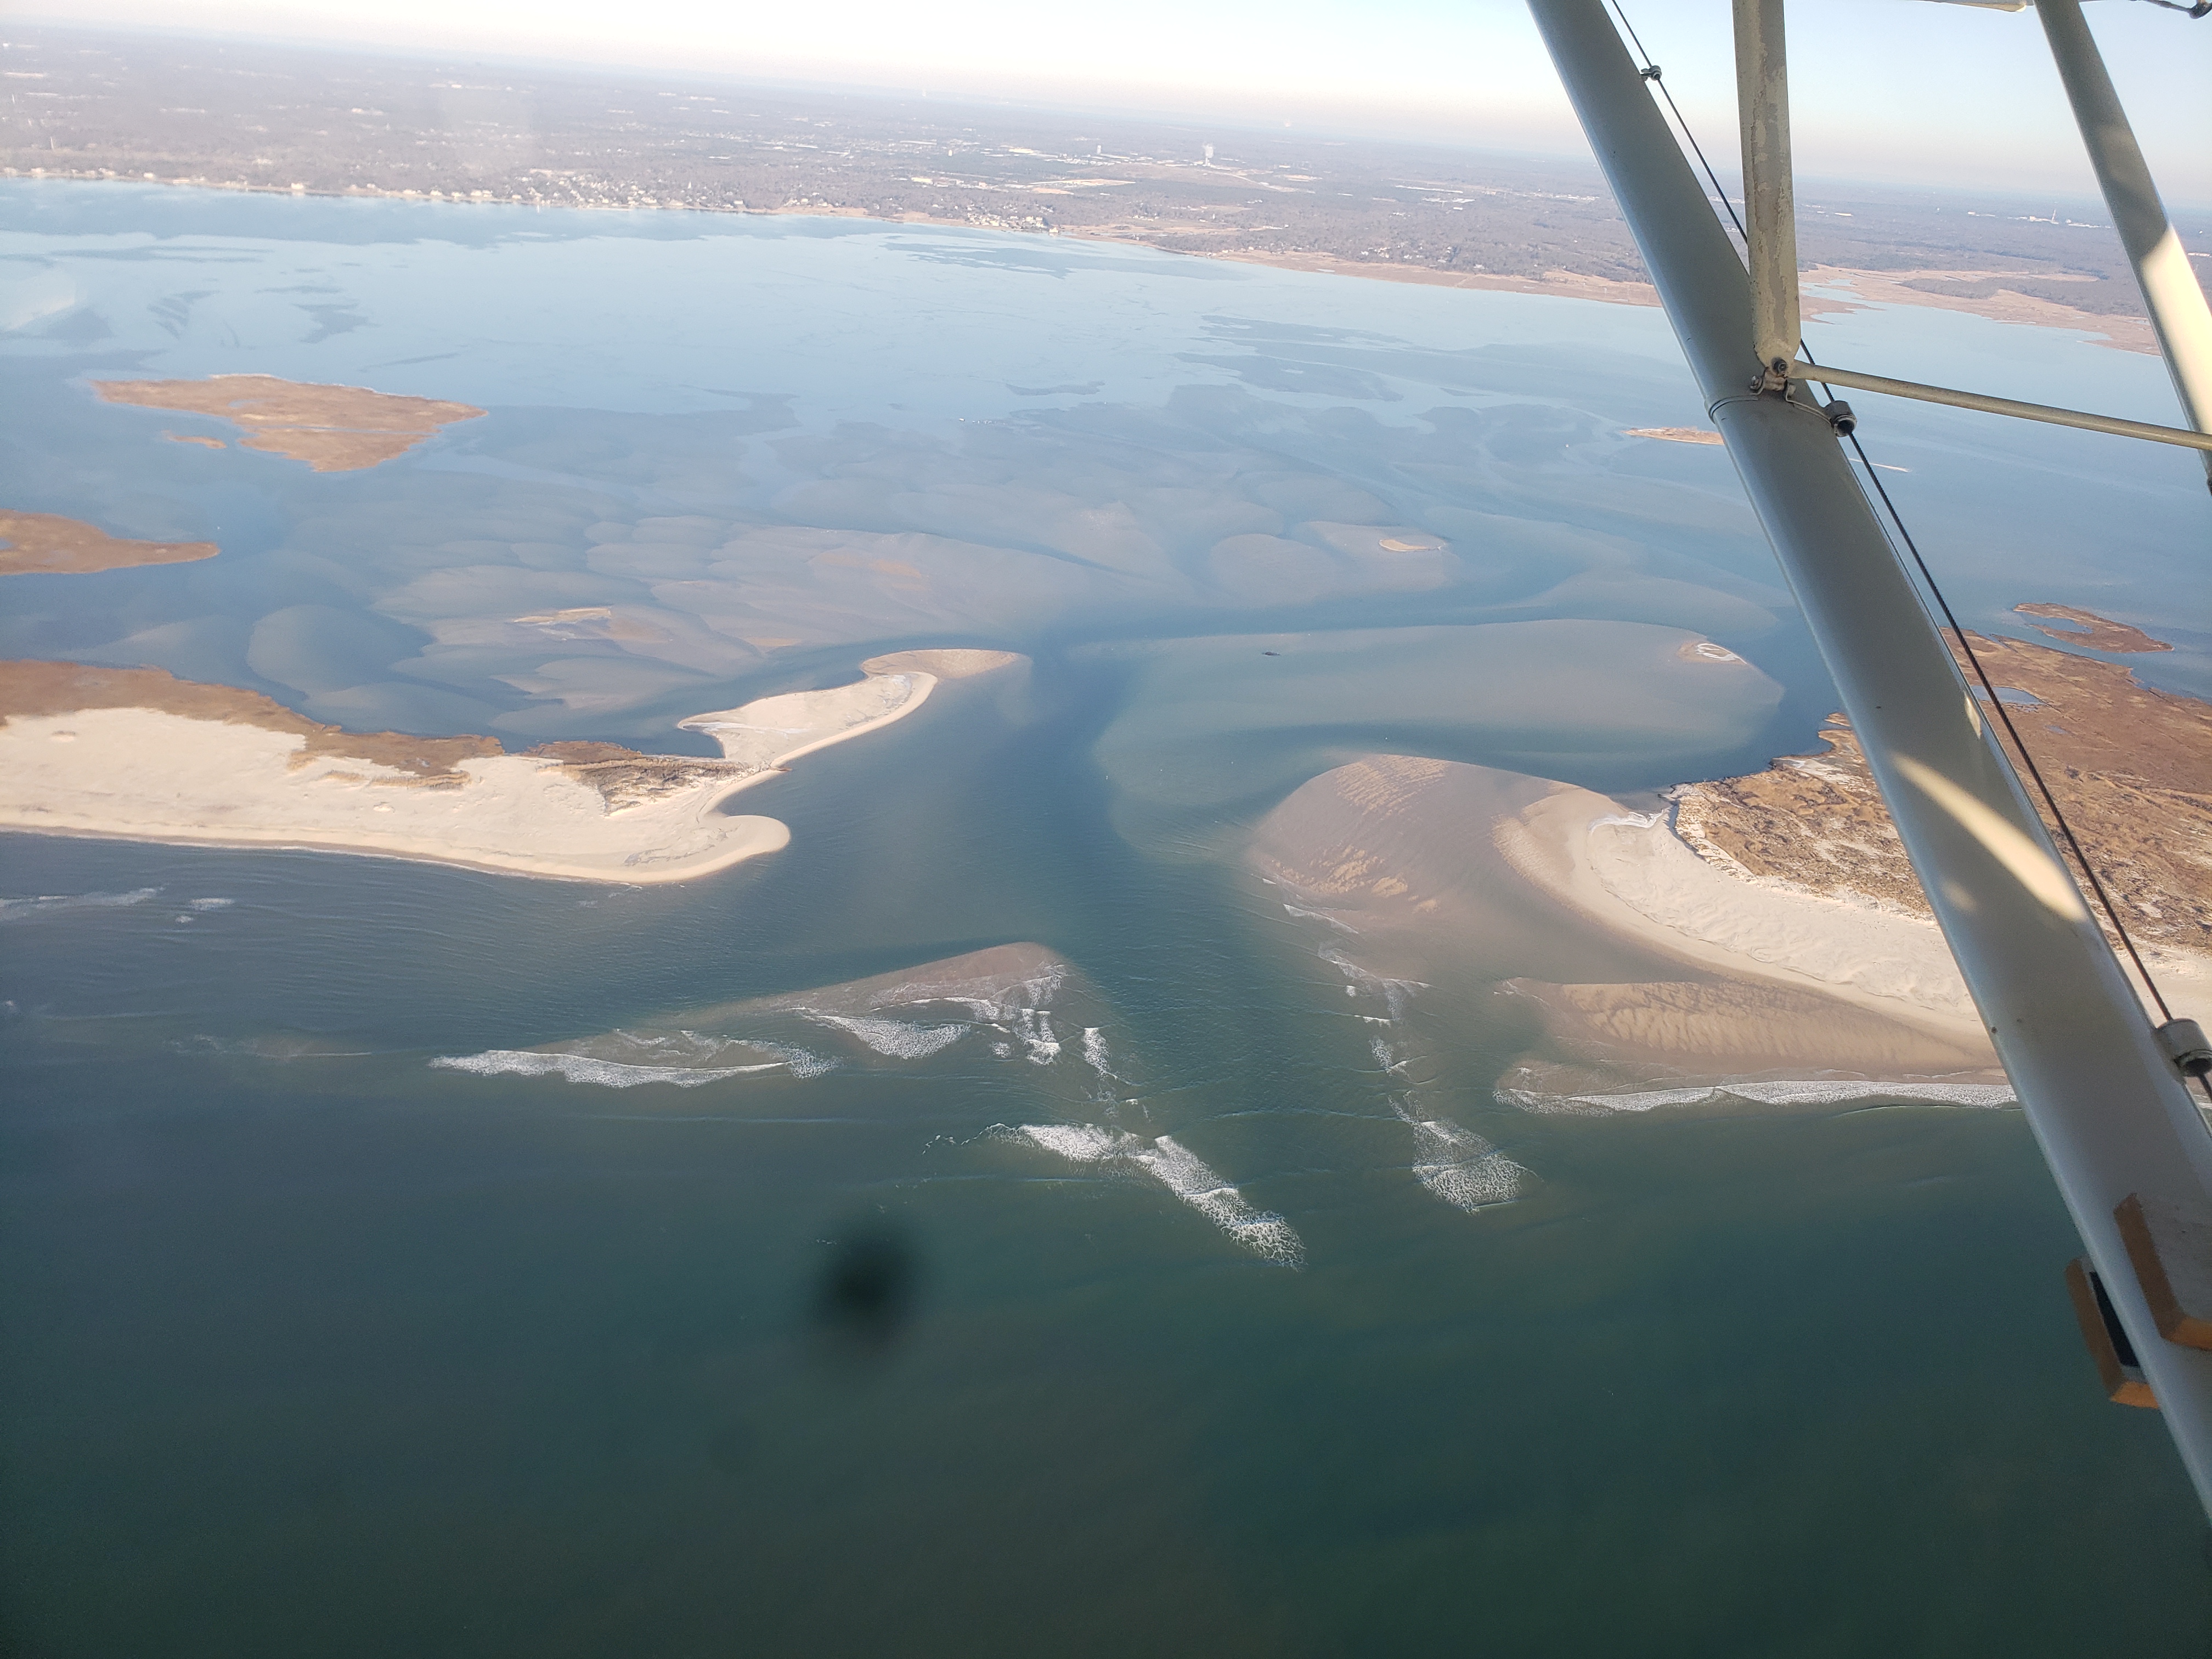 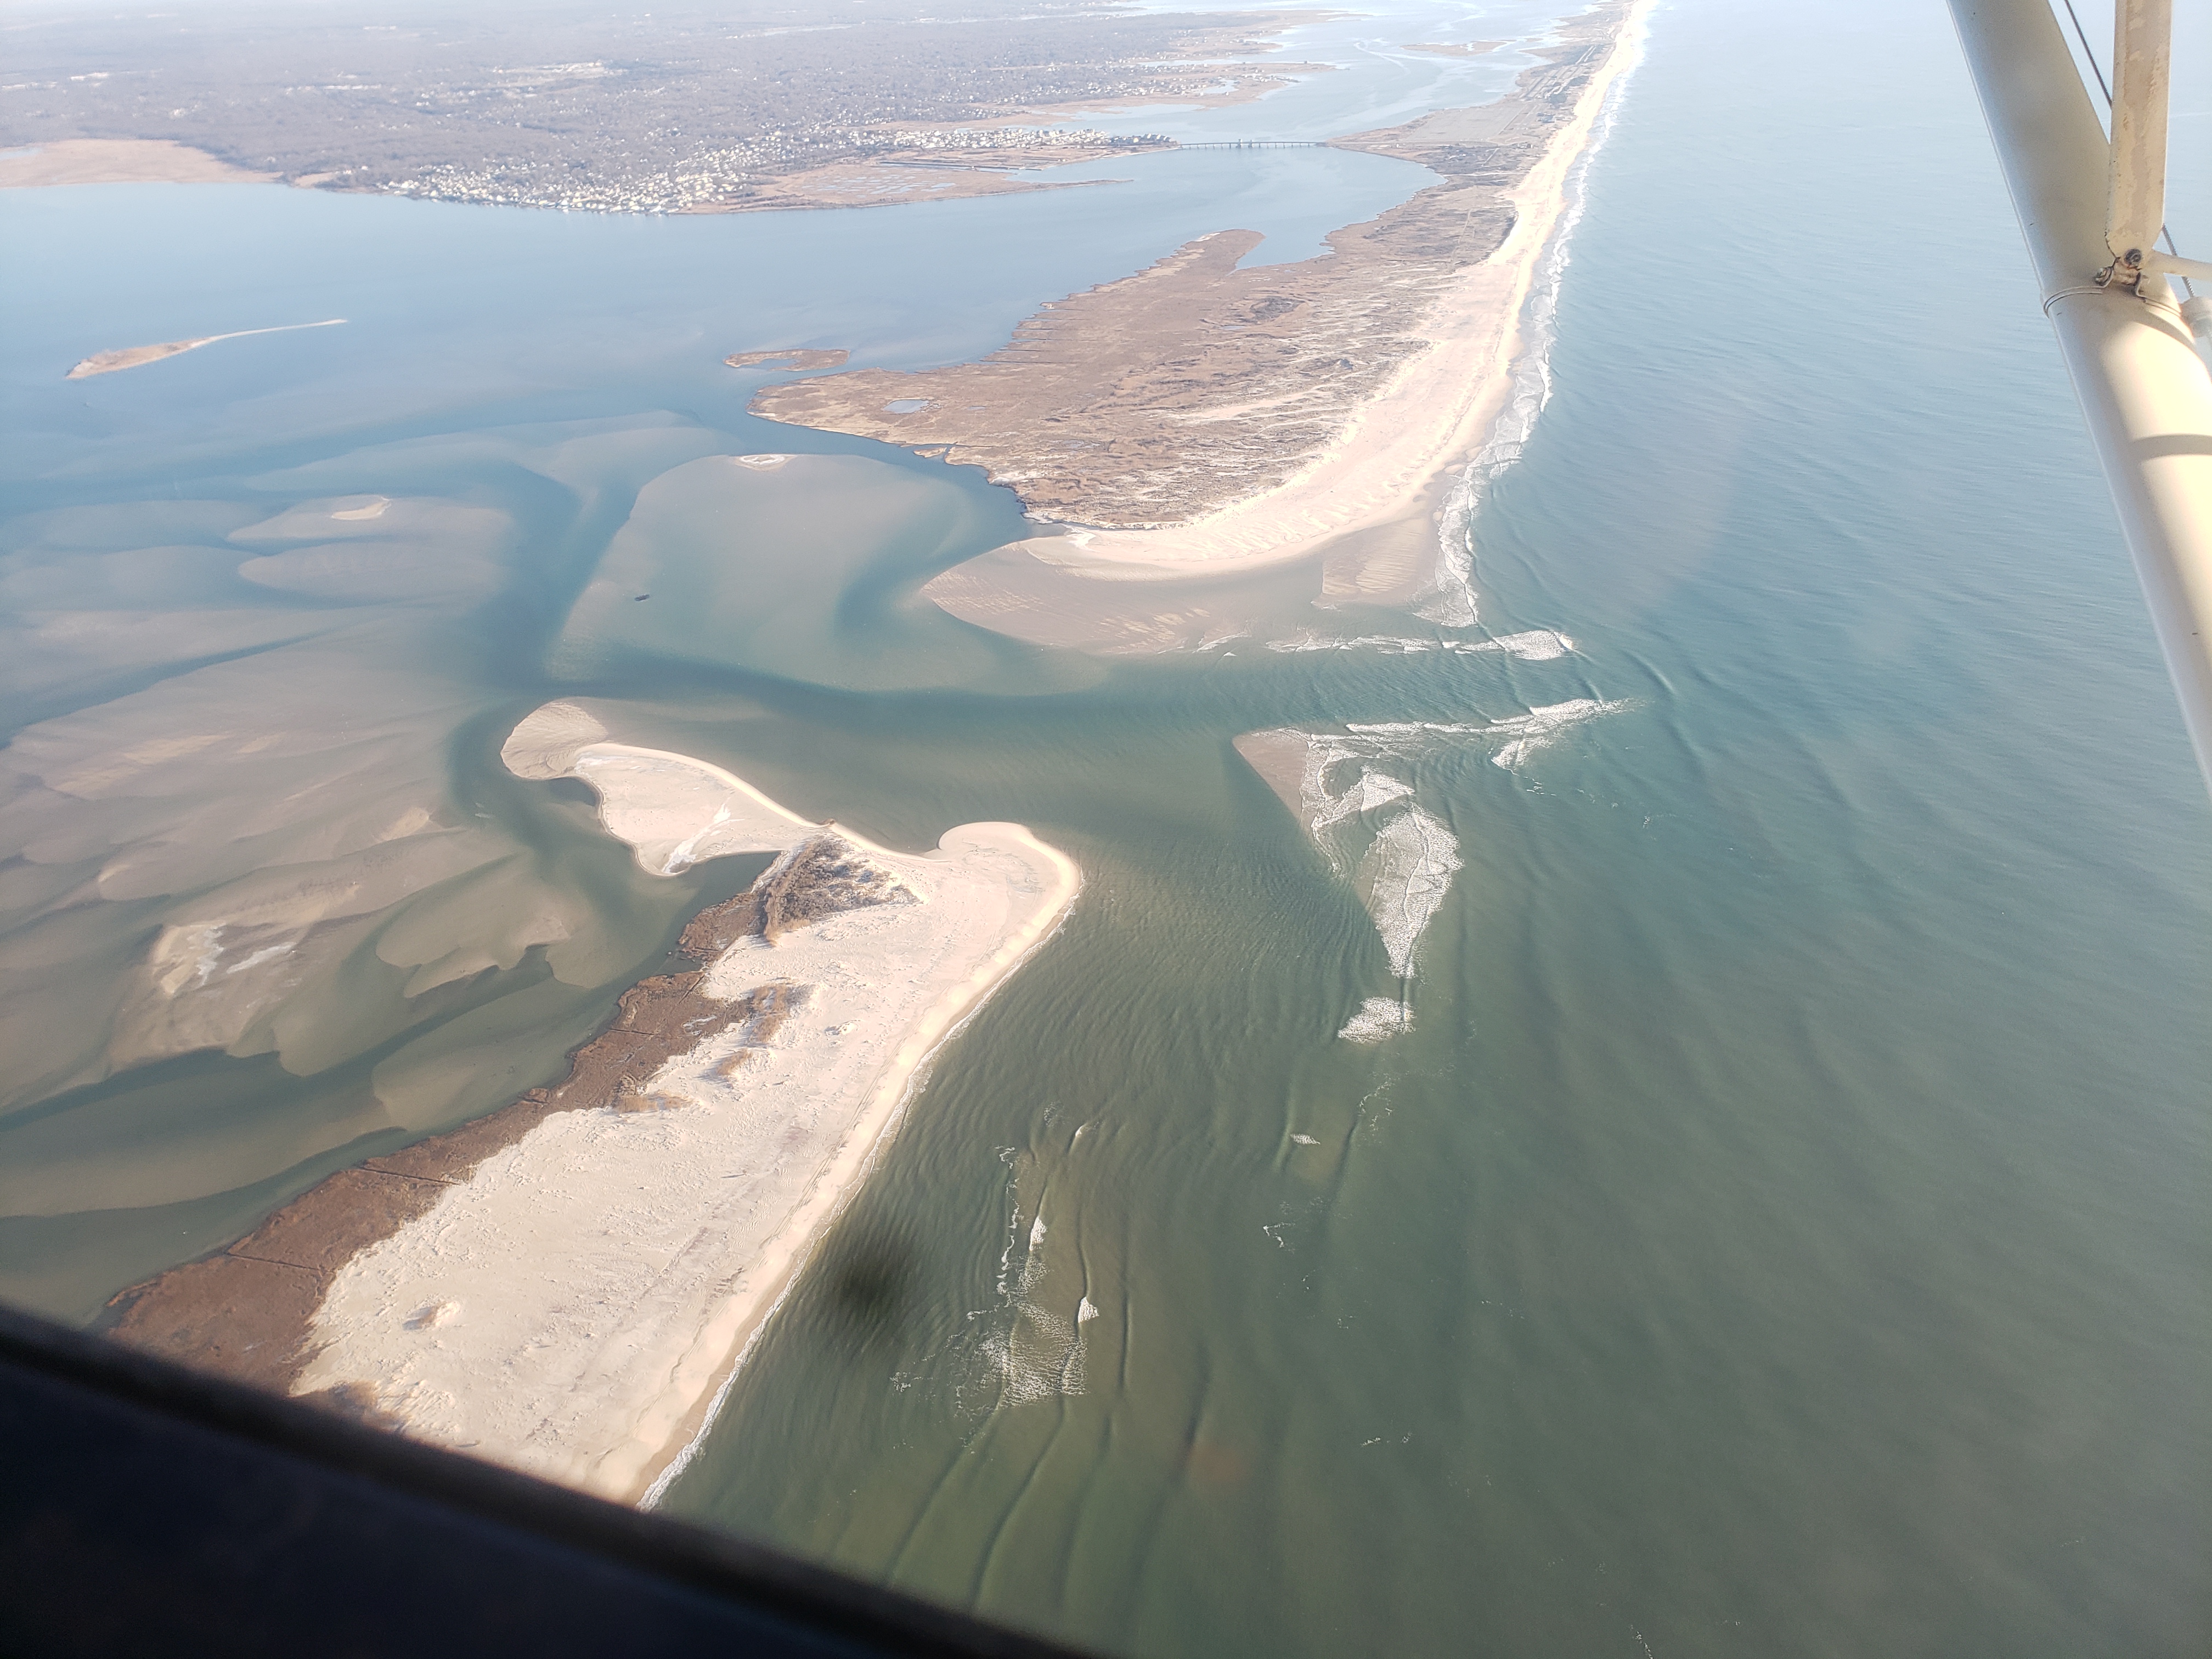 |
Feb 15, 202May0 (CF)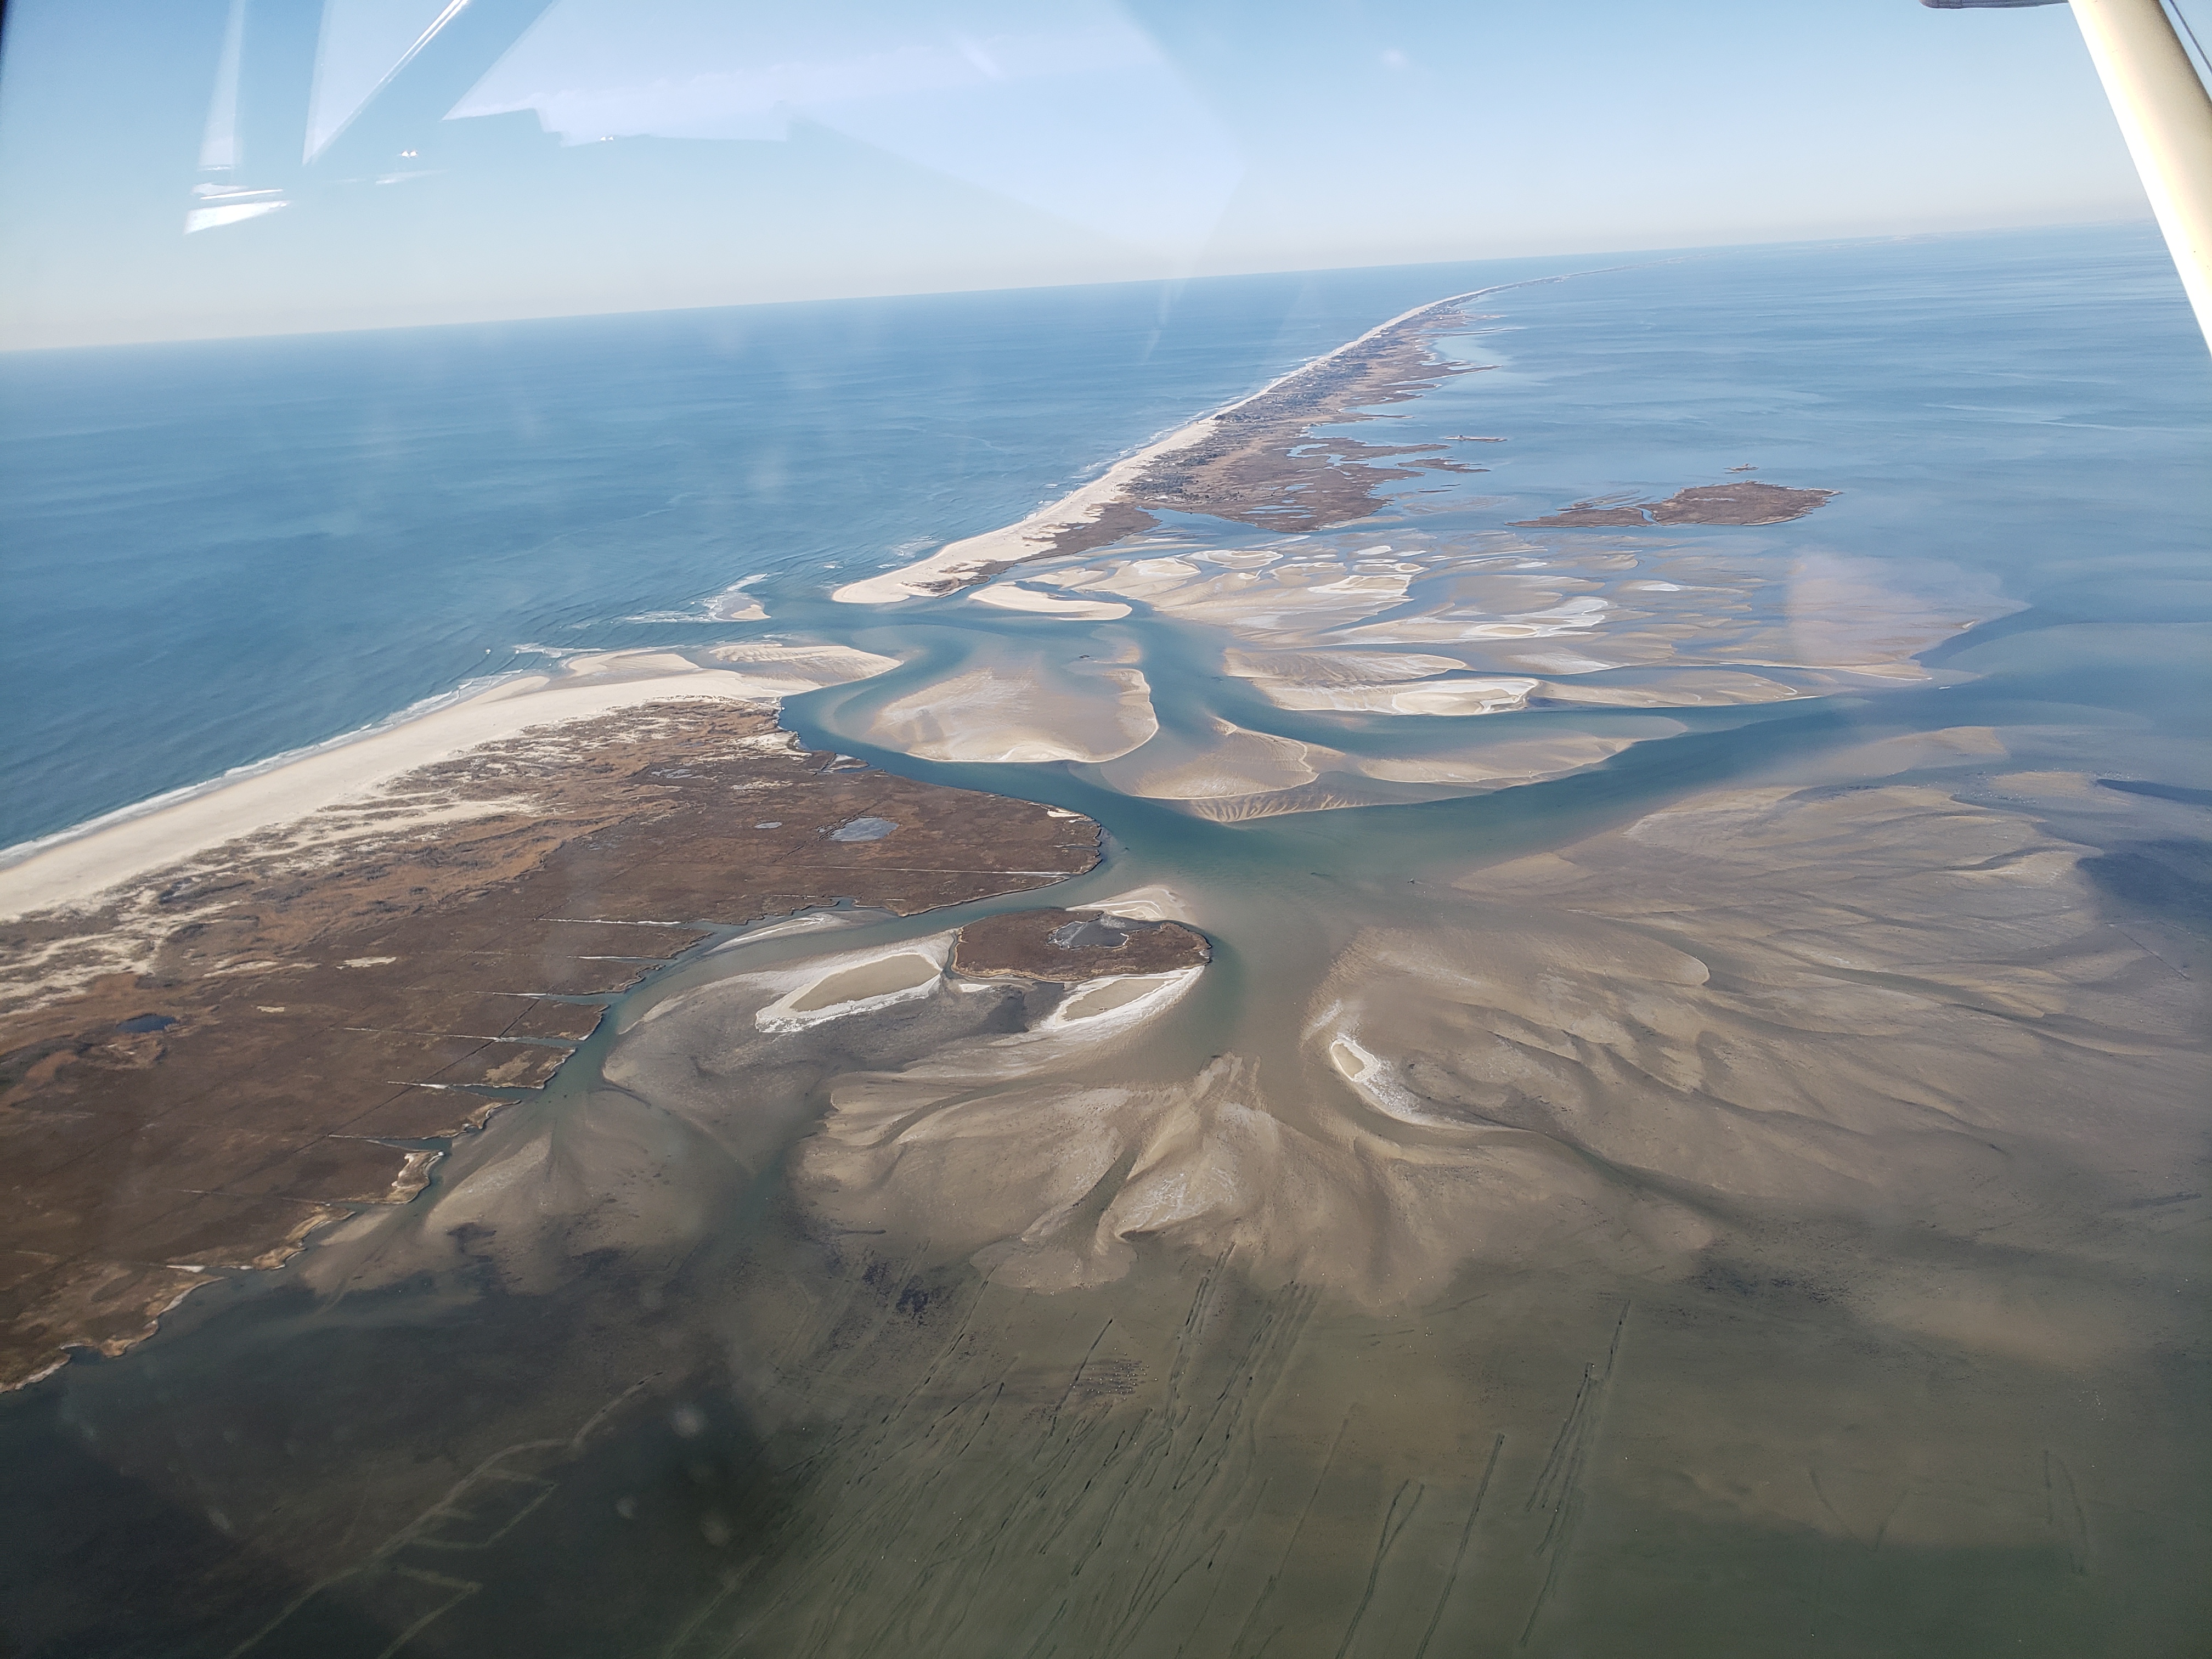 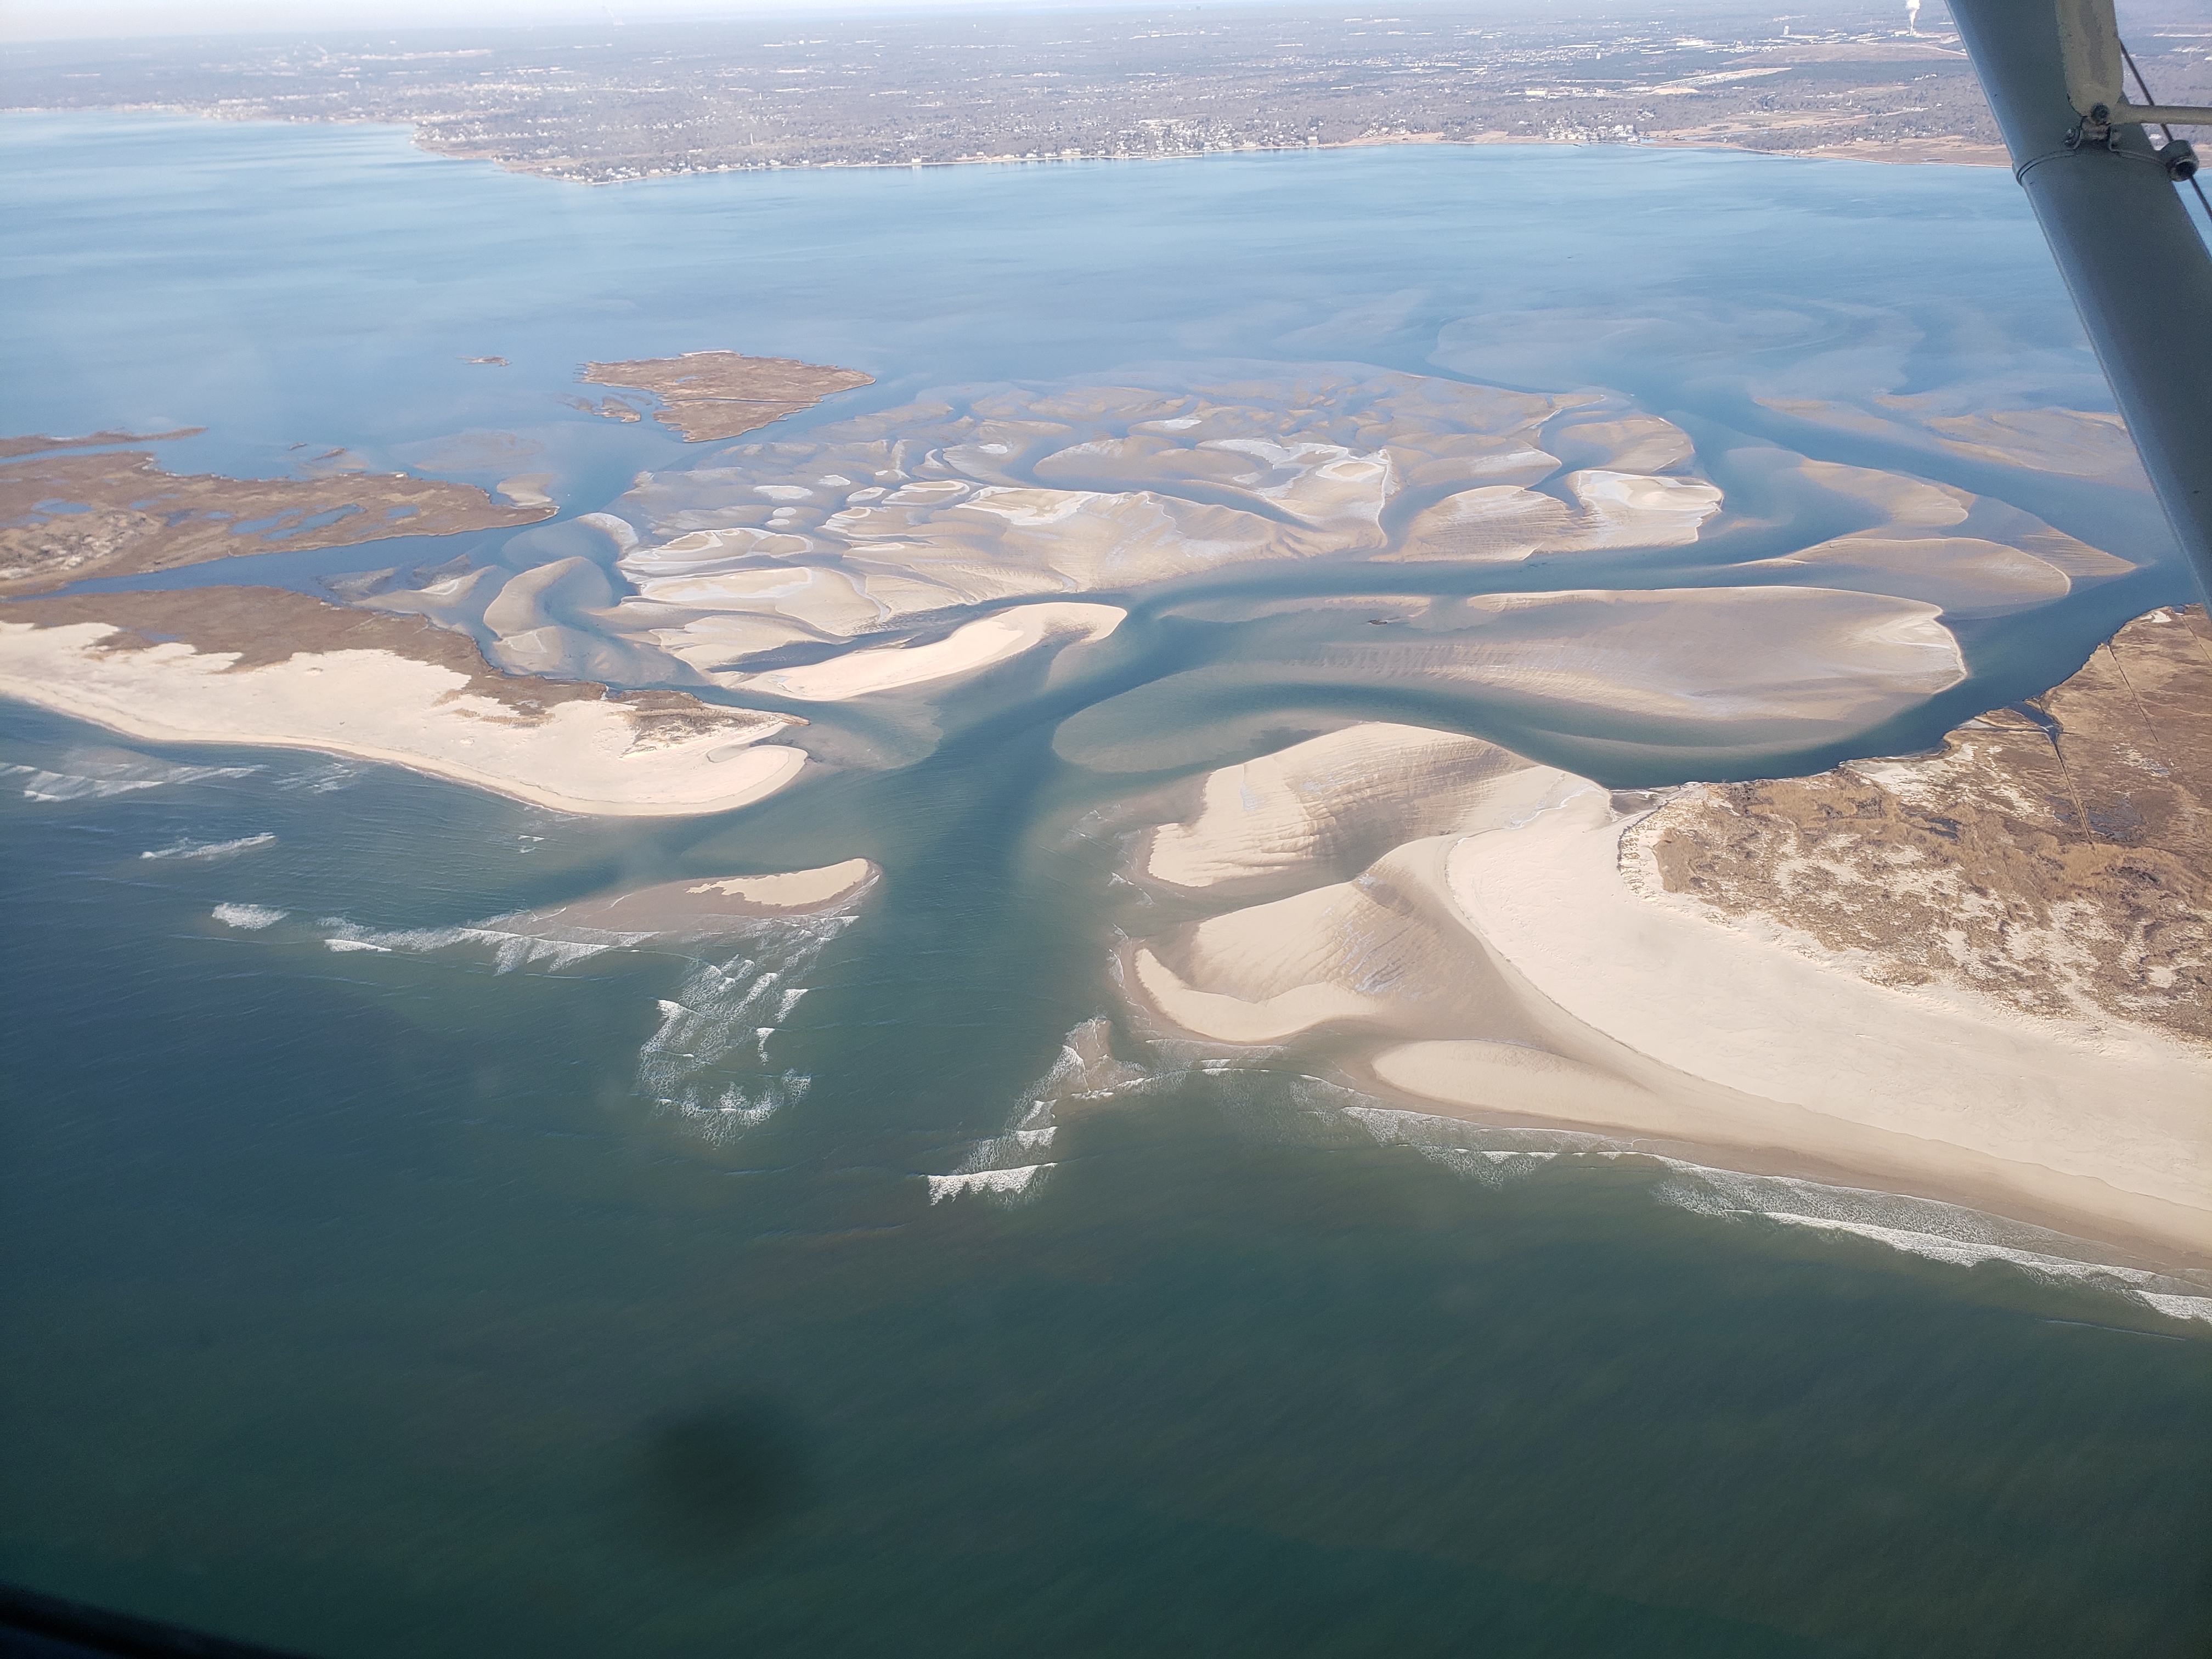 |
Feb 15, 2020 (CF)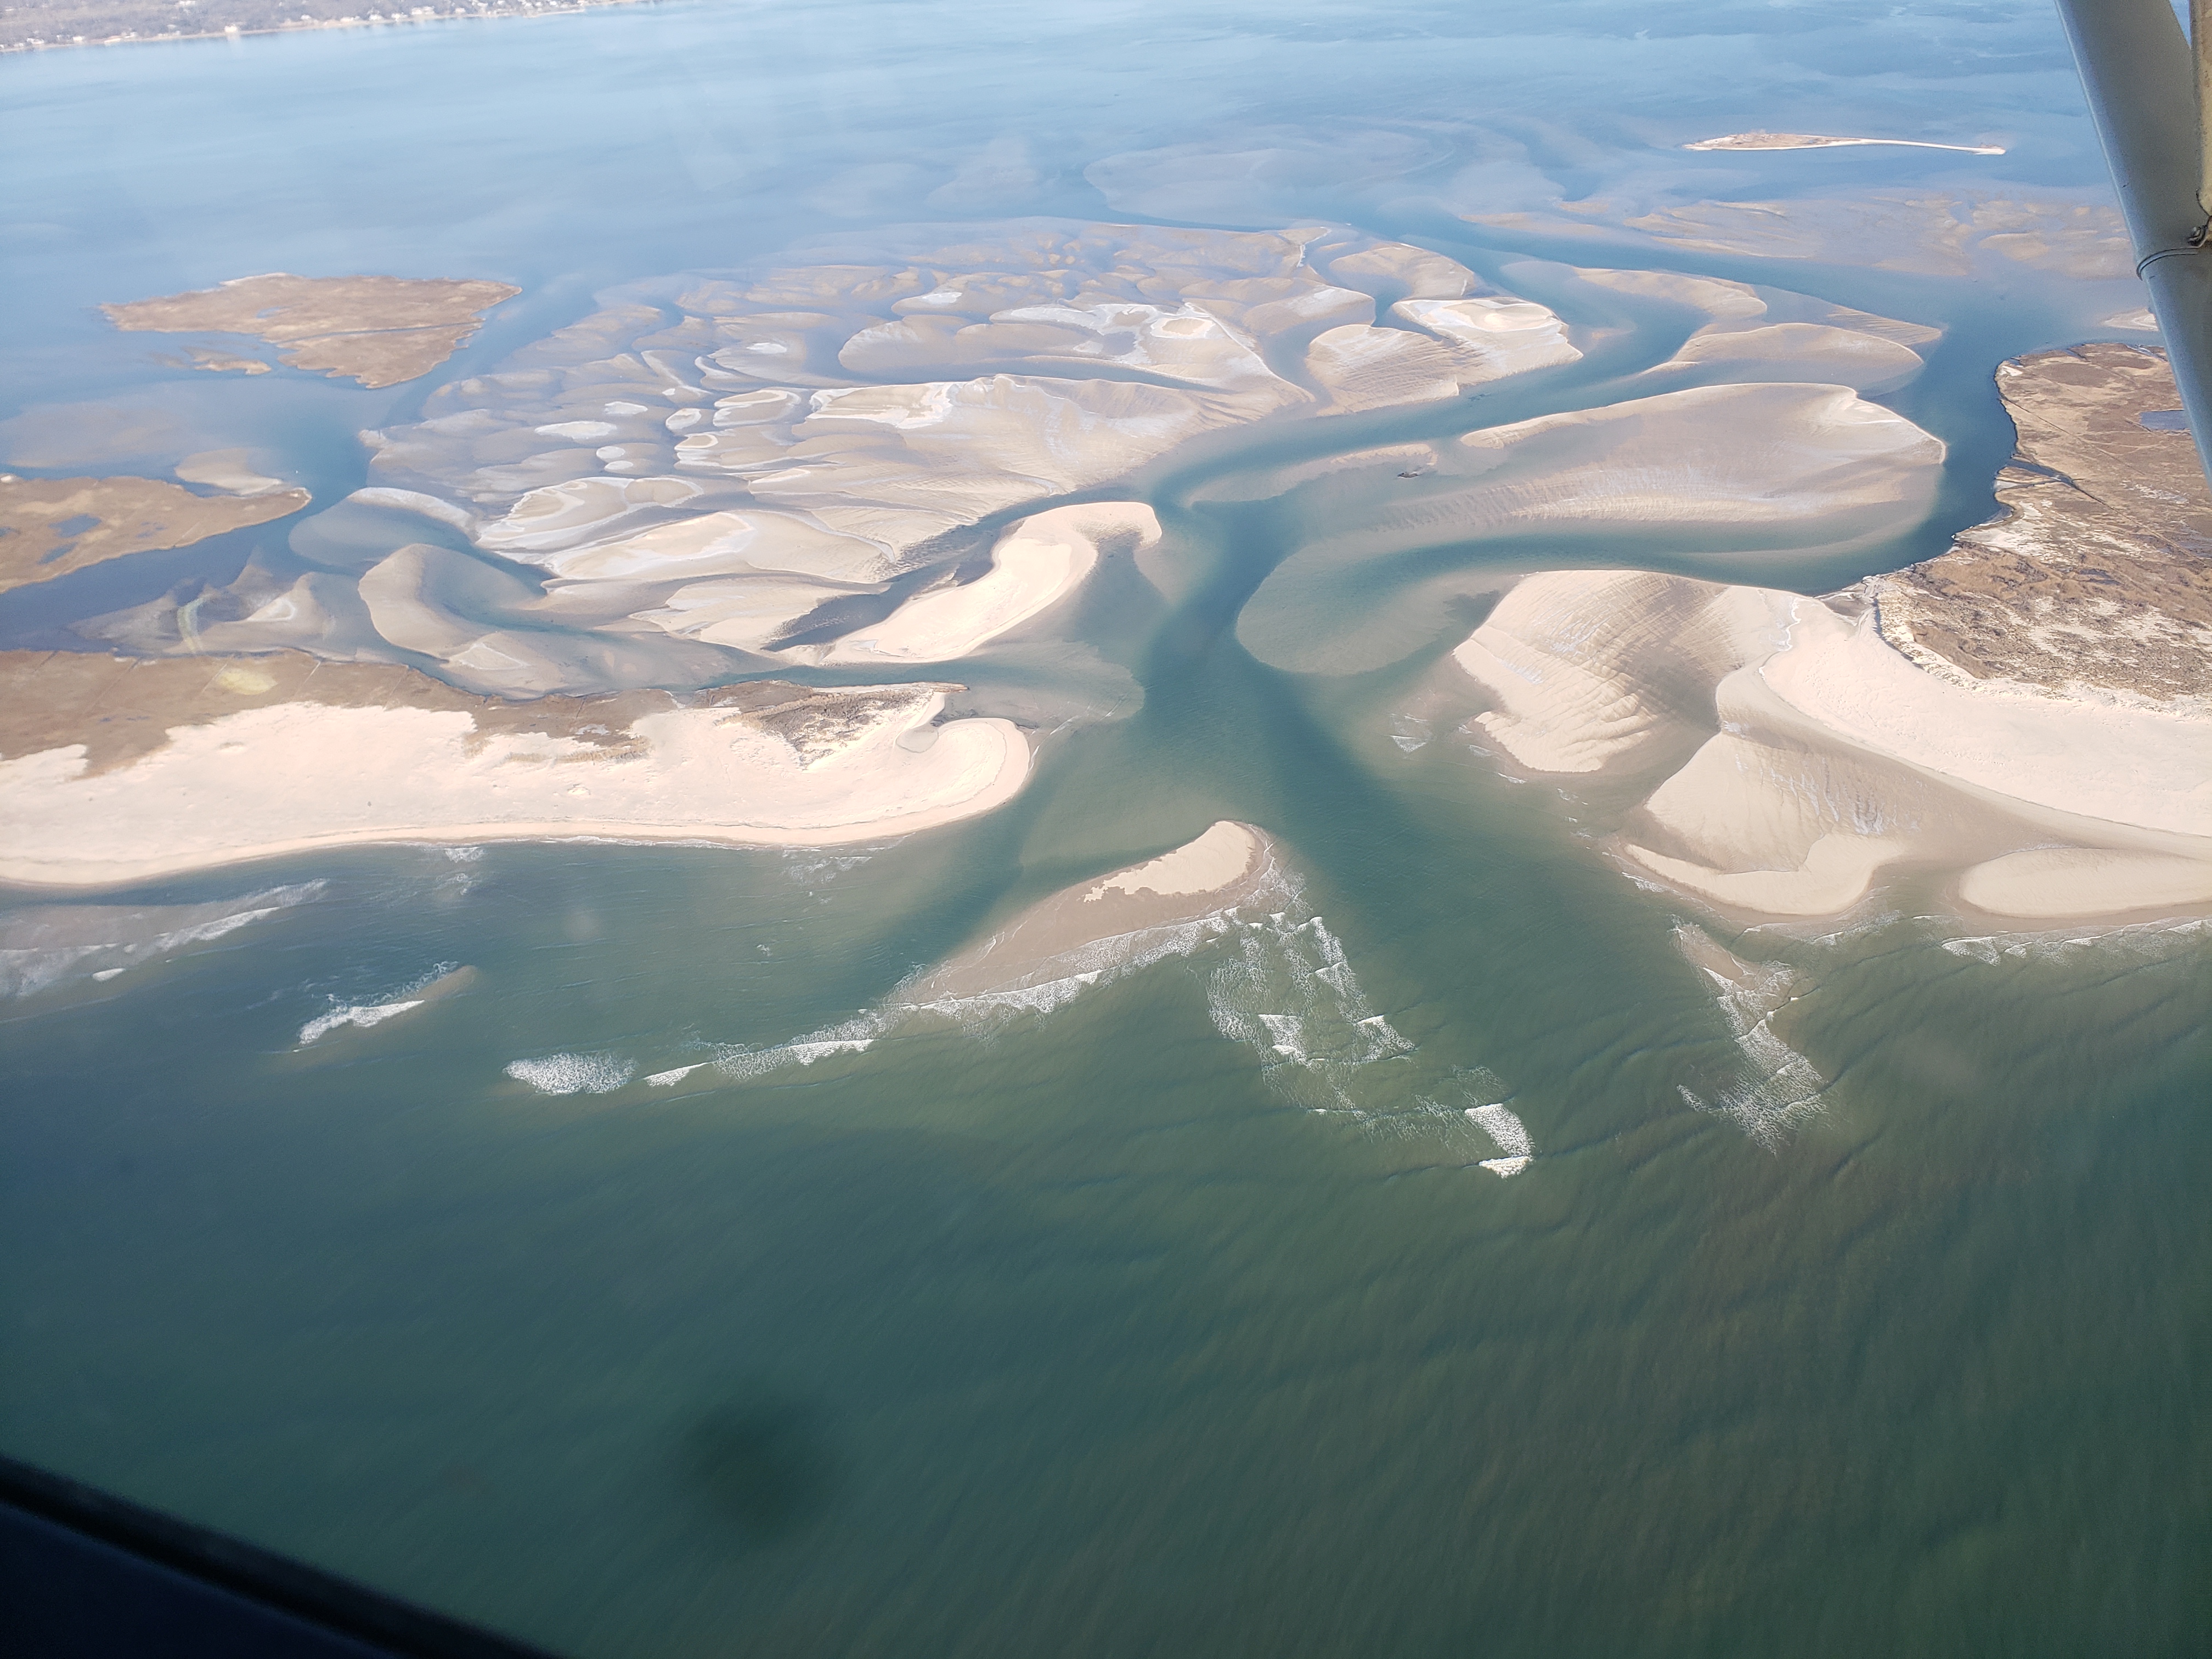  |
Apr 30, 2020 (JV)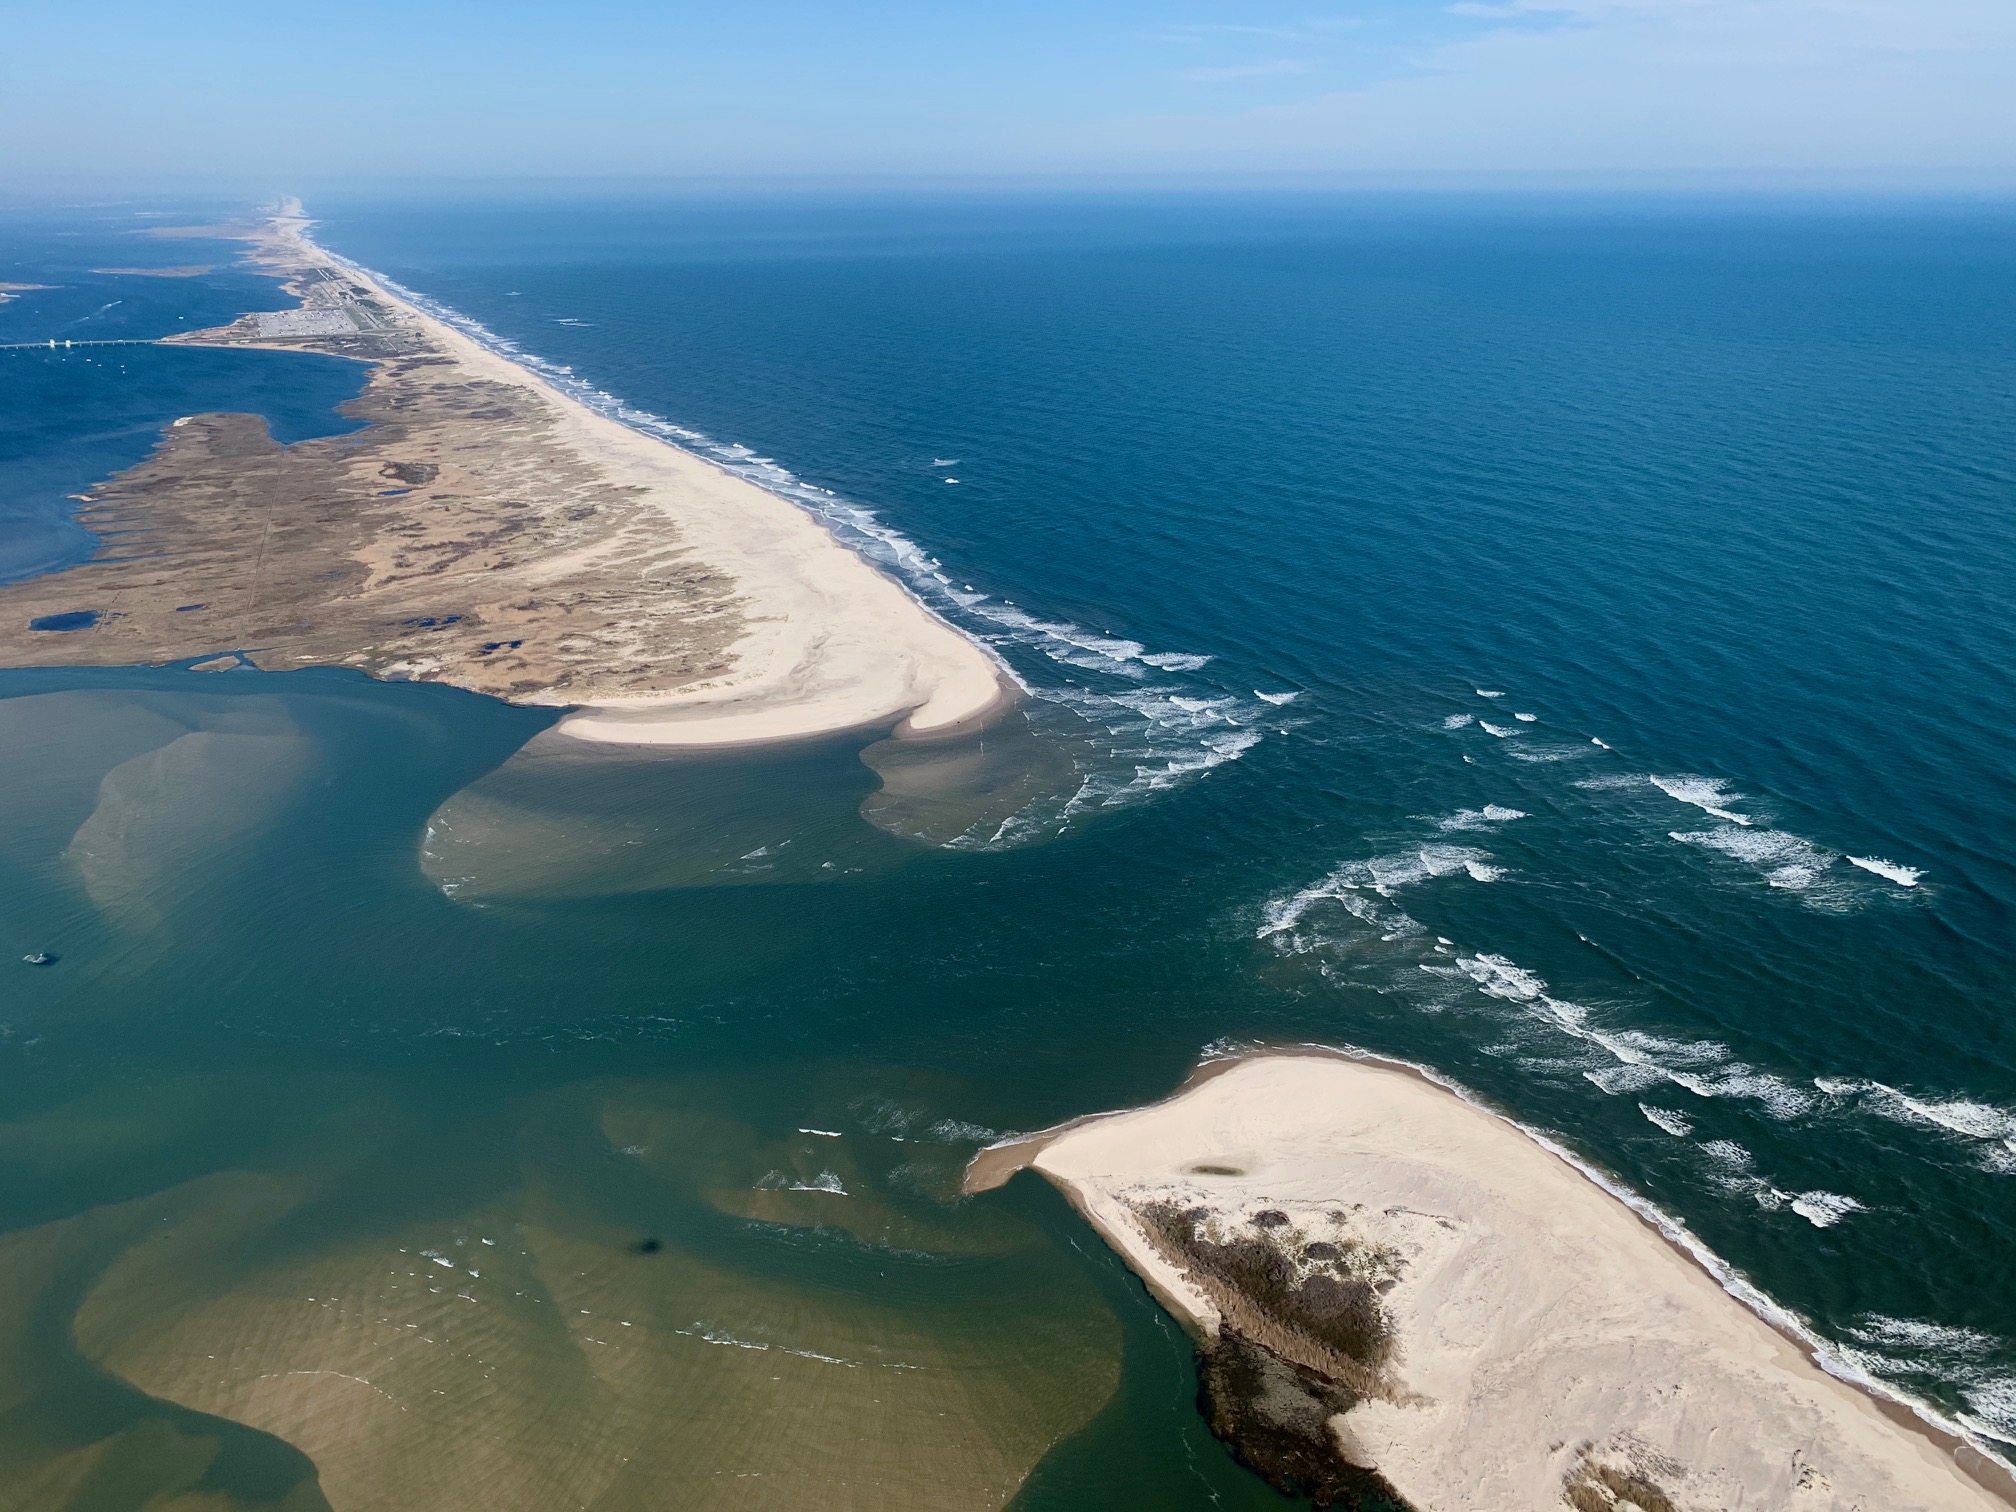 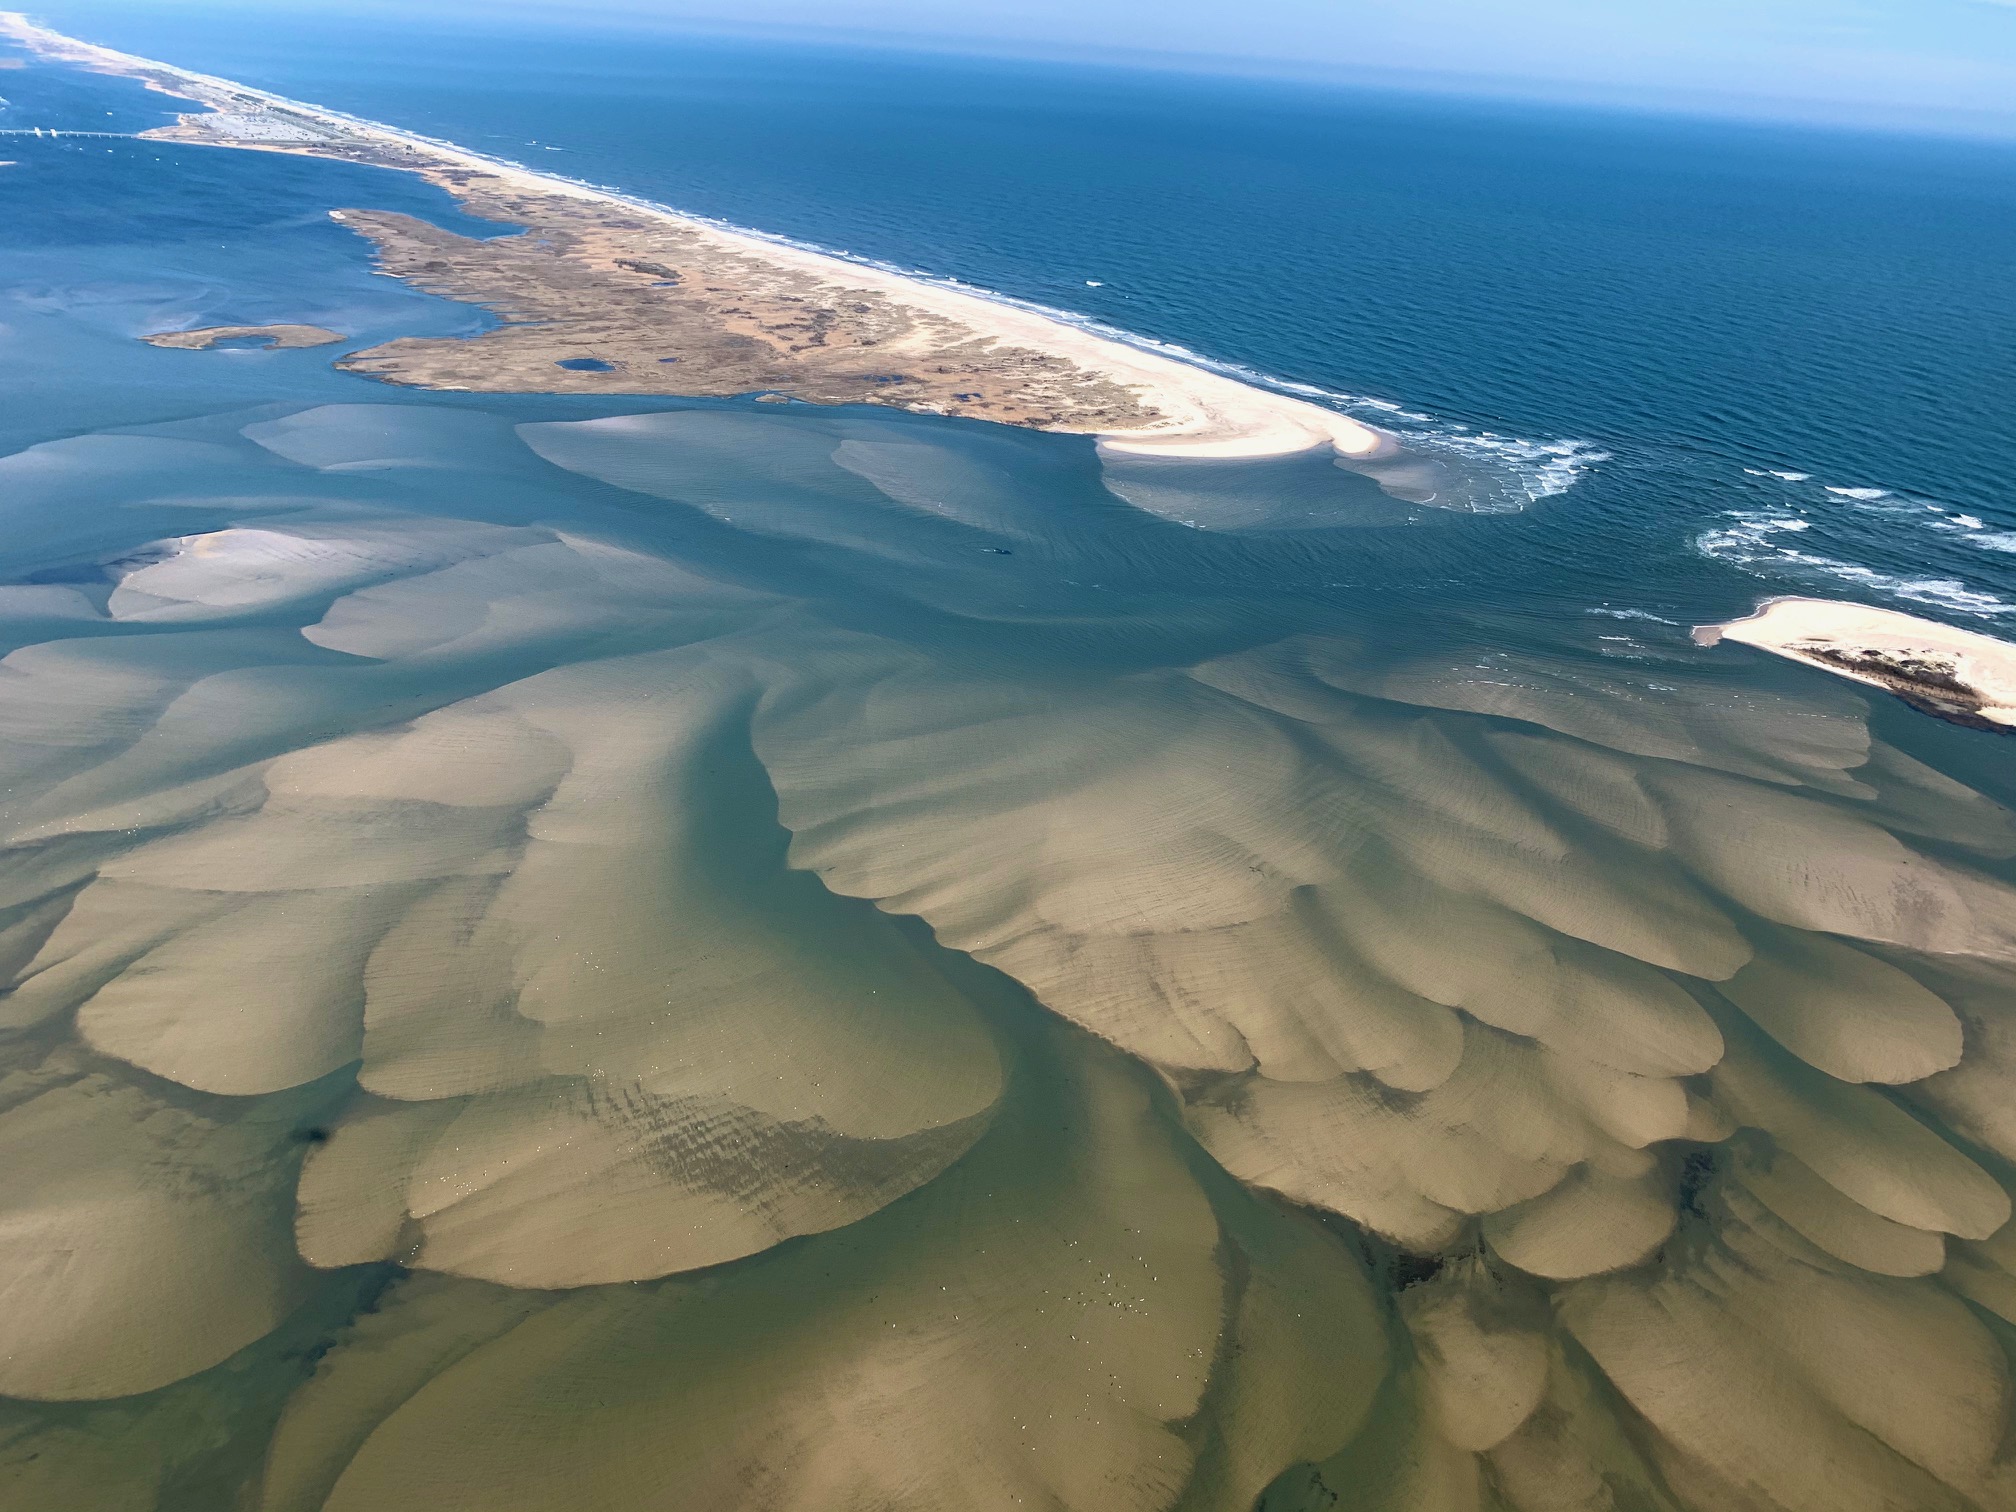 |
||||
May 7, 2020 (CF @ 6500')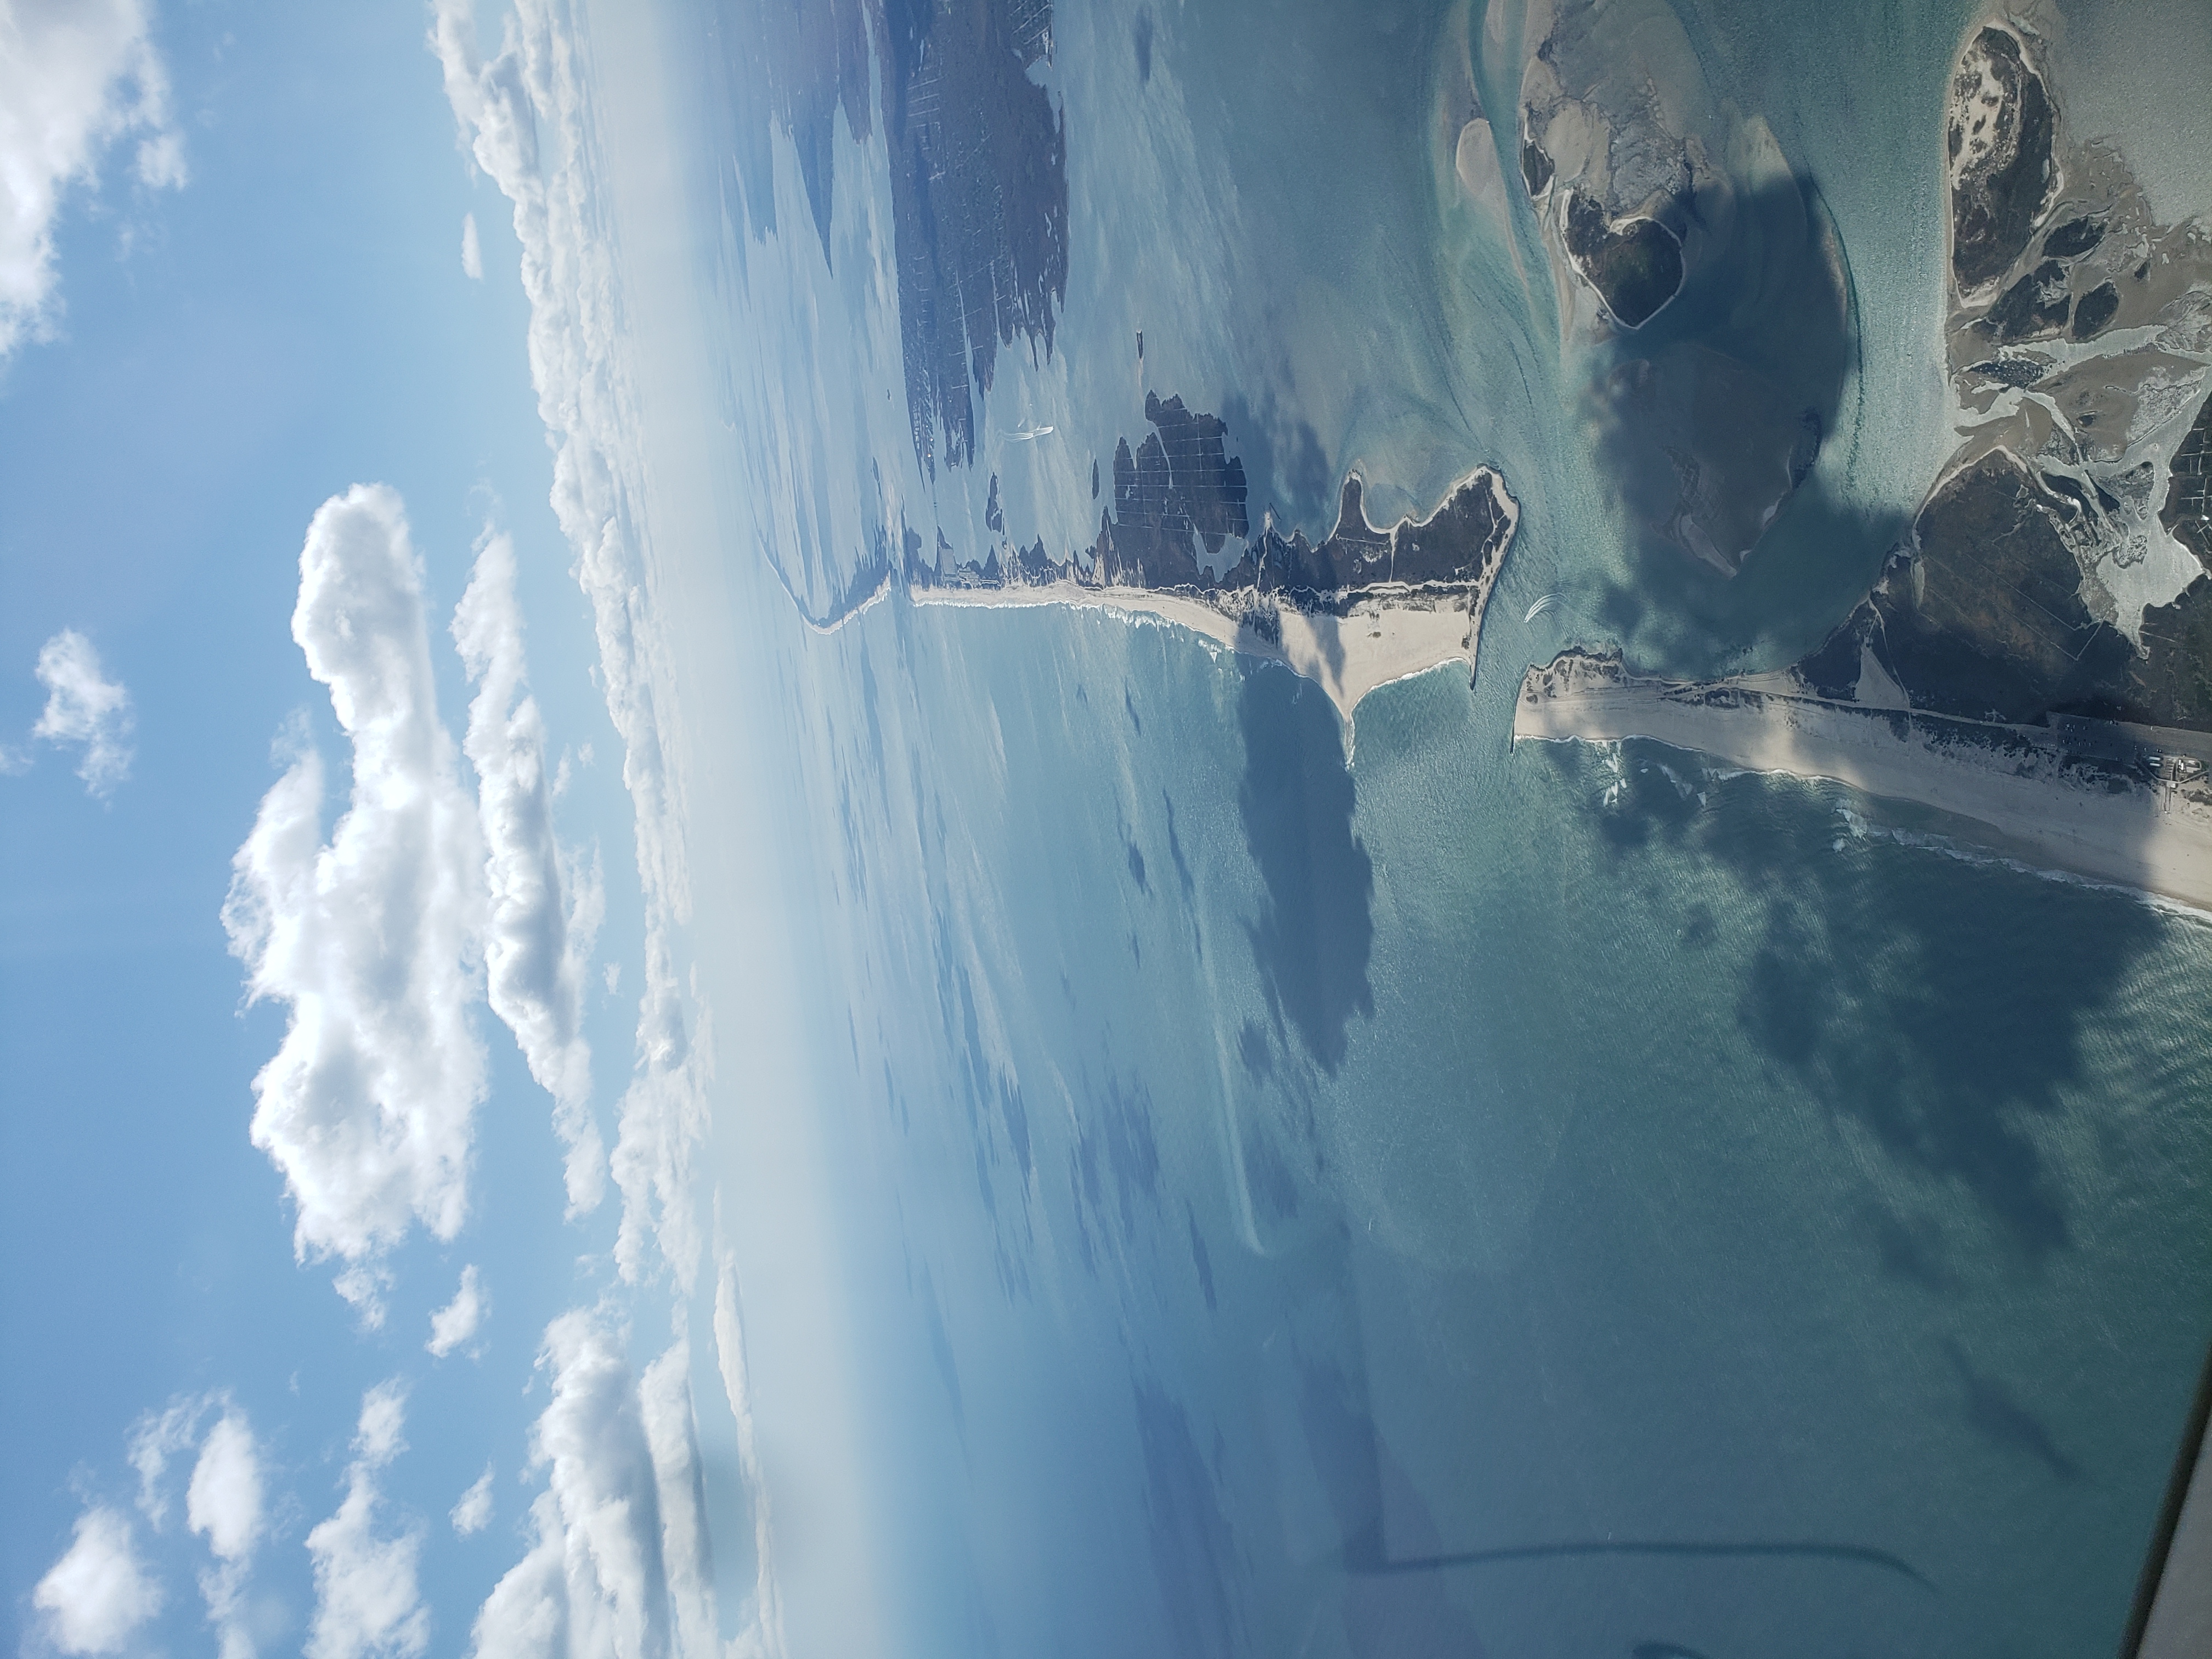  |
June 14 2020 (CF)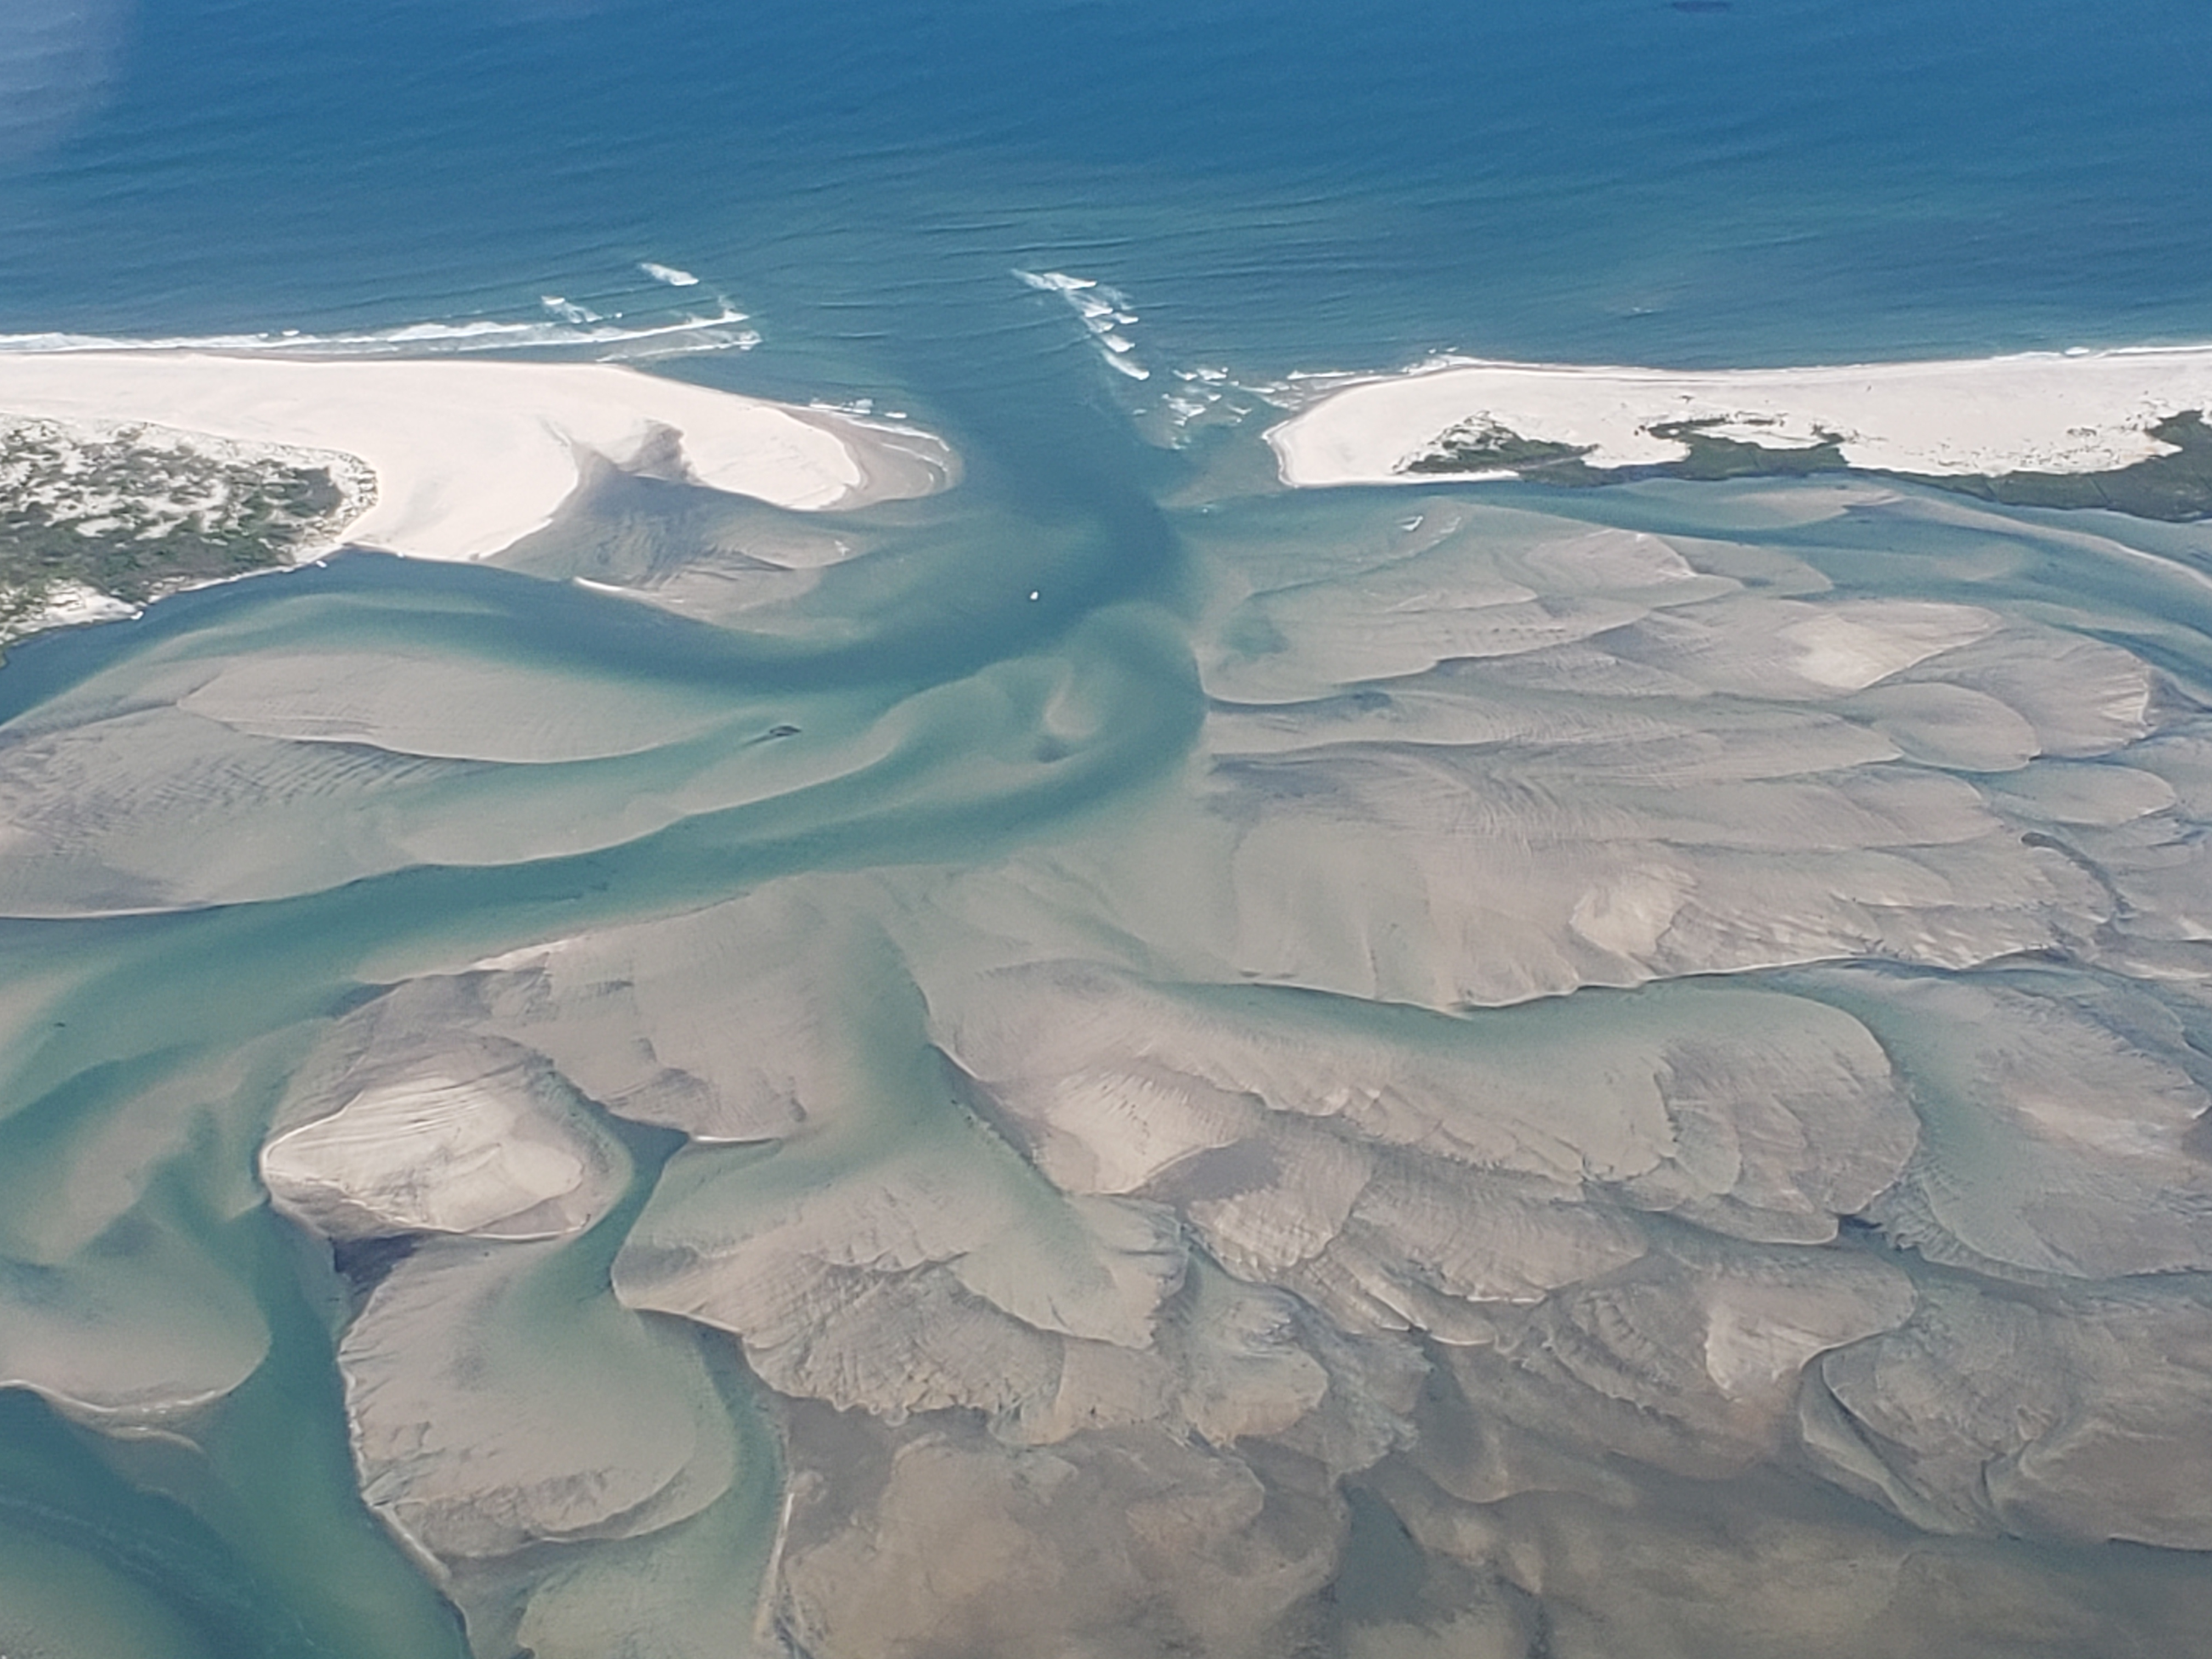 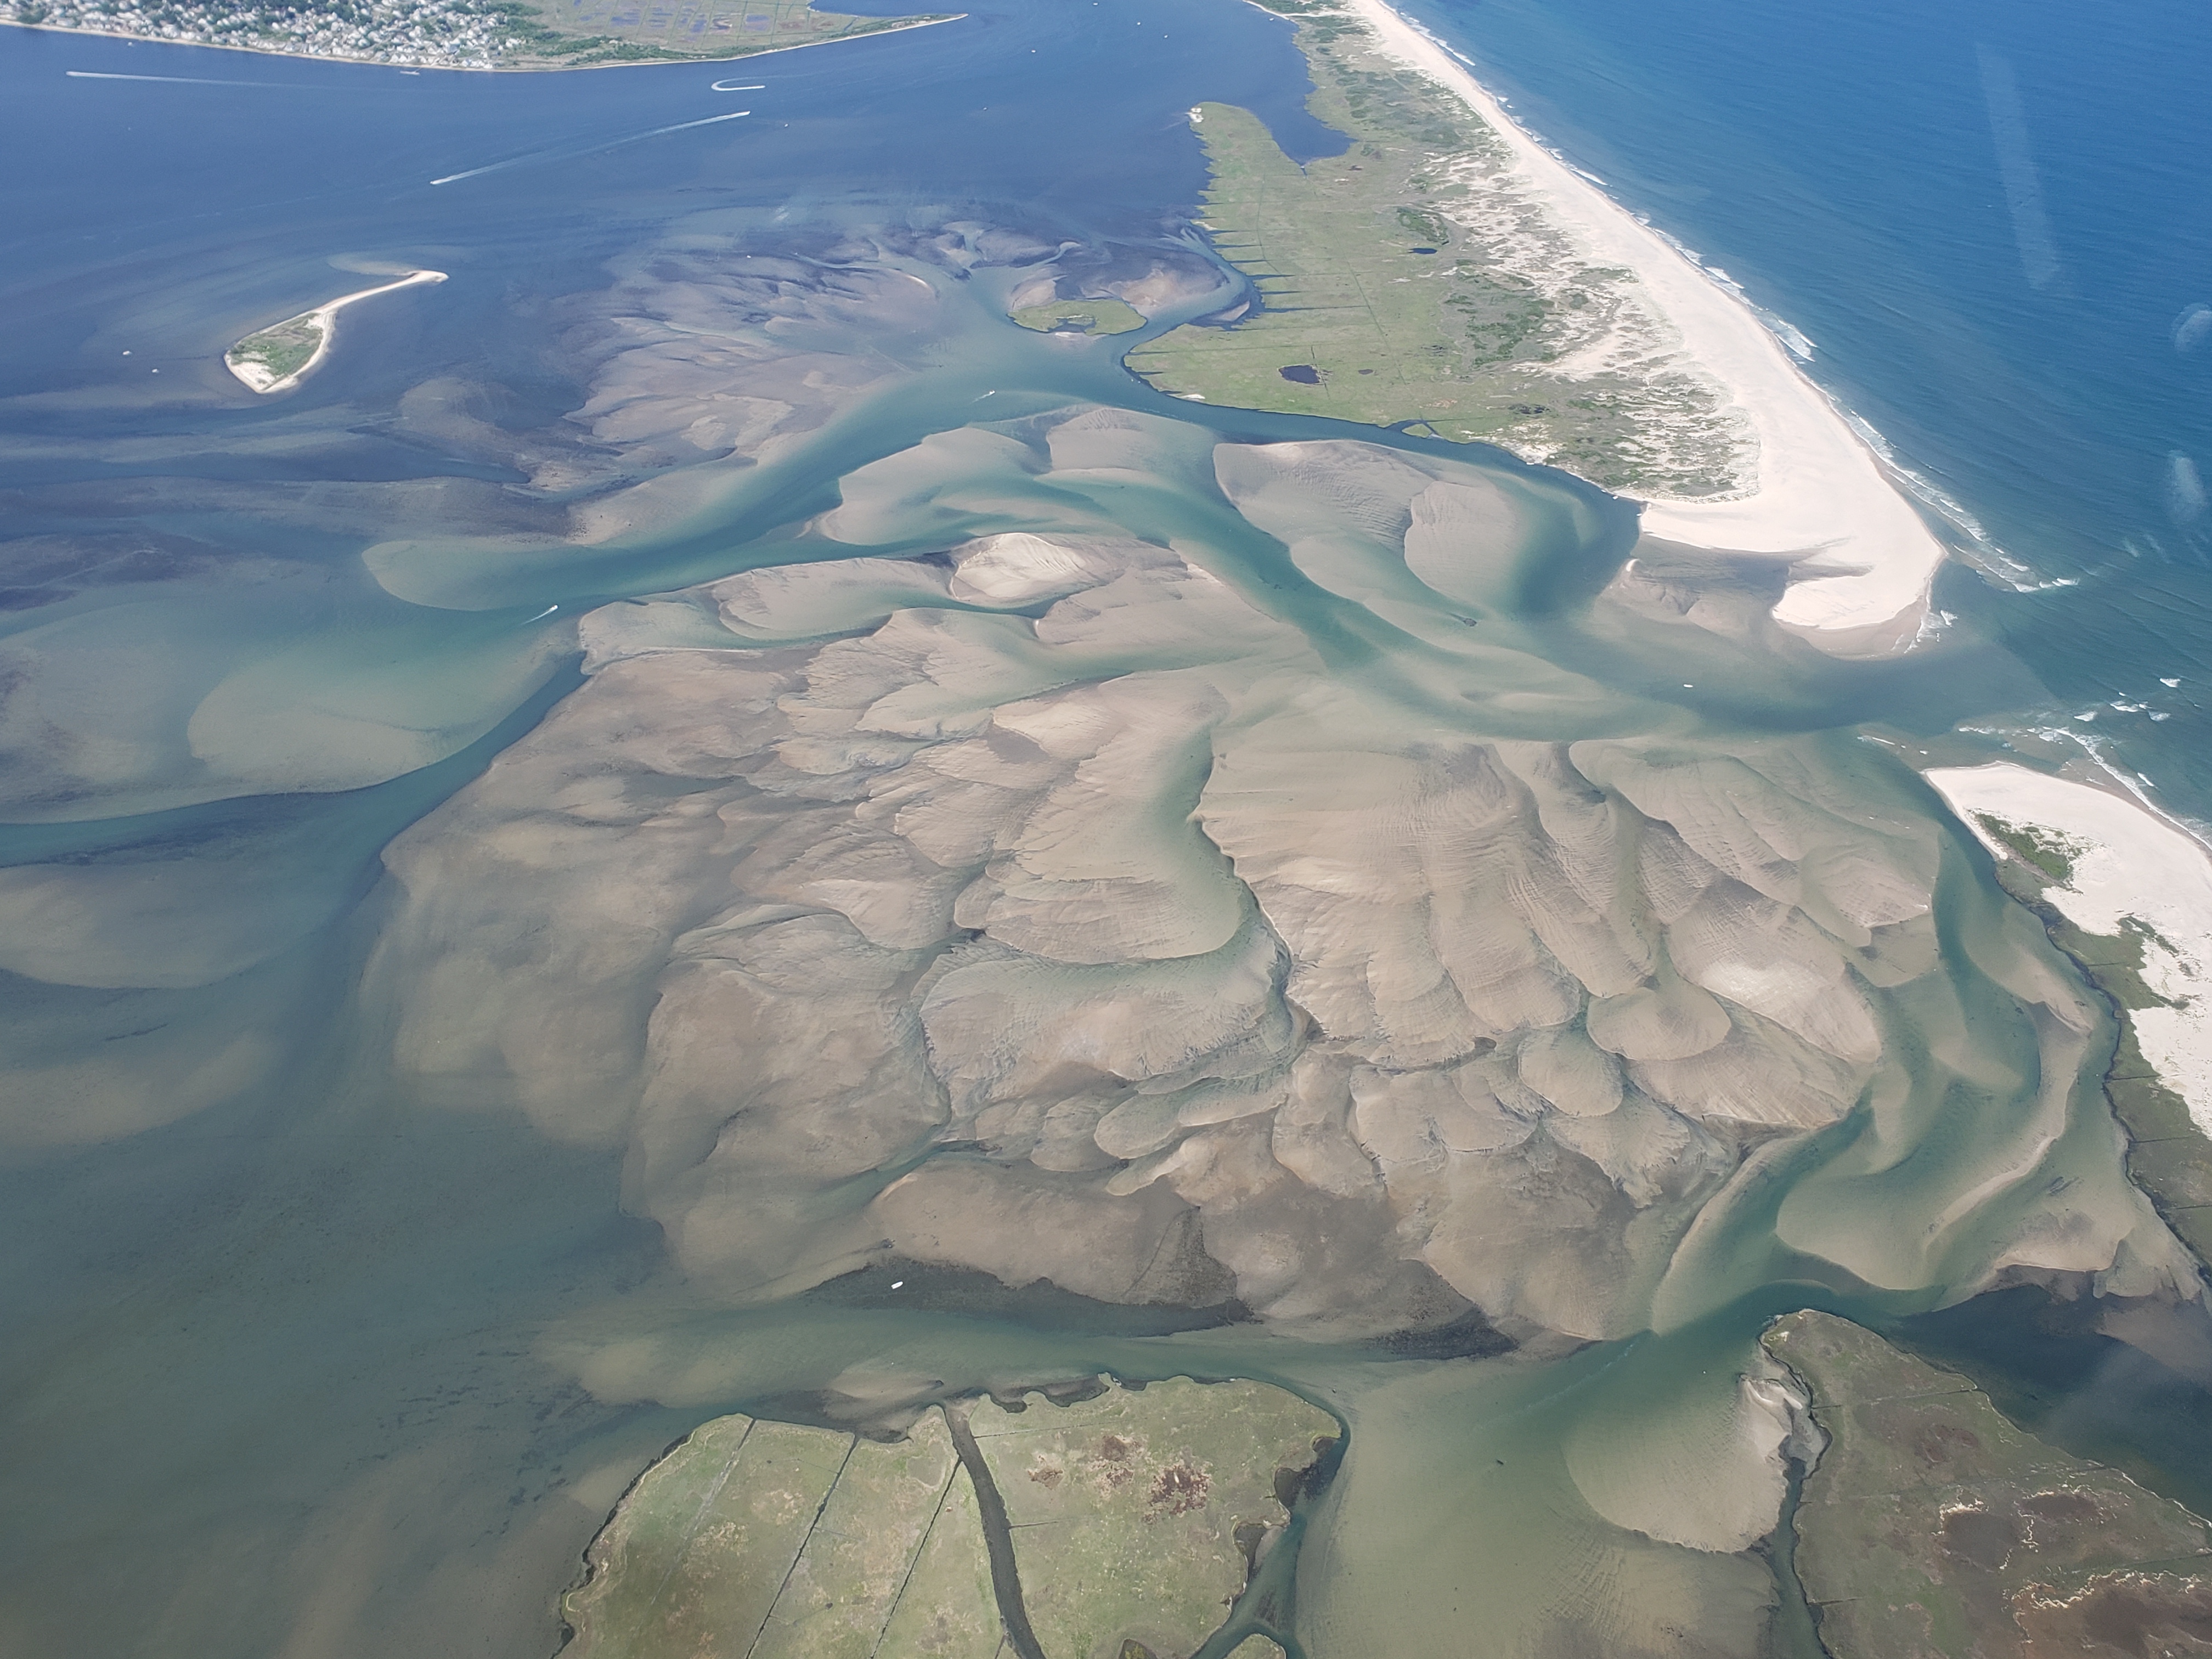 |
June 15, 2020 (JV)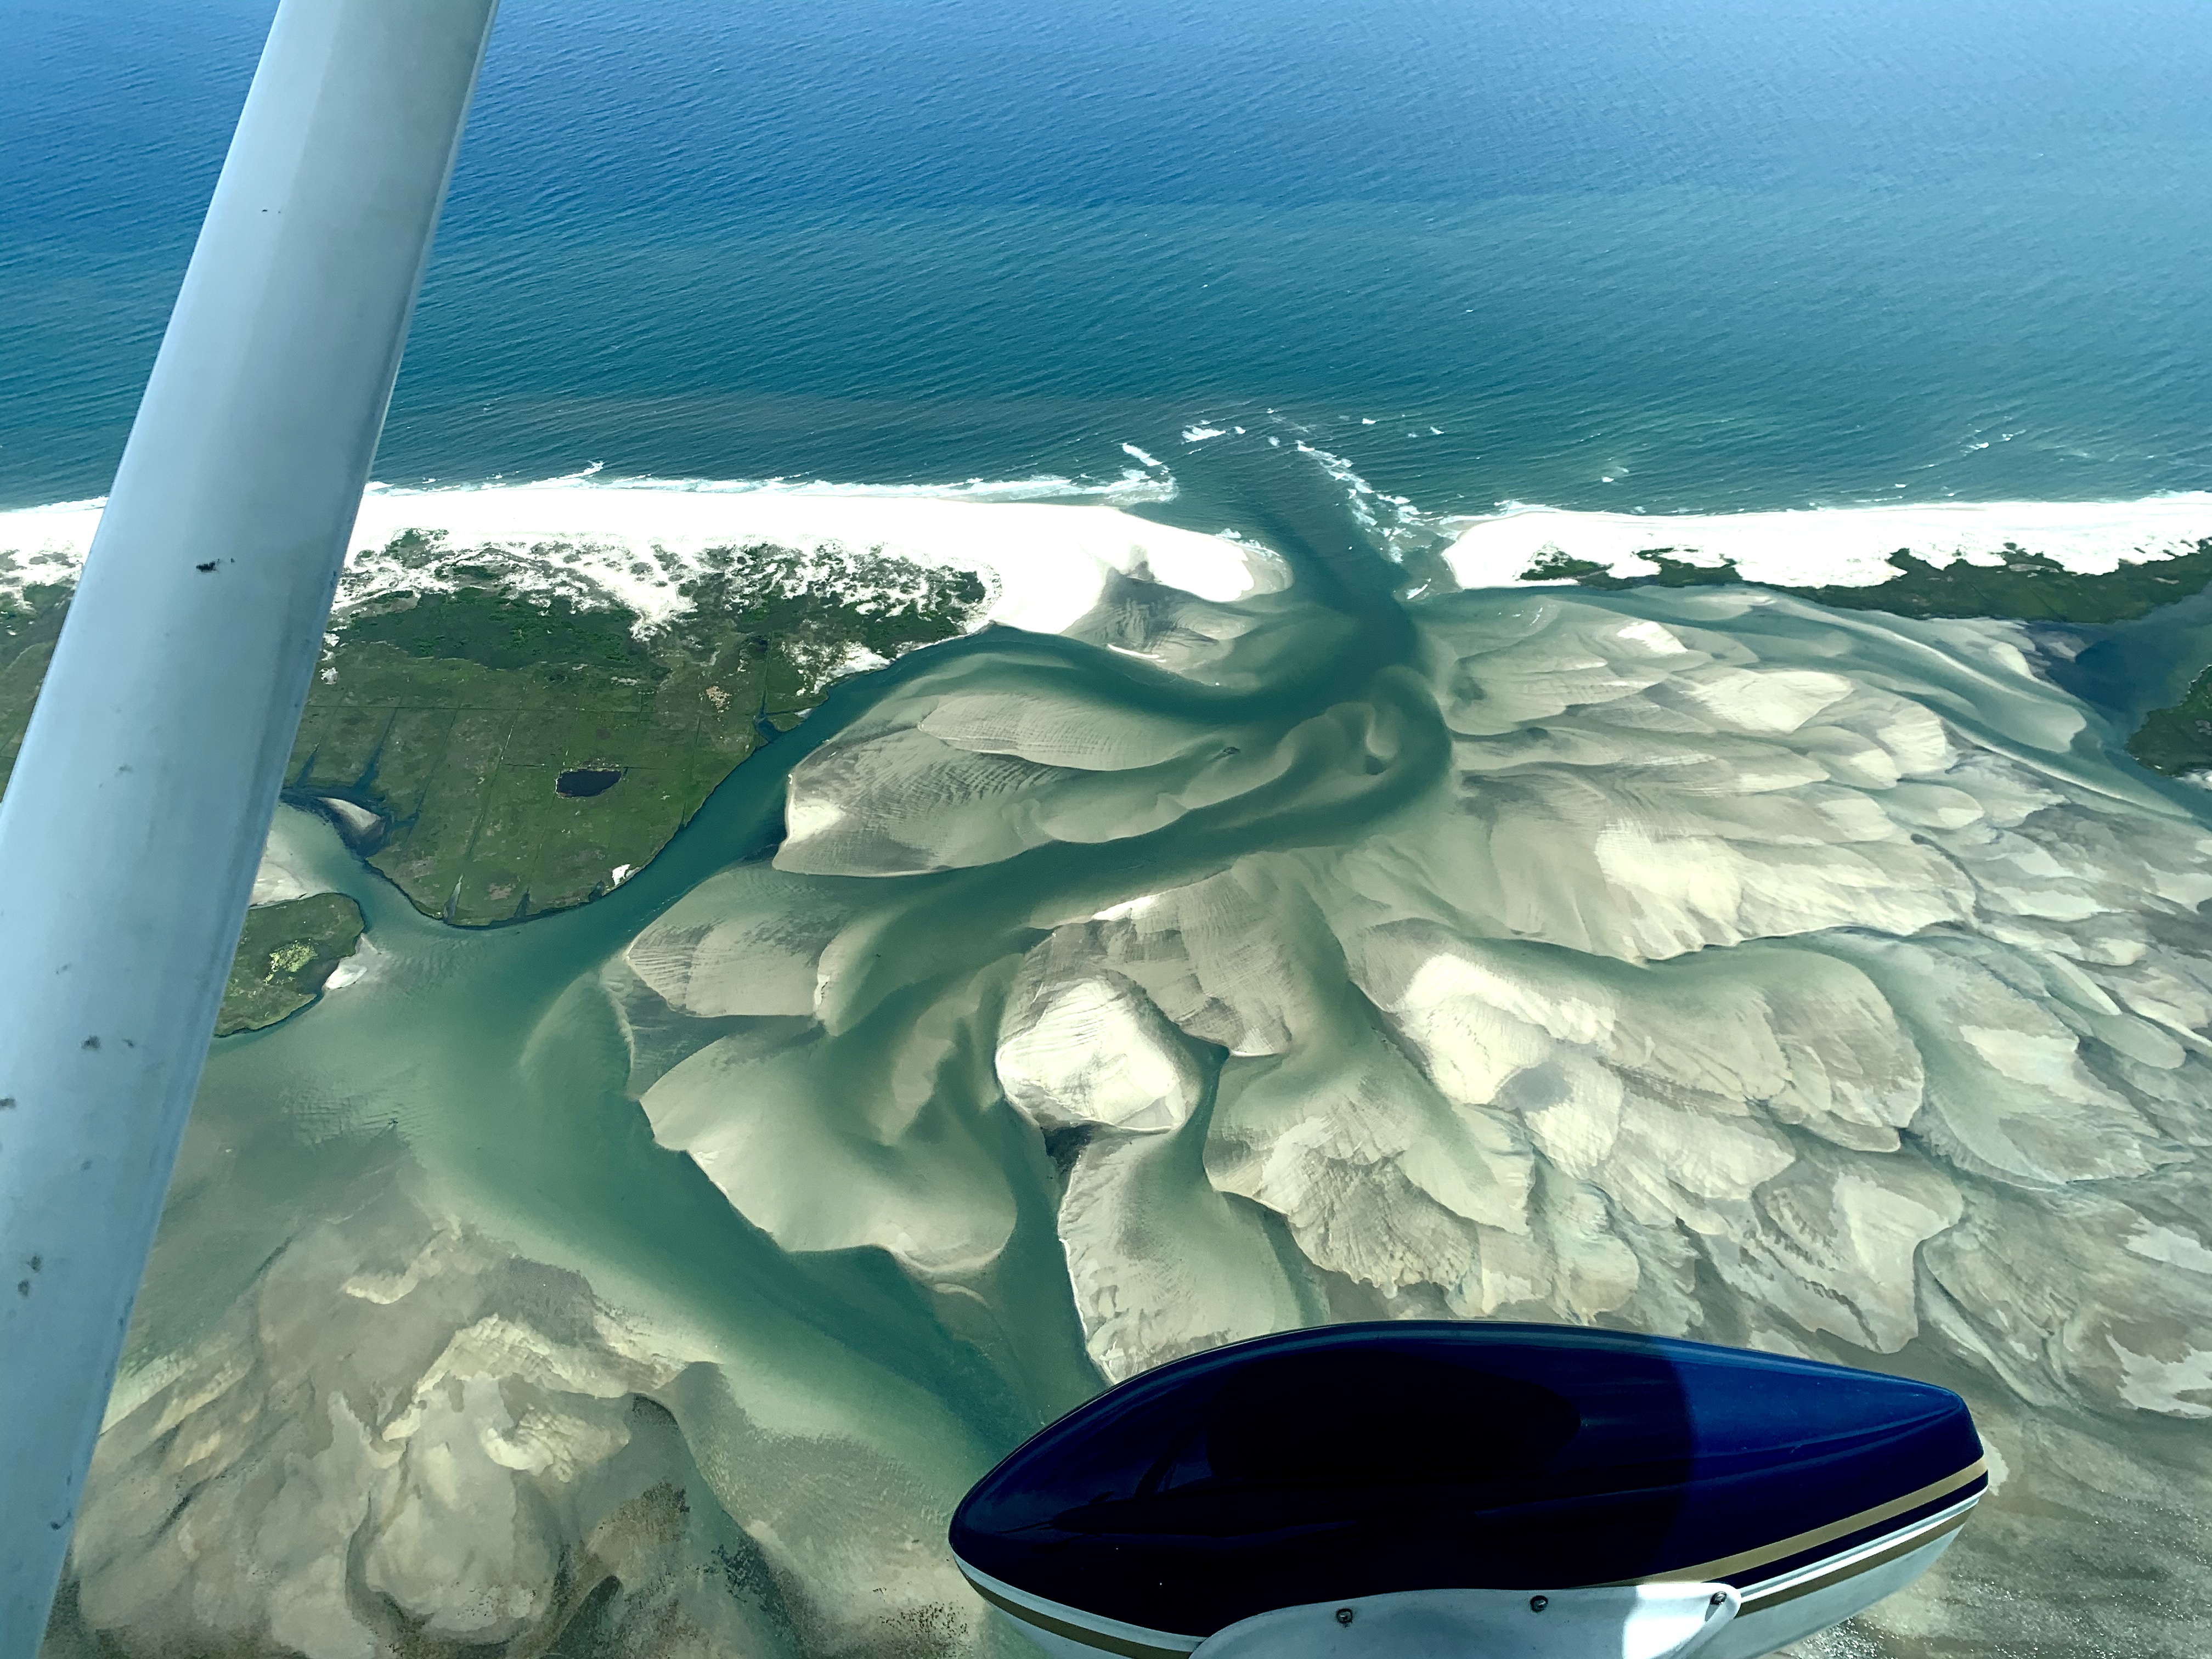 |
July 14, 2020 (CF)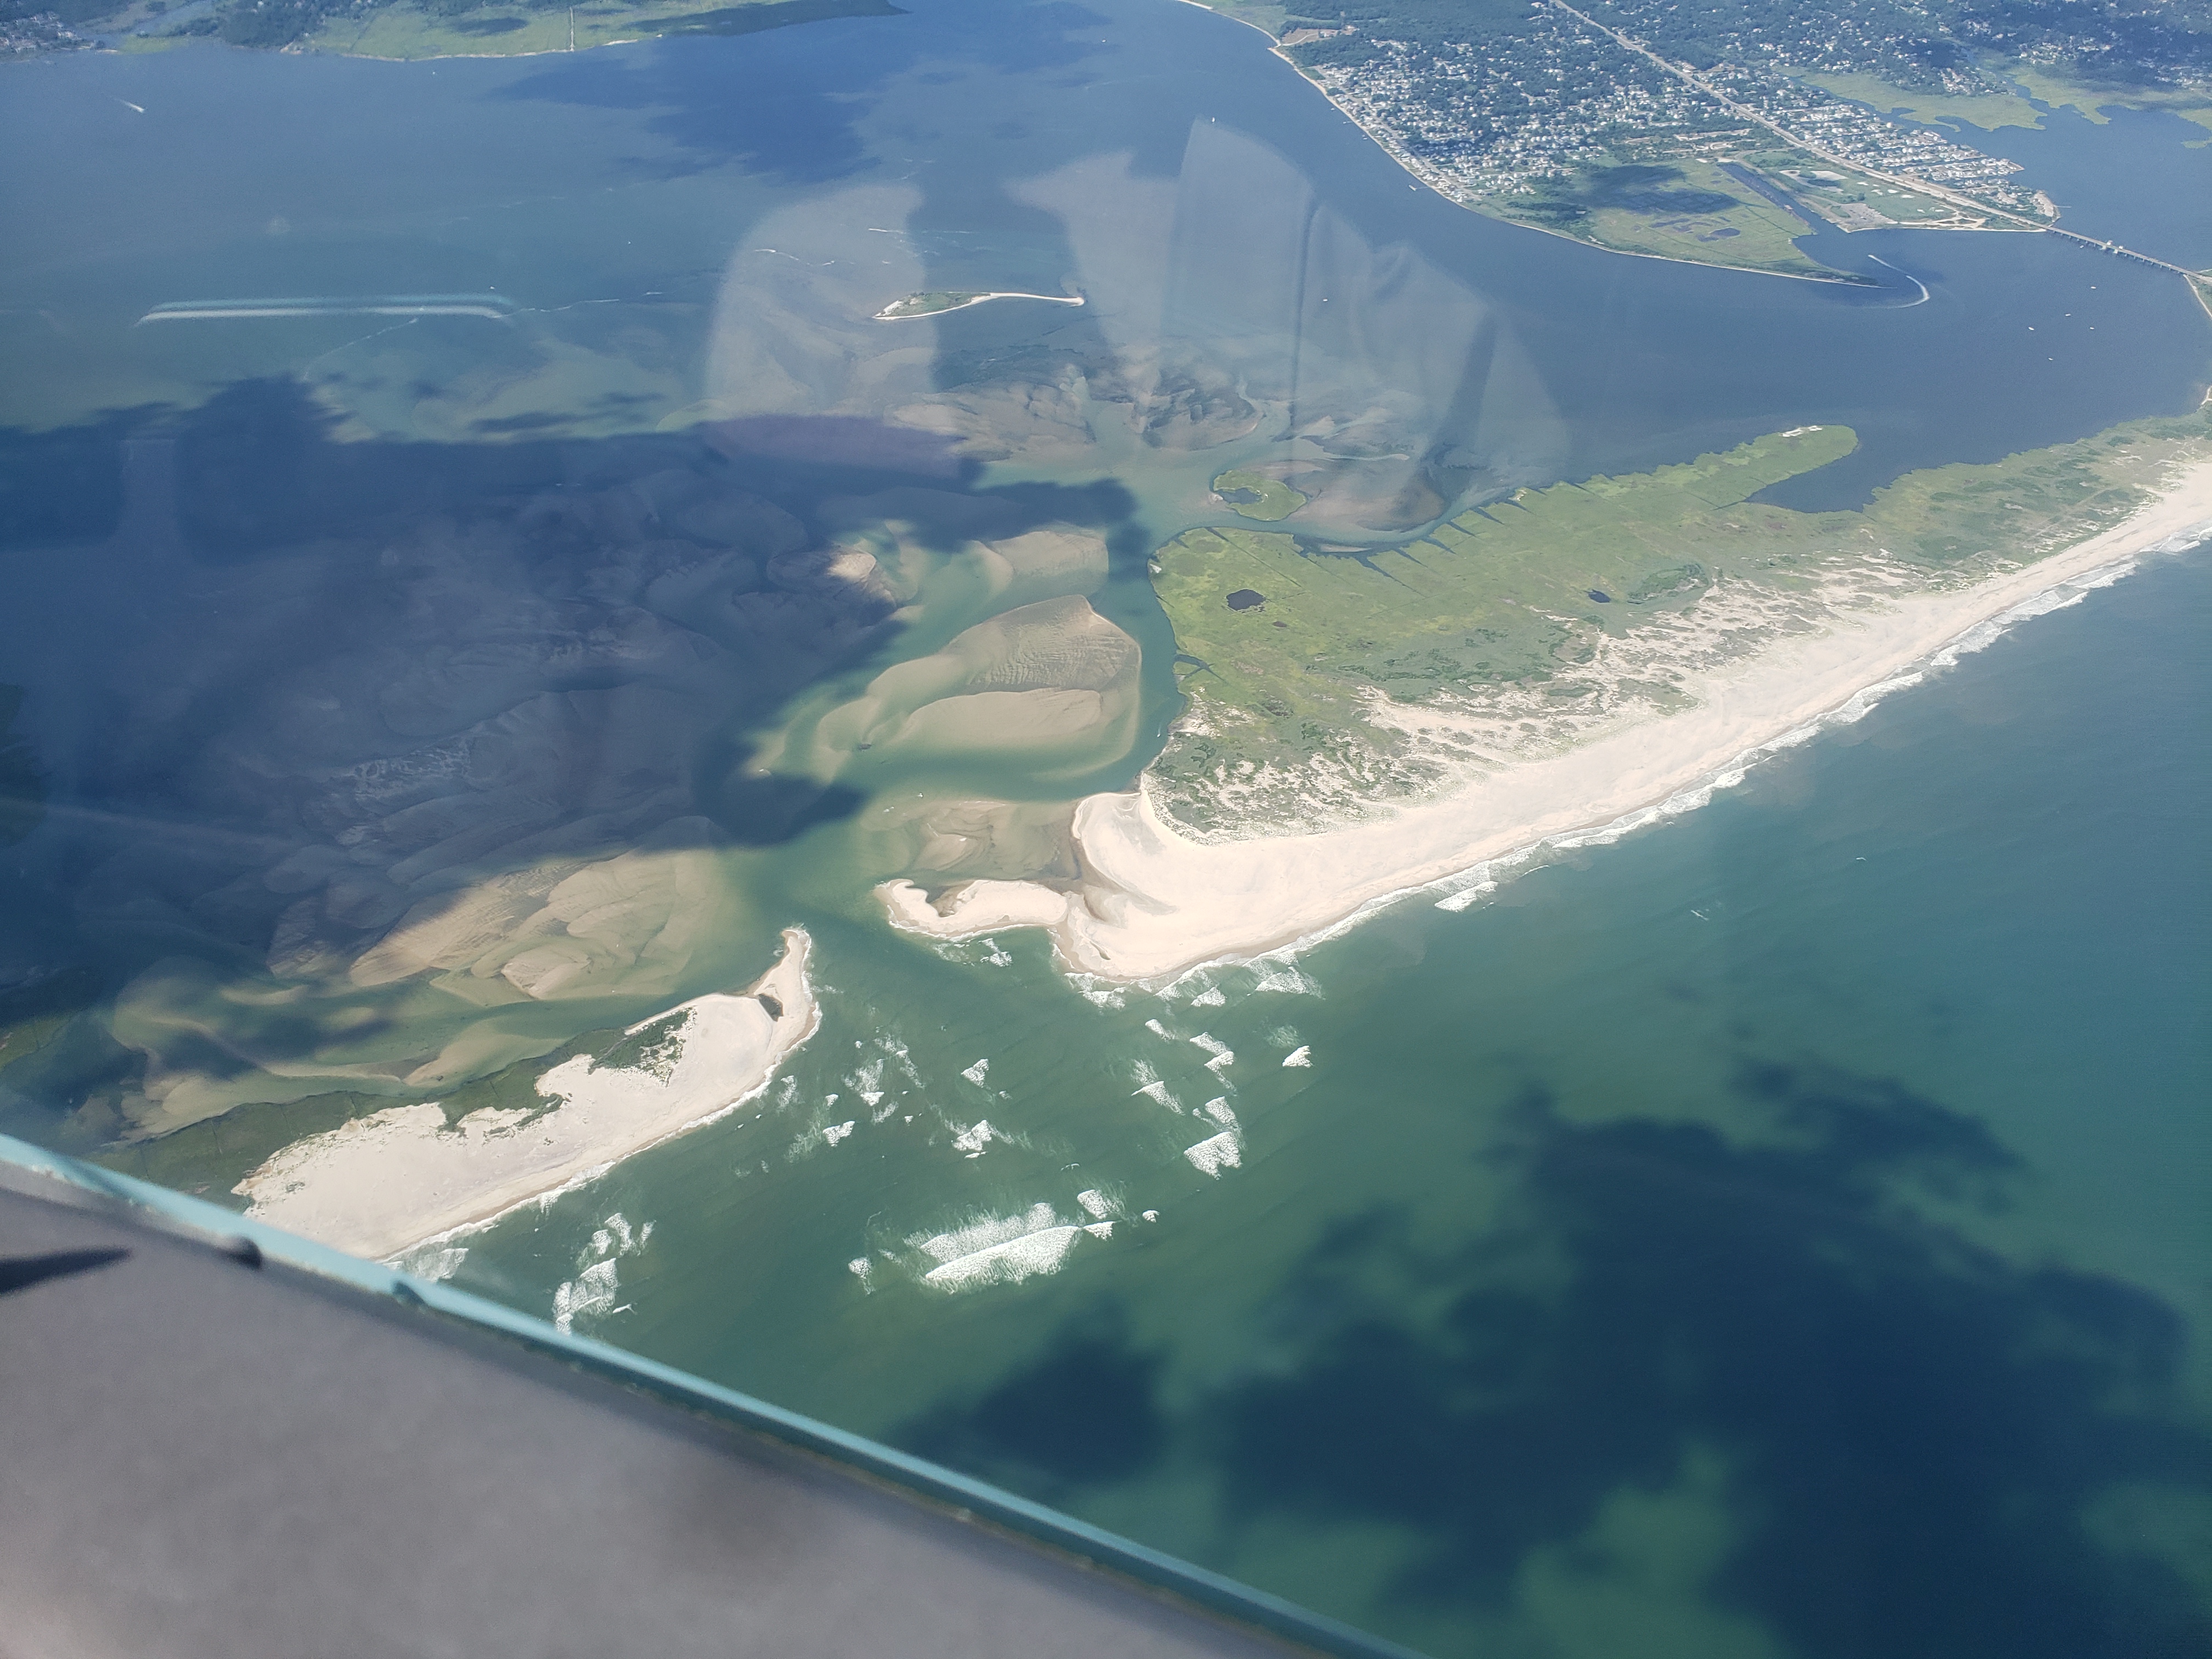 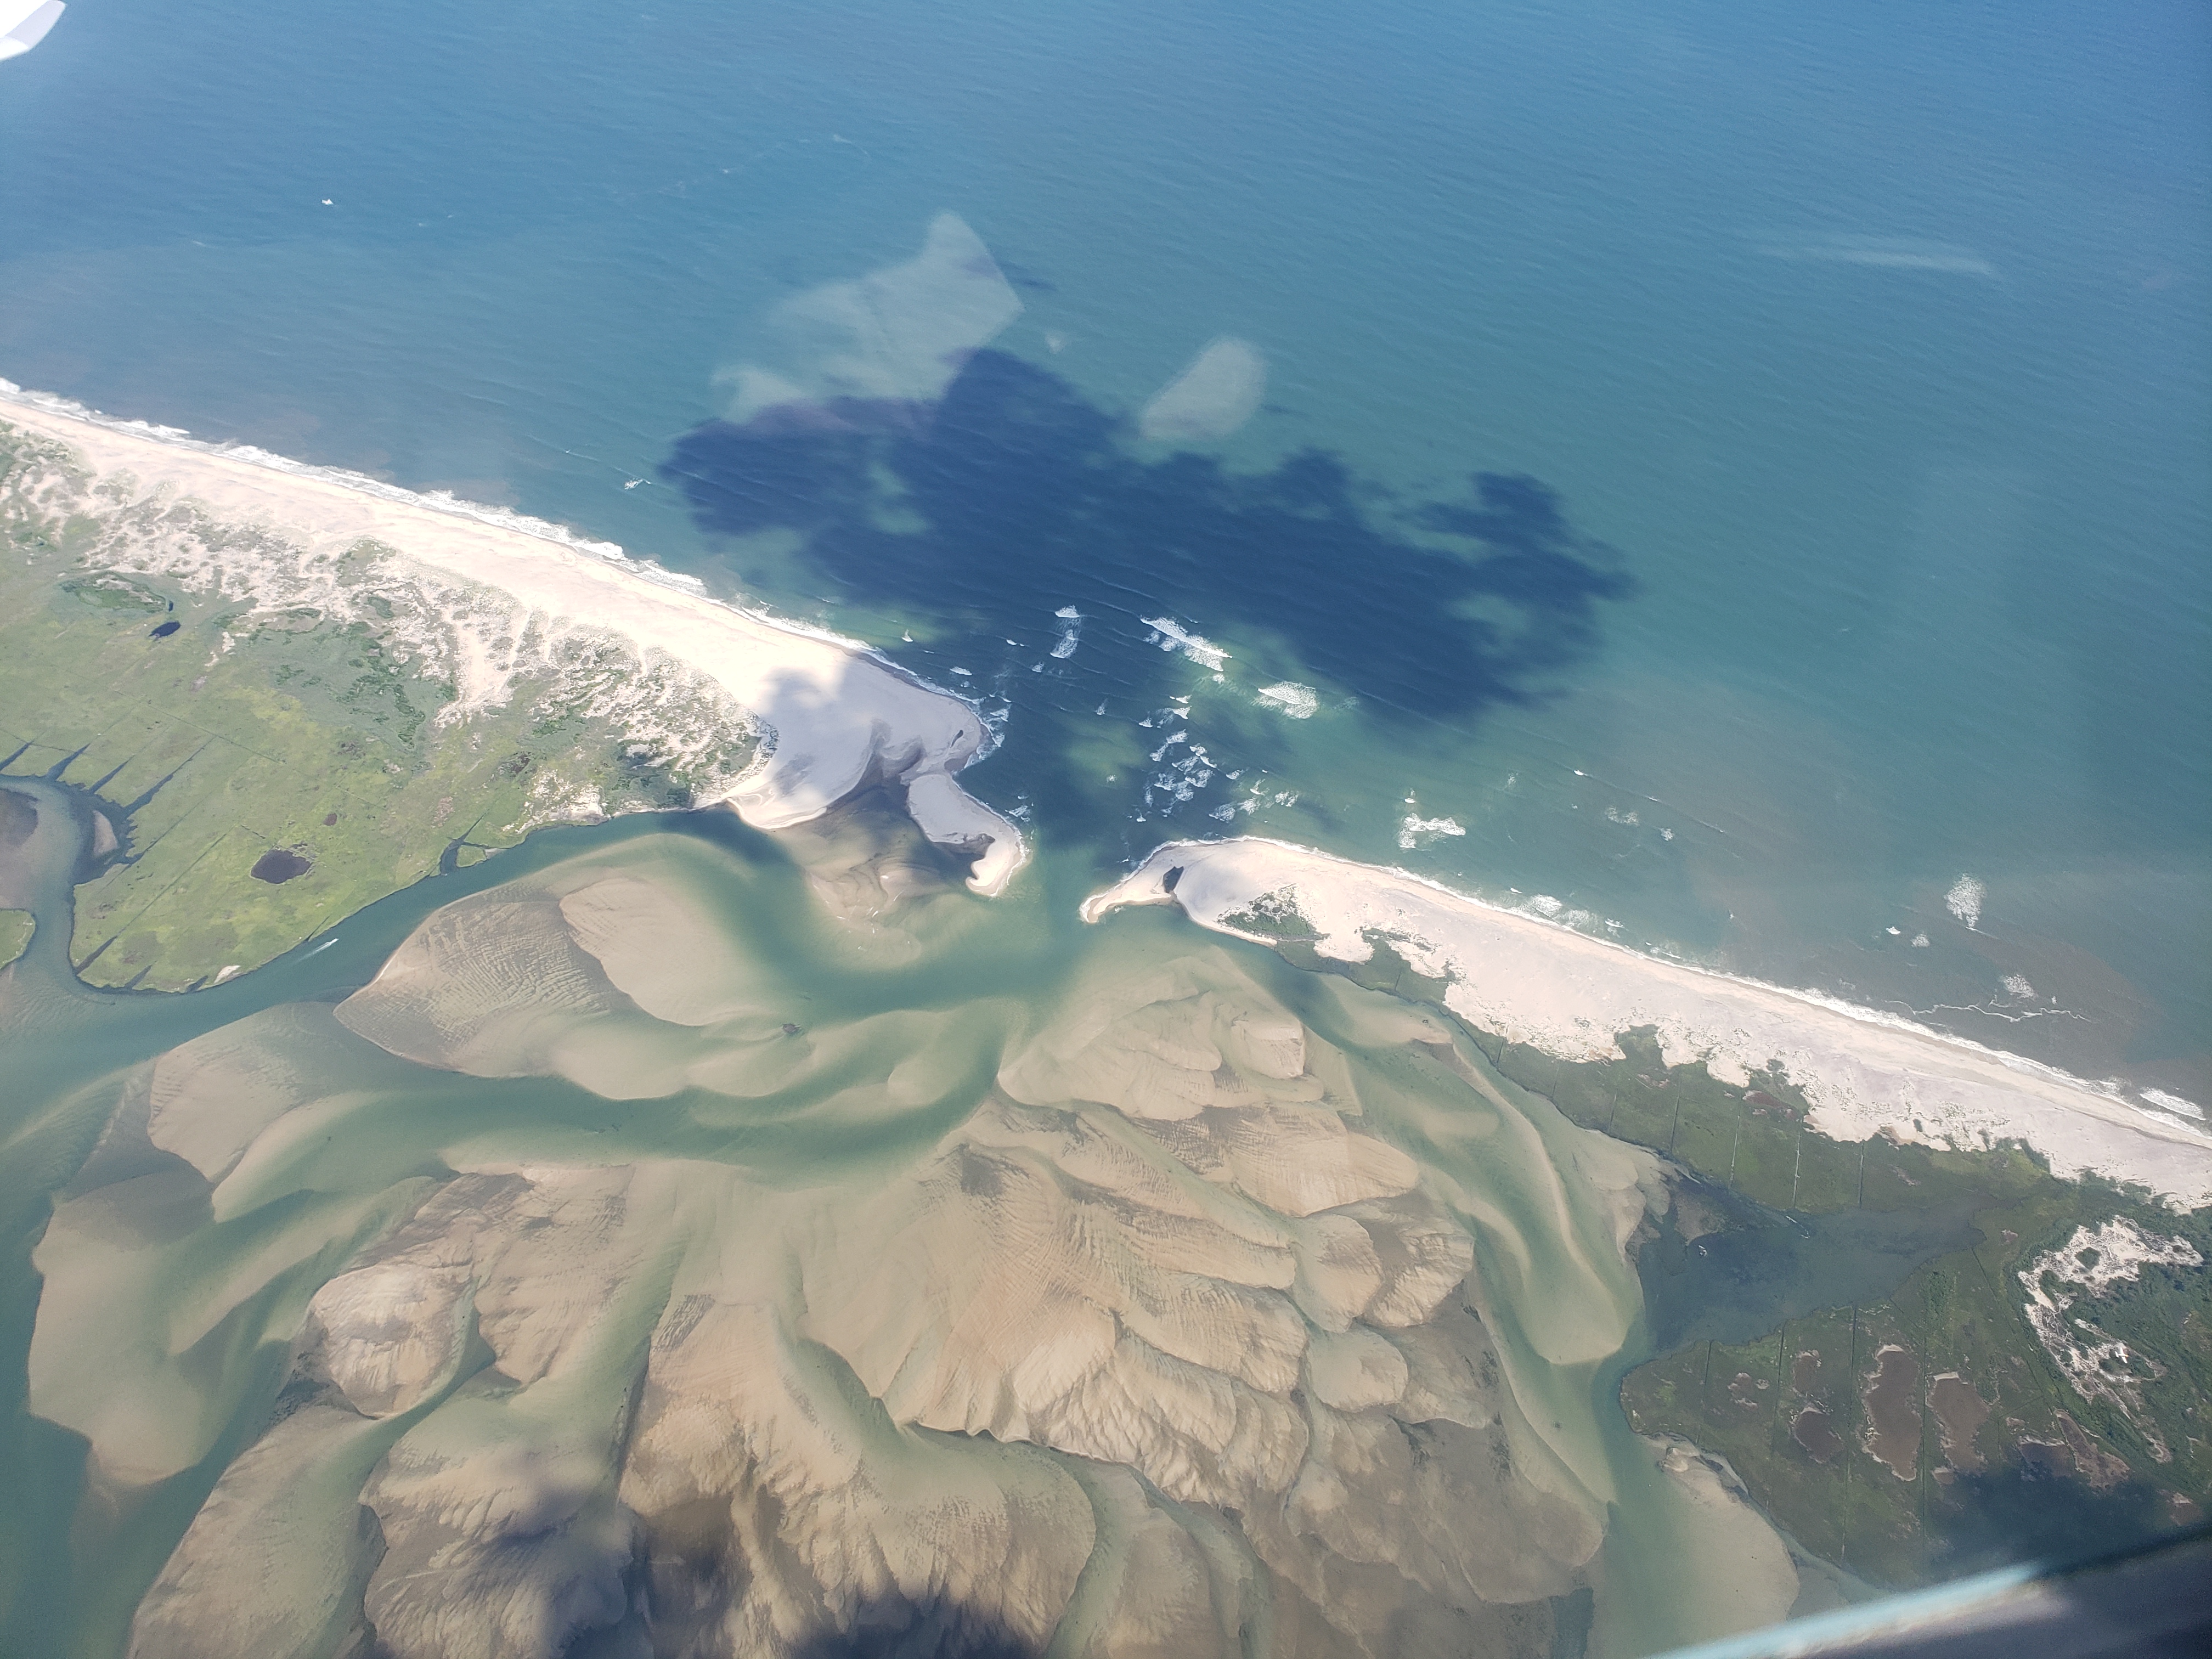 |
||||
Aug 26, 2020 (CF)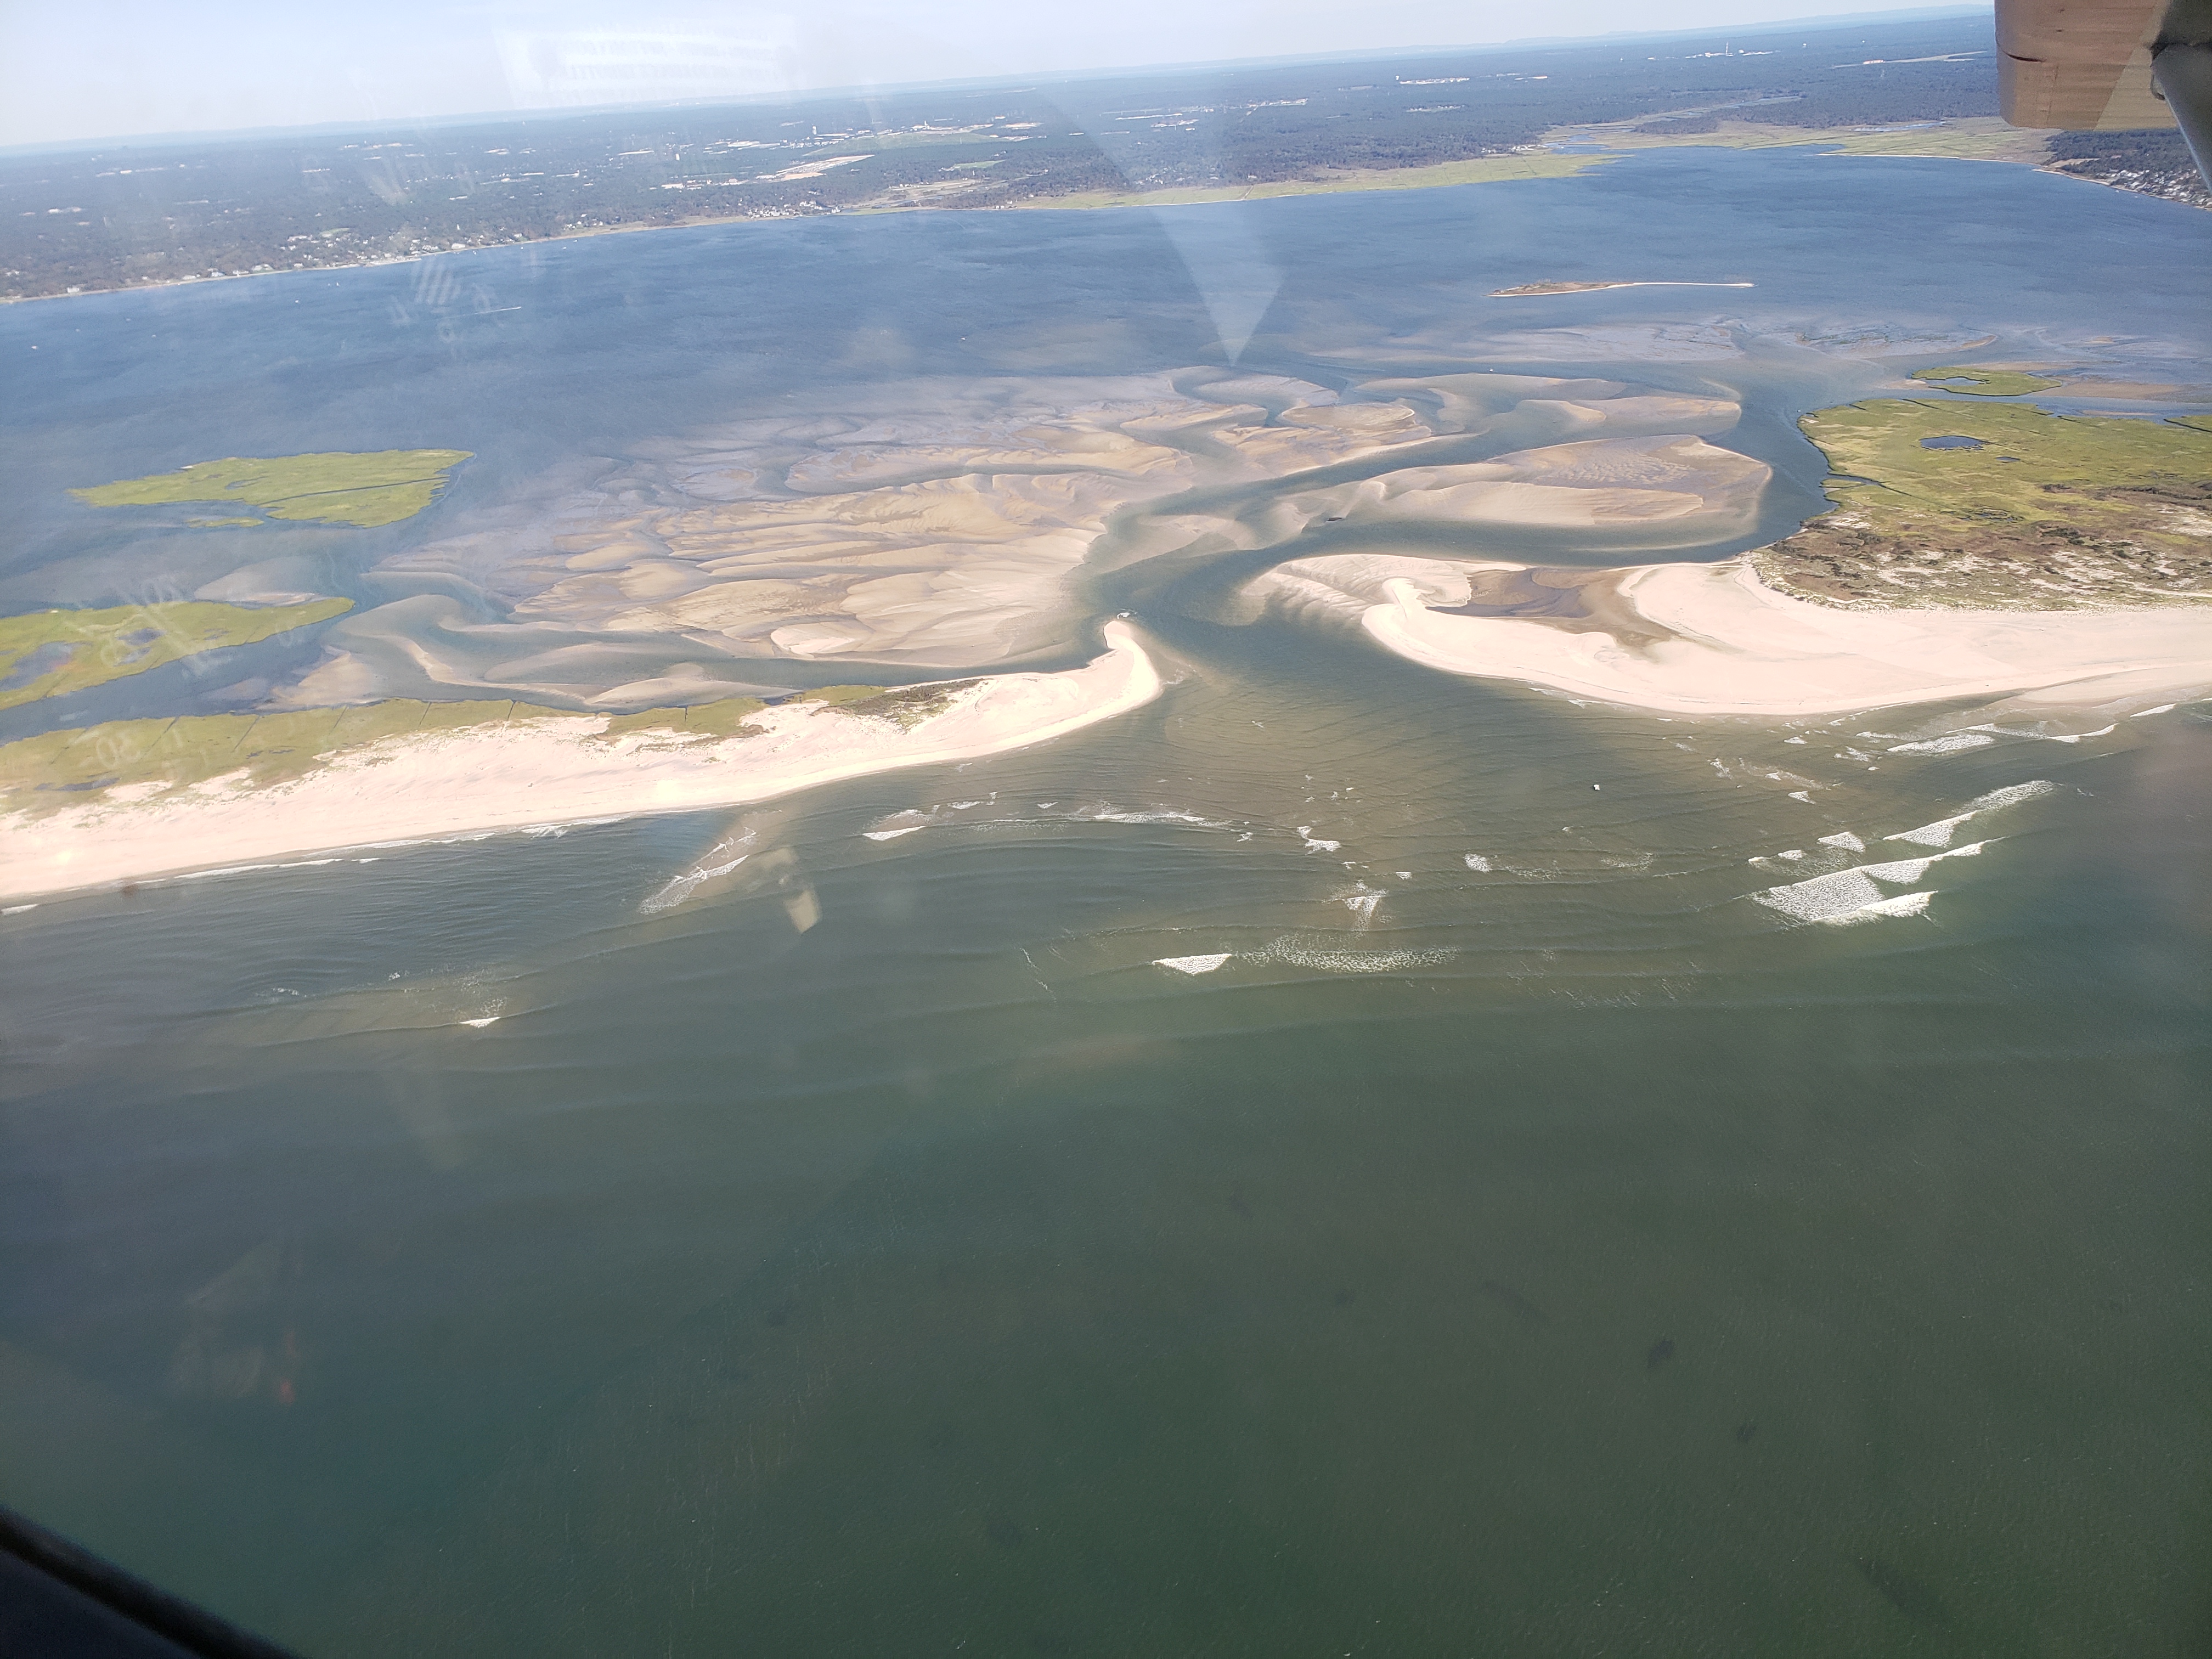  |
Nov 14, 2020 (CF) 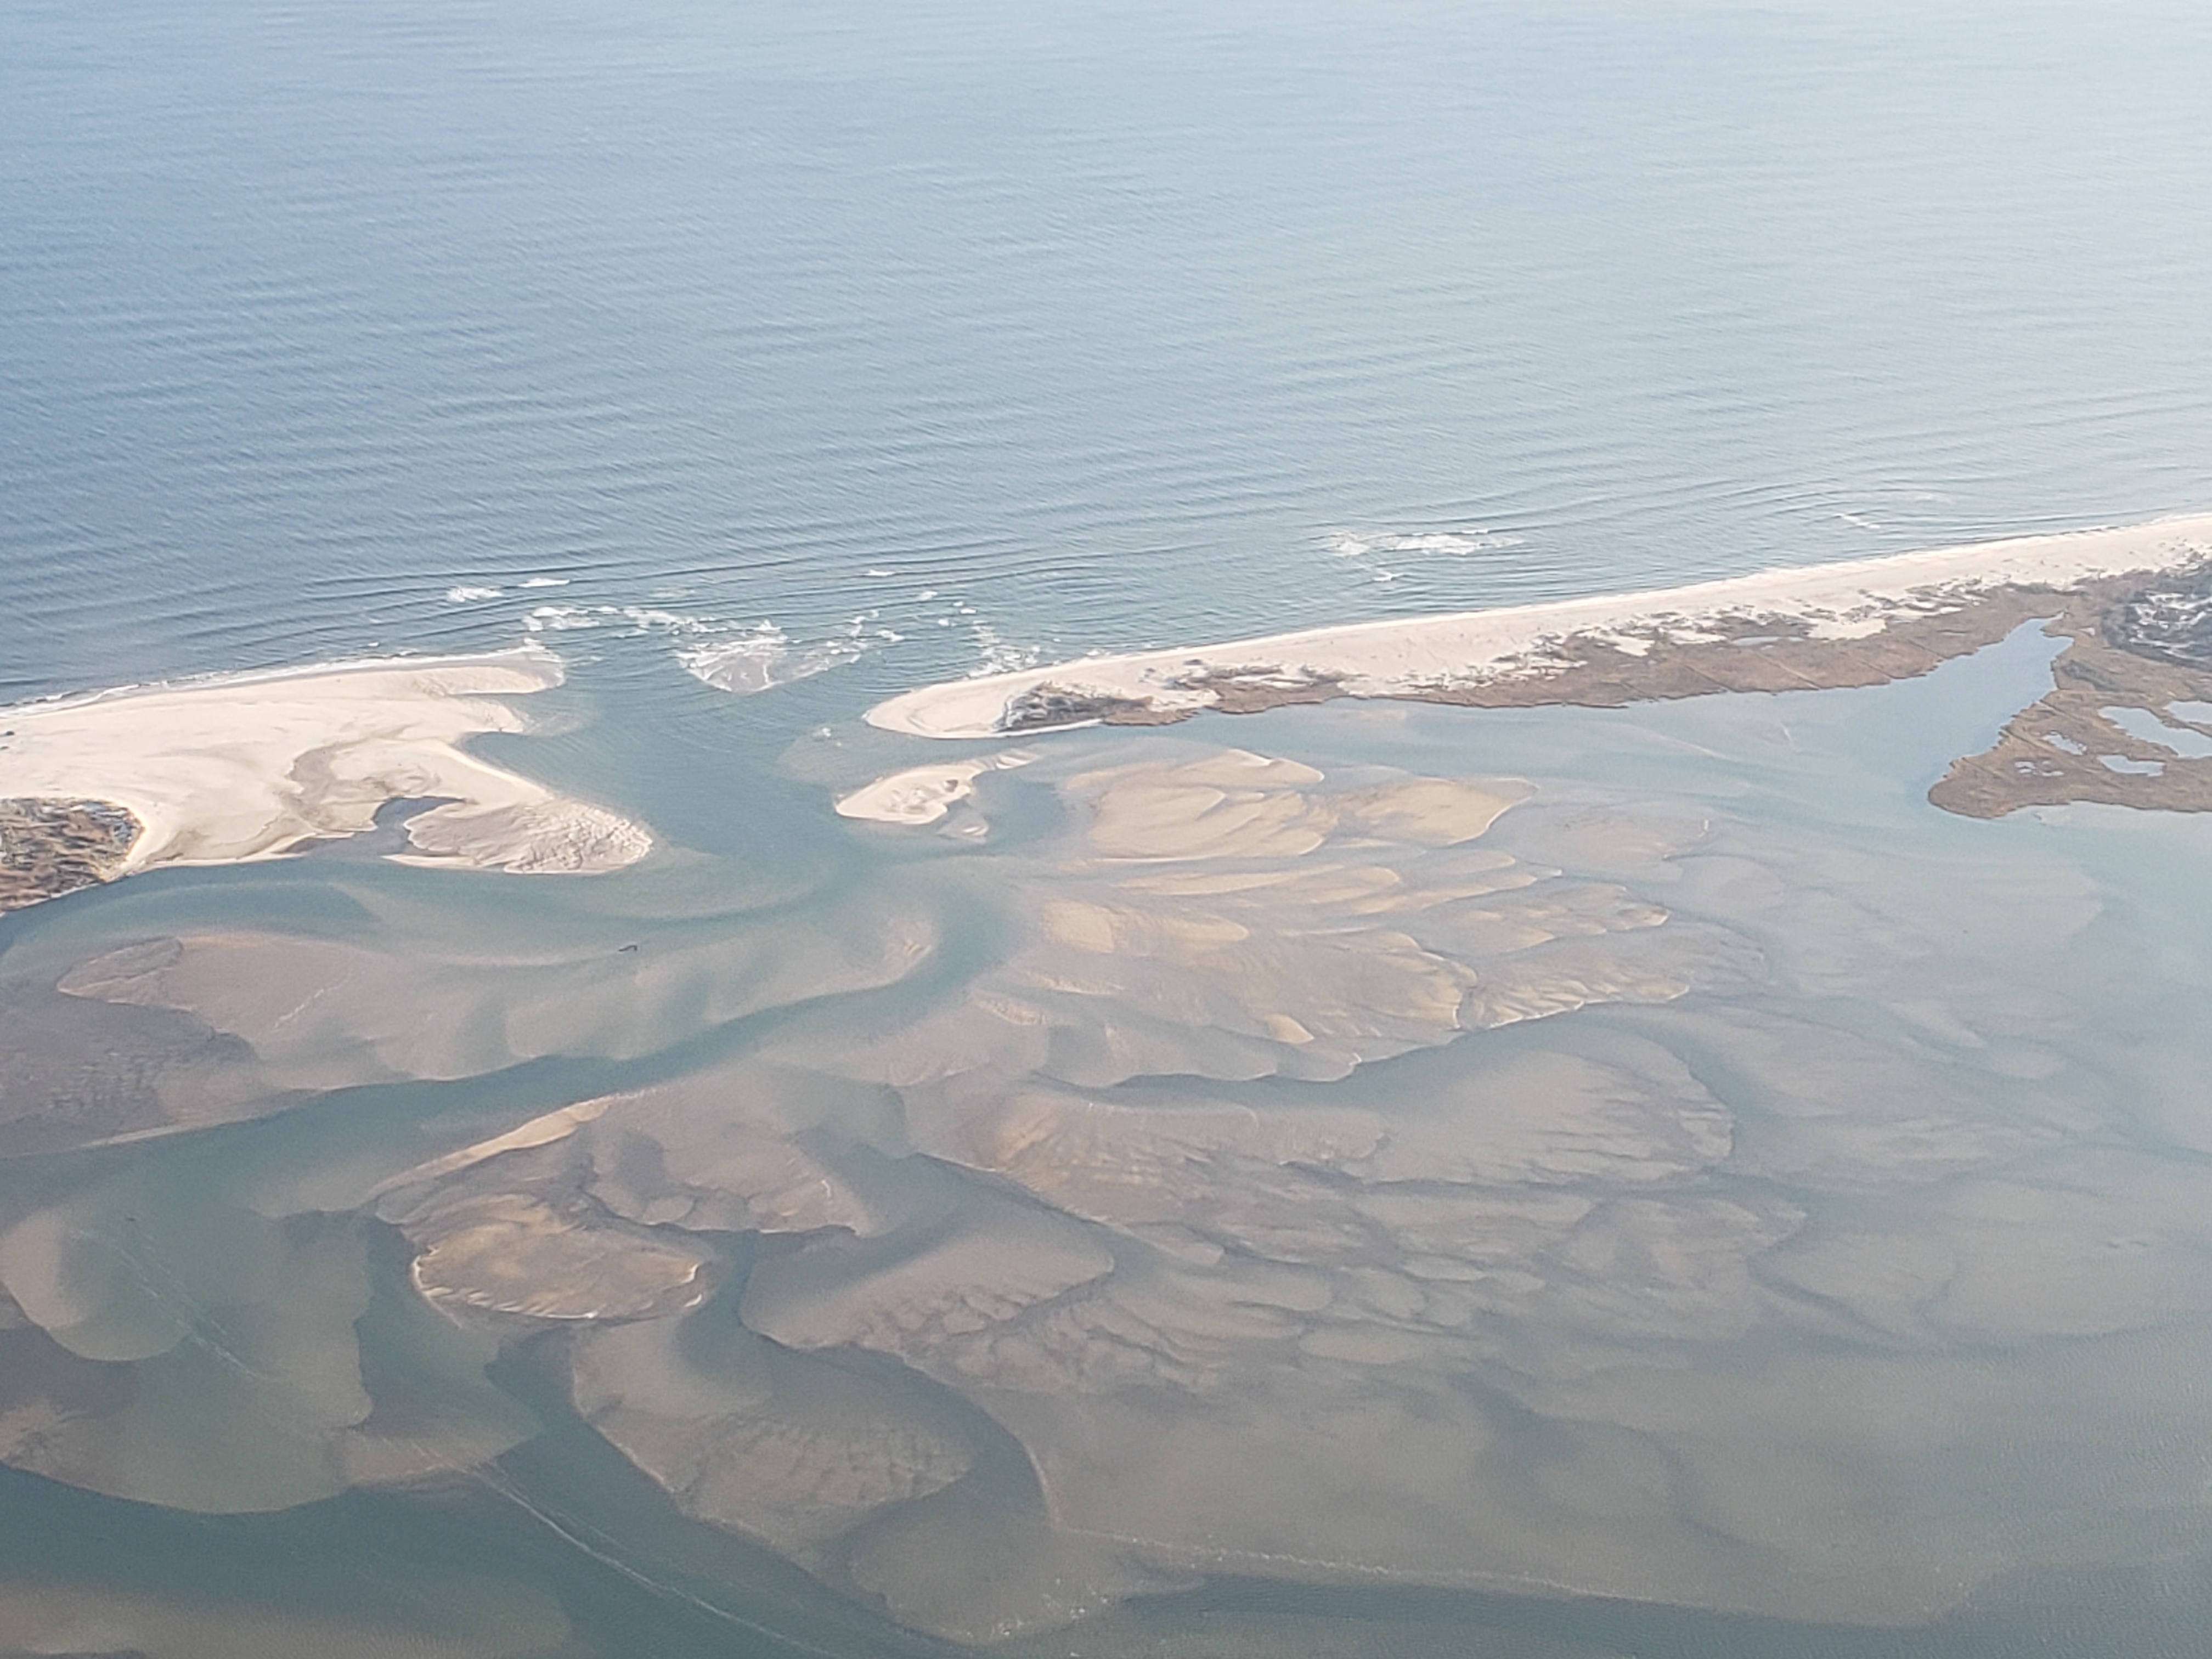 |
Dec 3, 2020 (RG)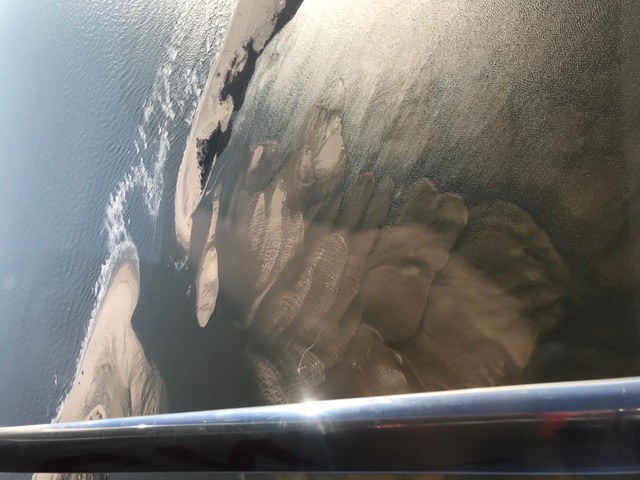 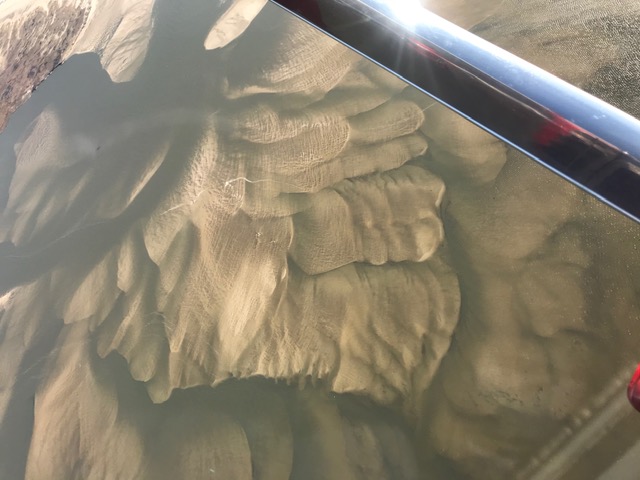 |
Dec 3, 2020 (RG)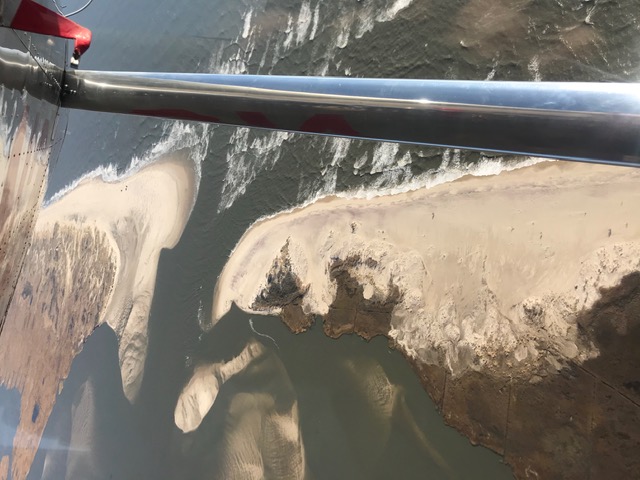 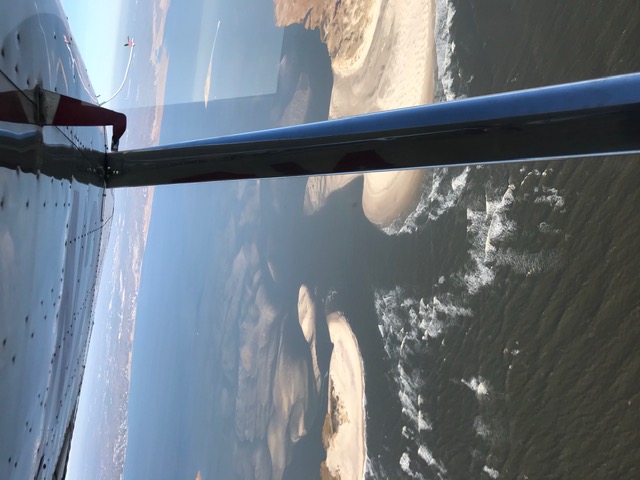 |
||||
Jan 8, 2021 (CF)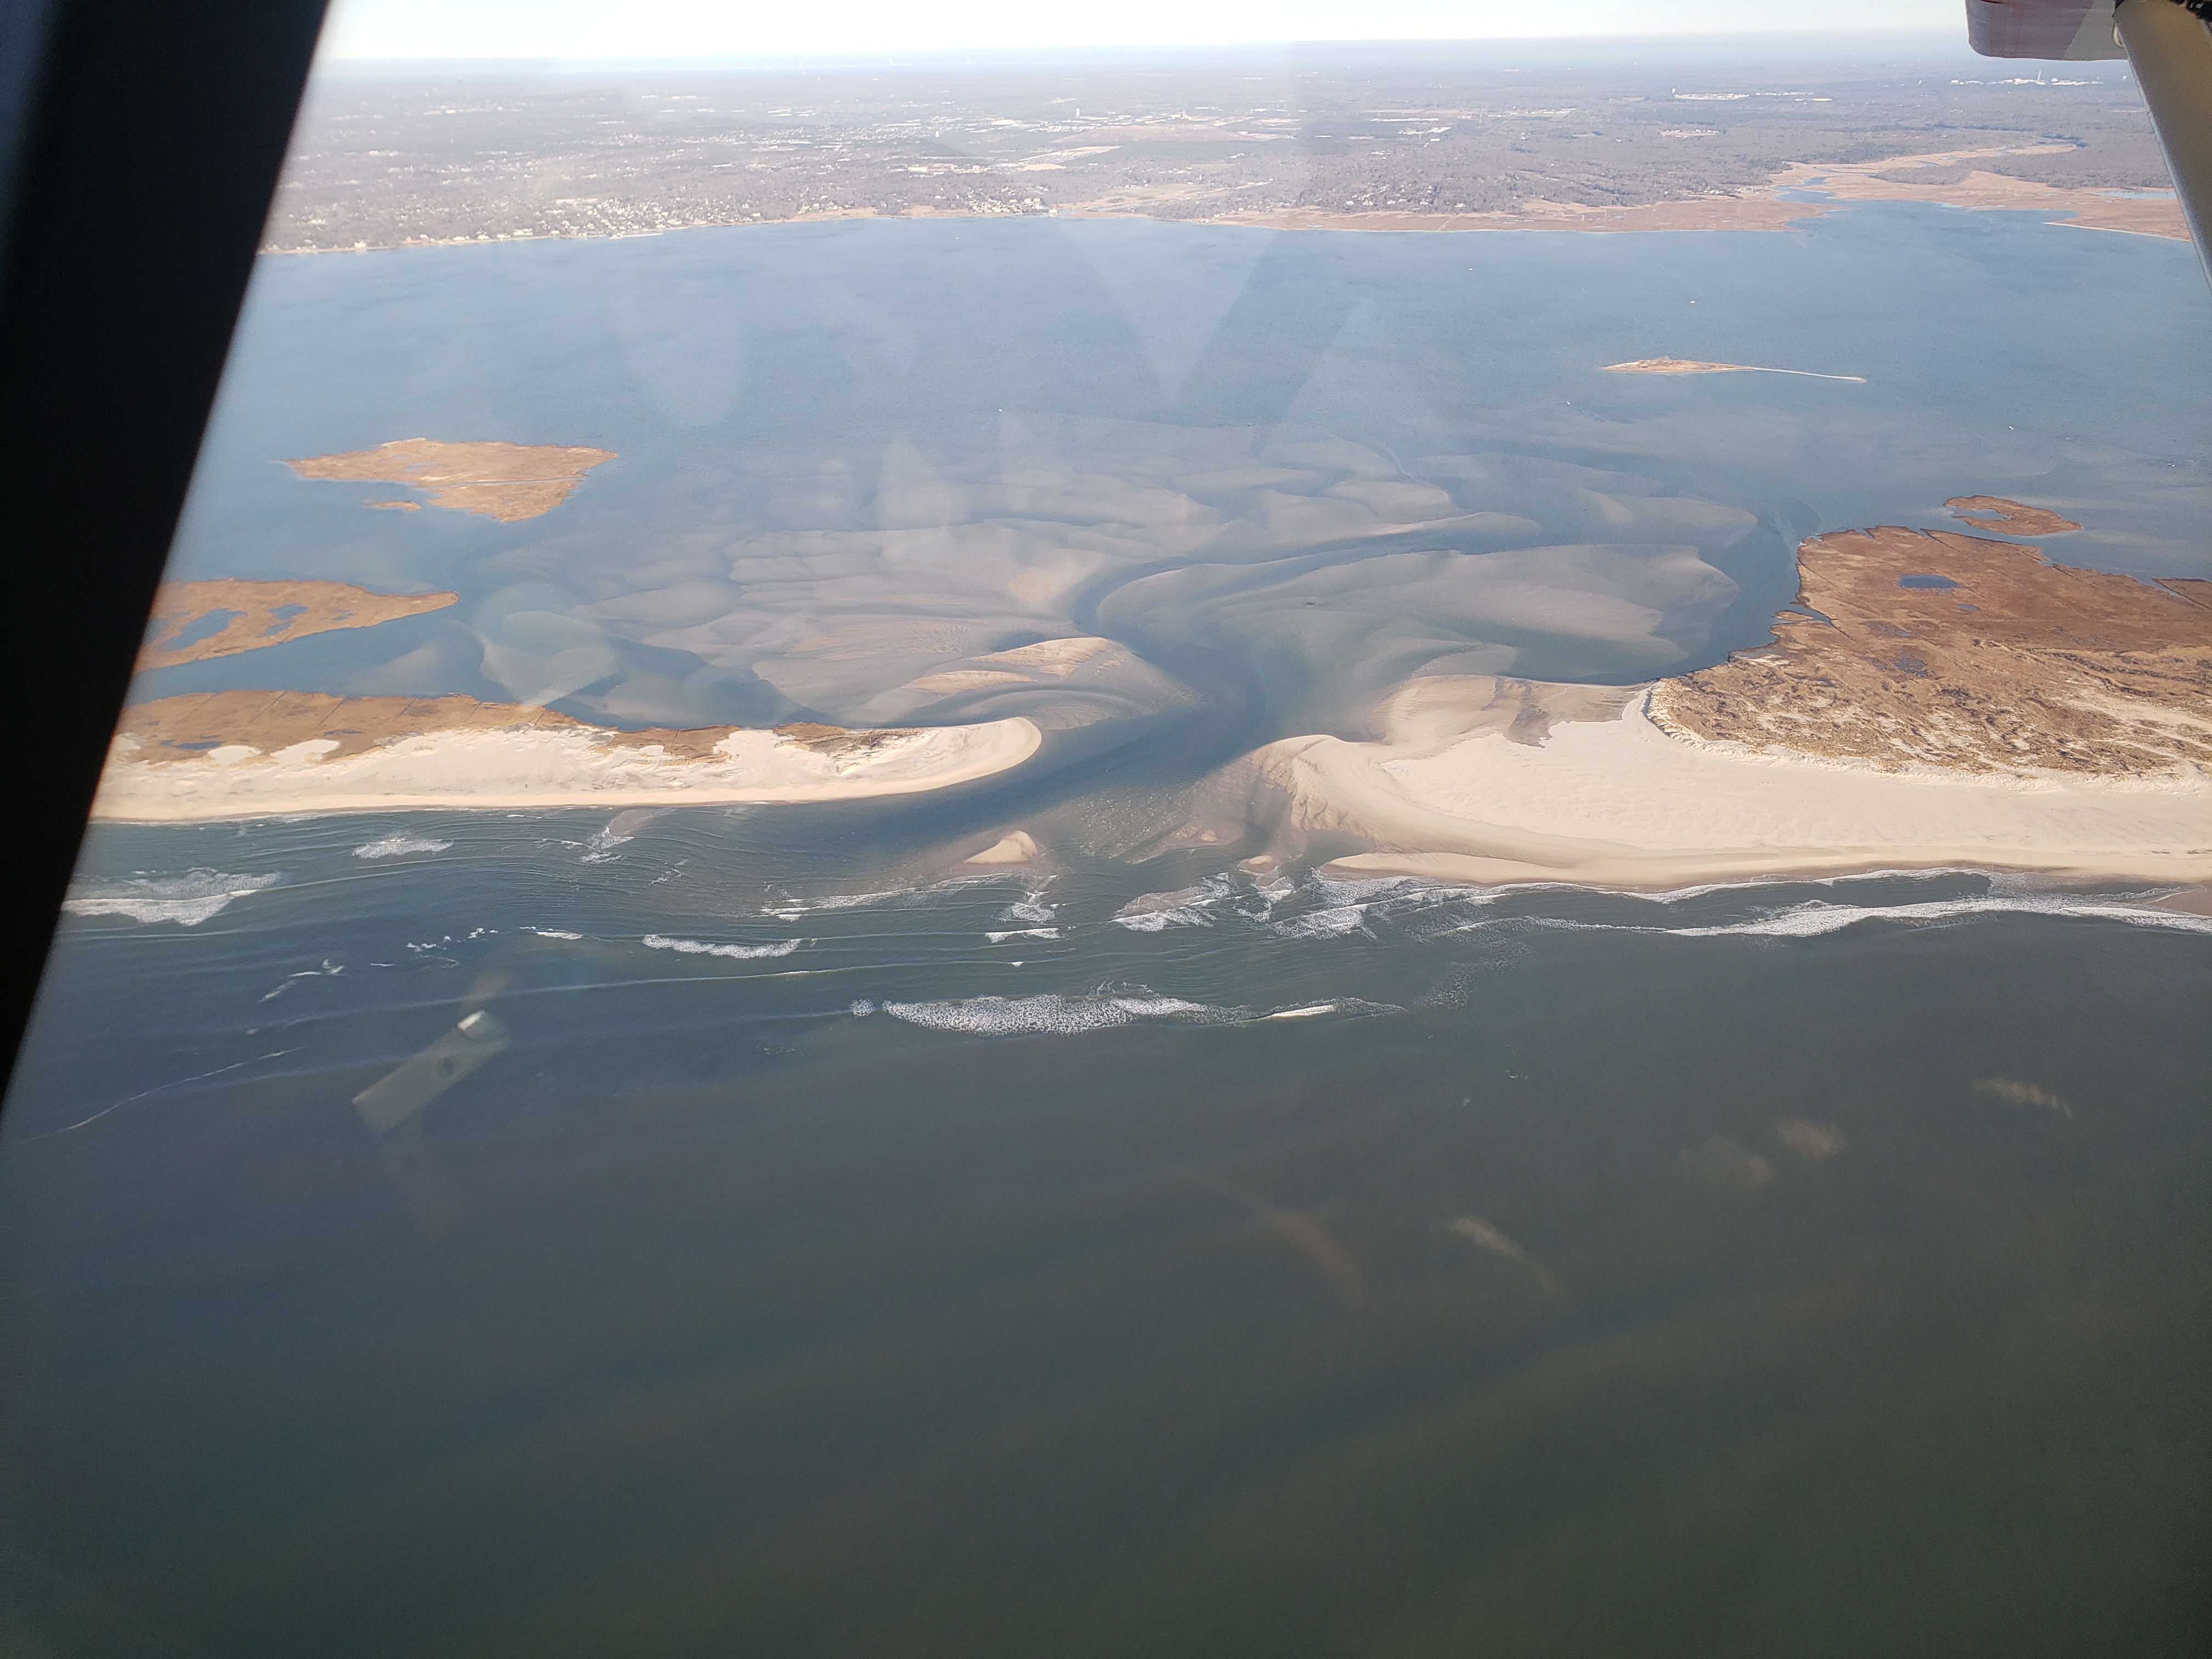 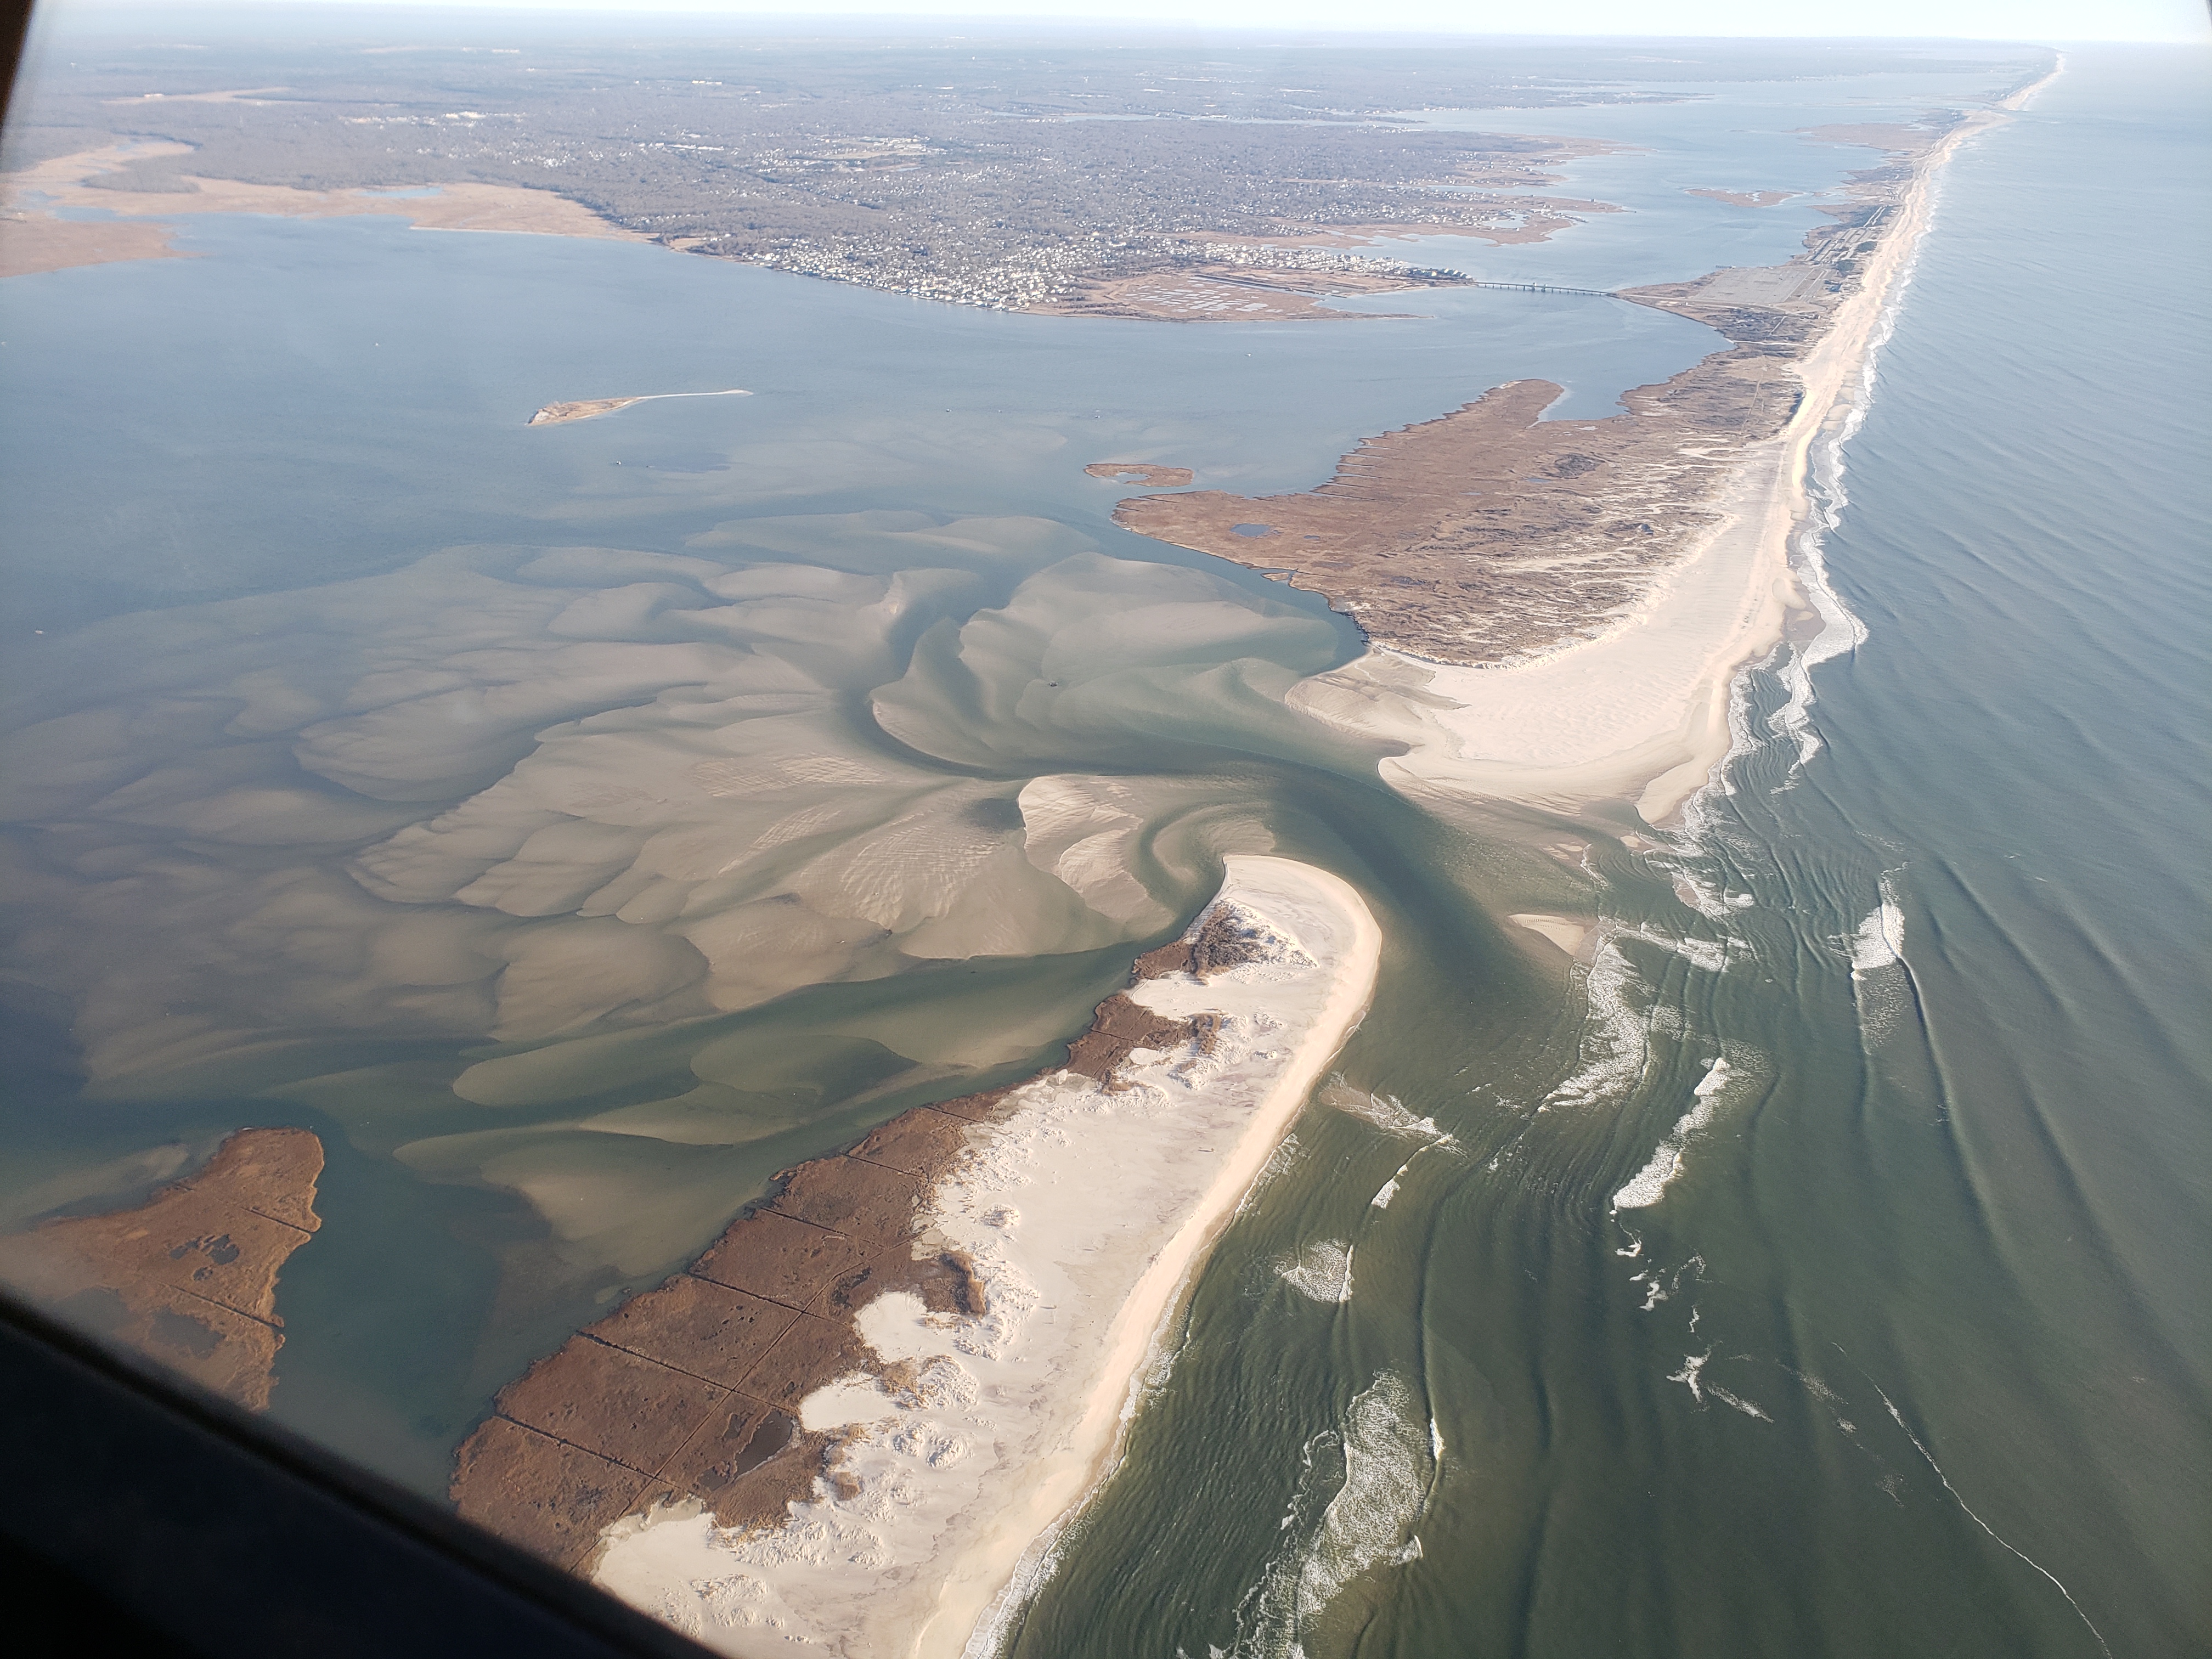 |
Jan 12, 2012 (RG)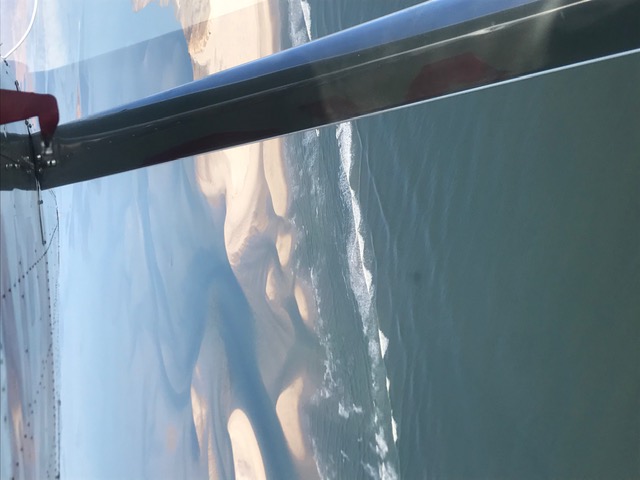 |
Feb 26, 2021 (RG)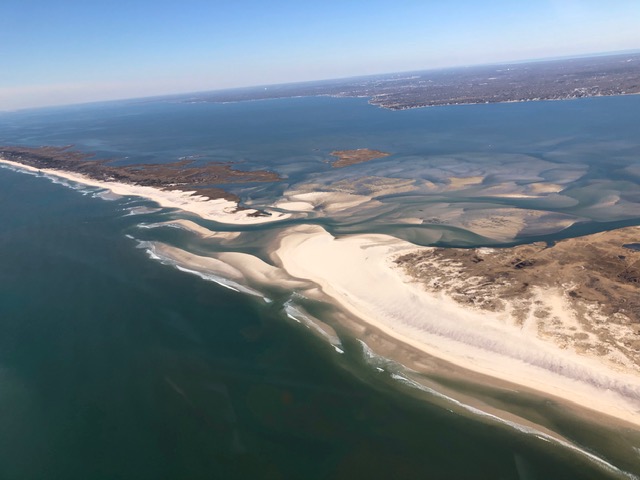 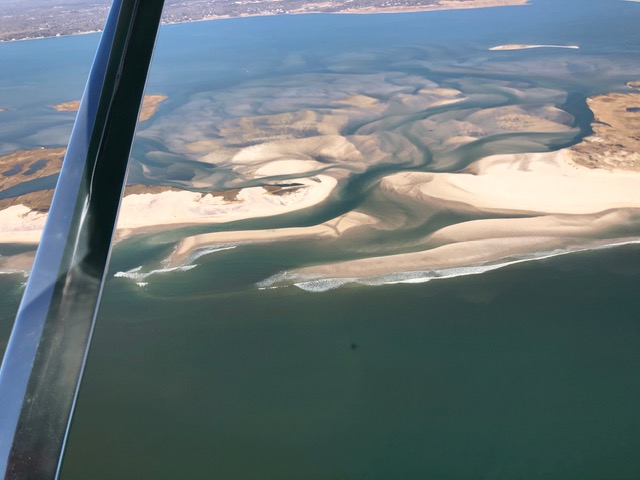 |
Mar 9, 2021 (CF) 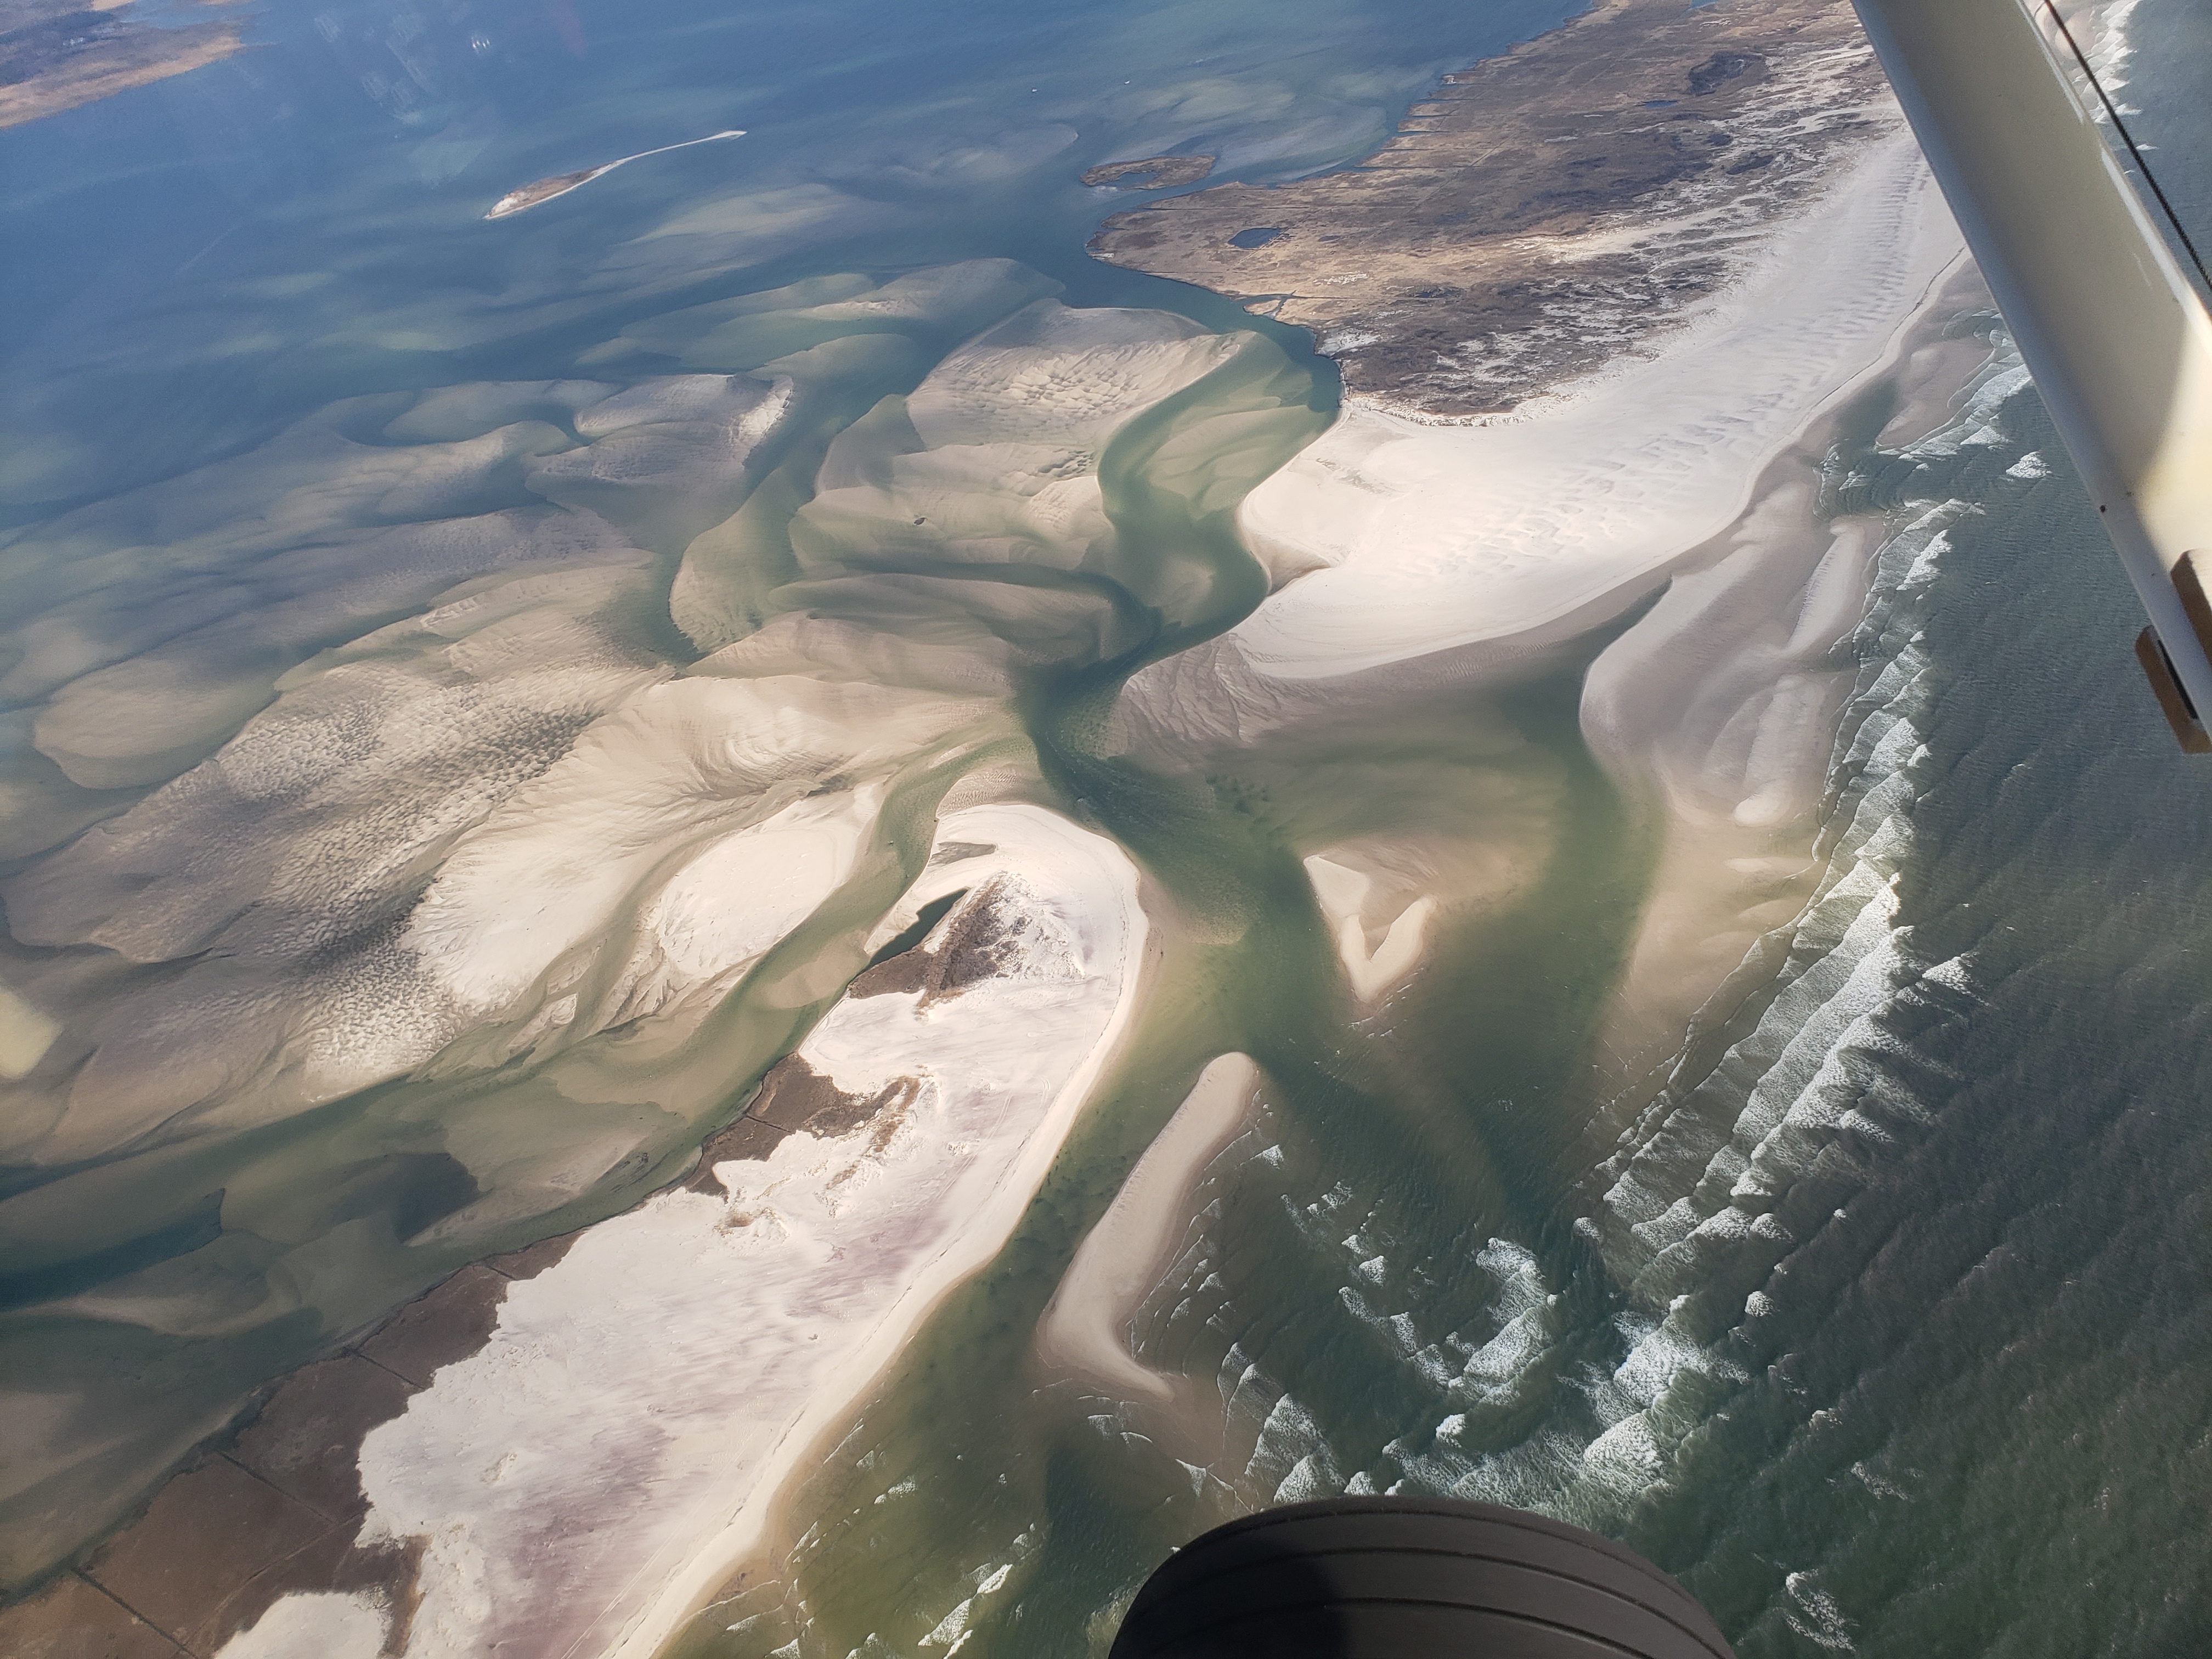 |
||||
Mar 10, 2021 (JV) 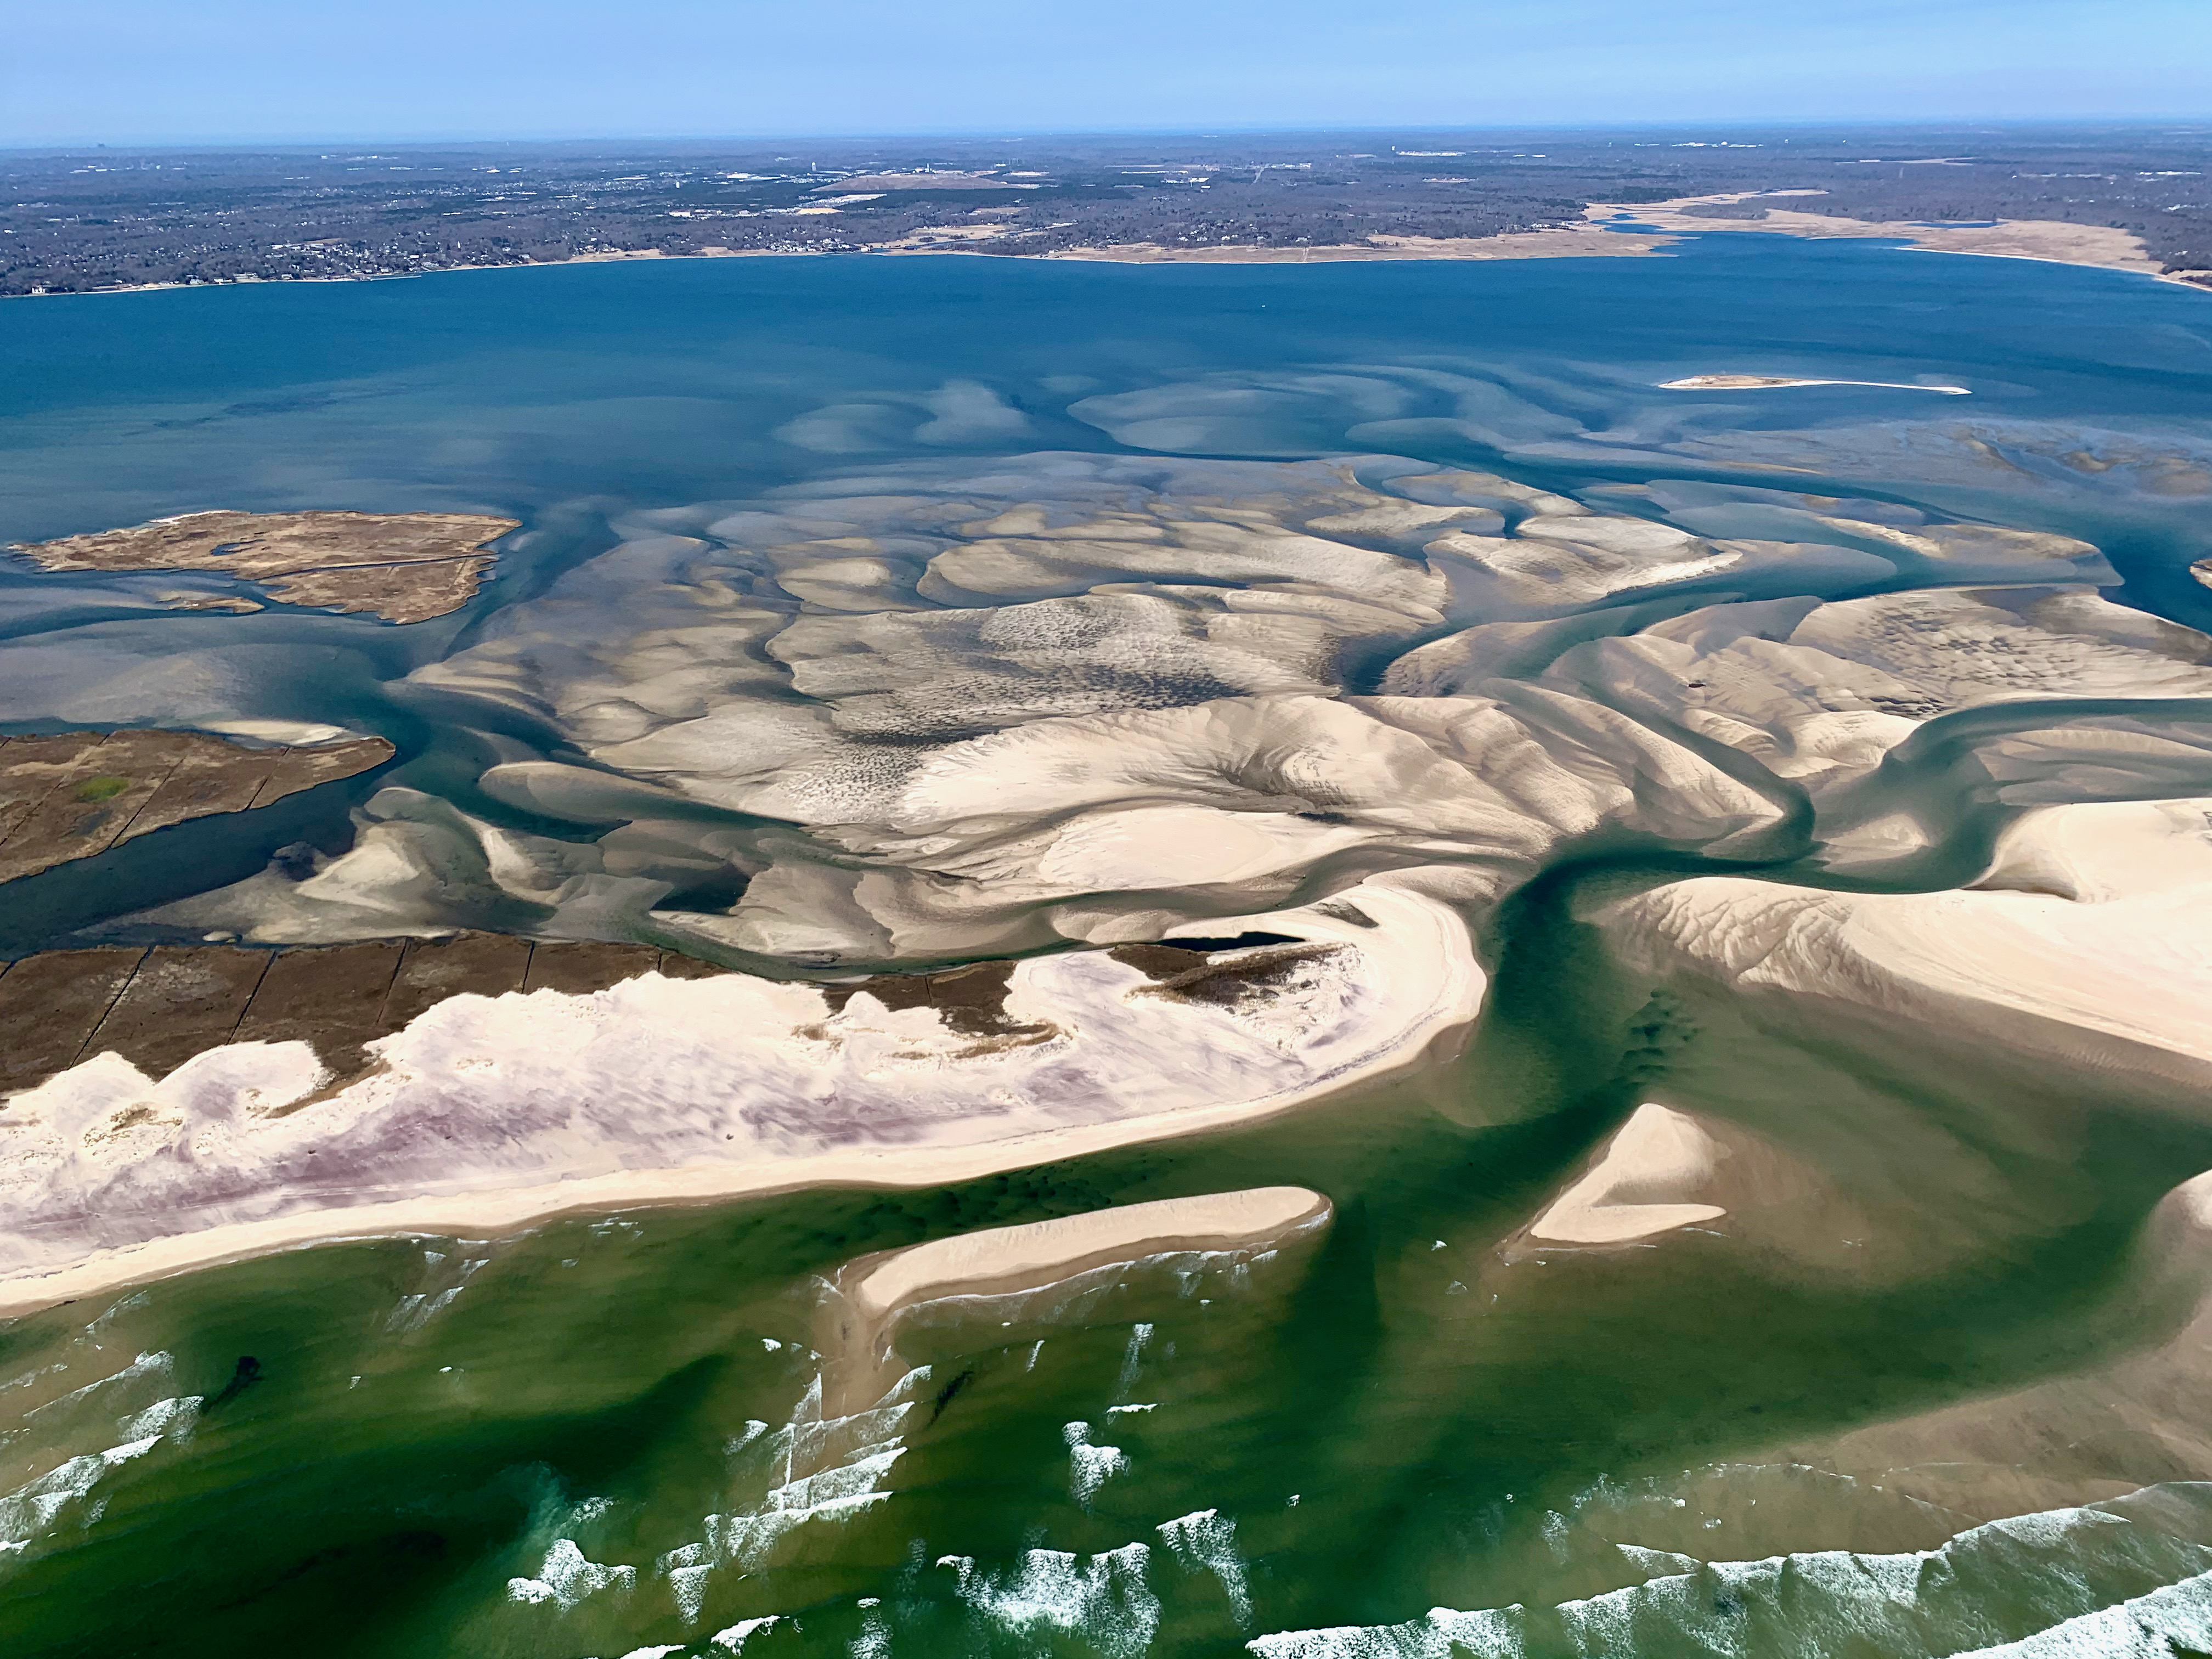 |
Apr 18, 2021 (CF)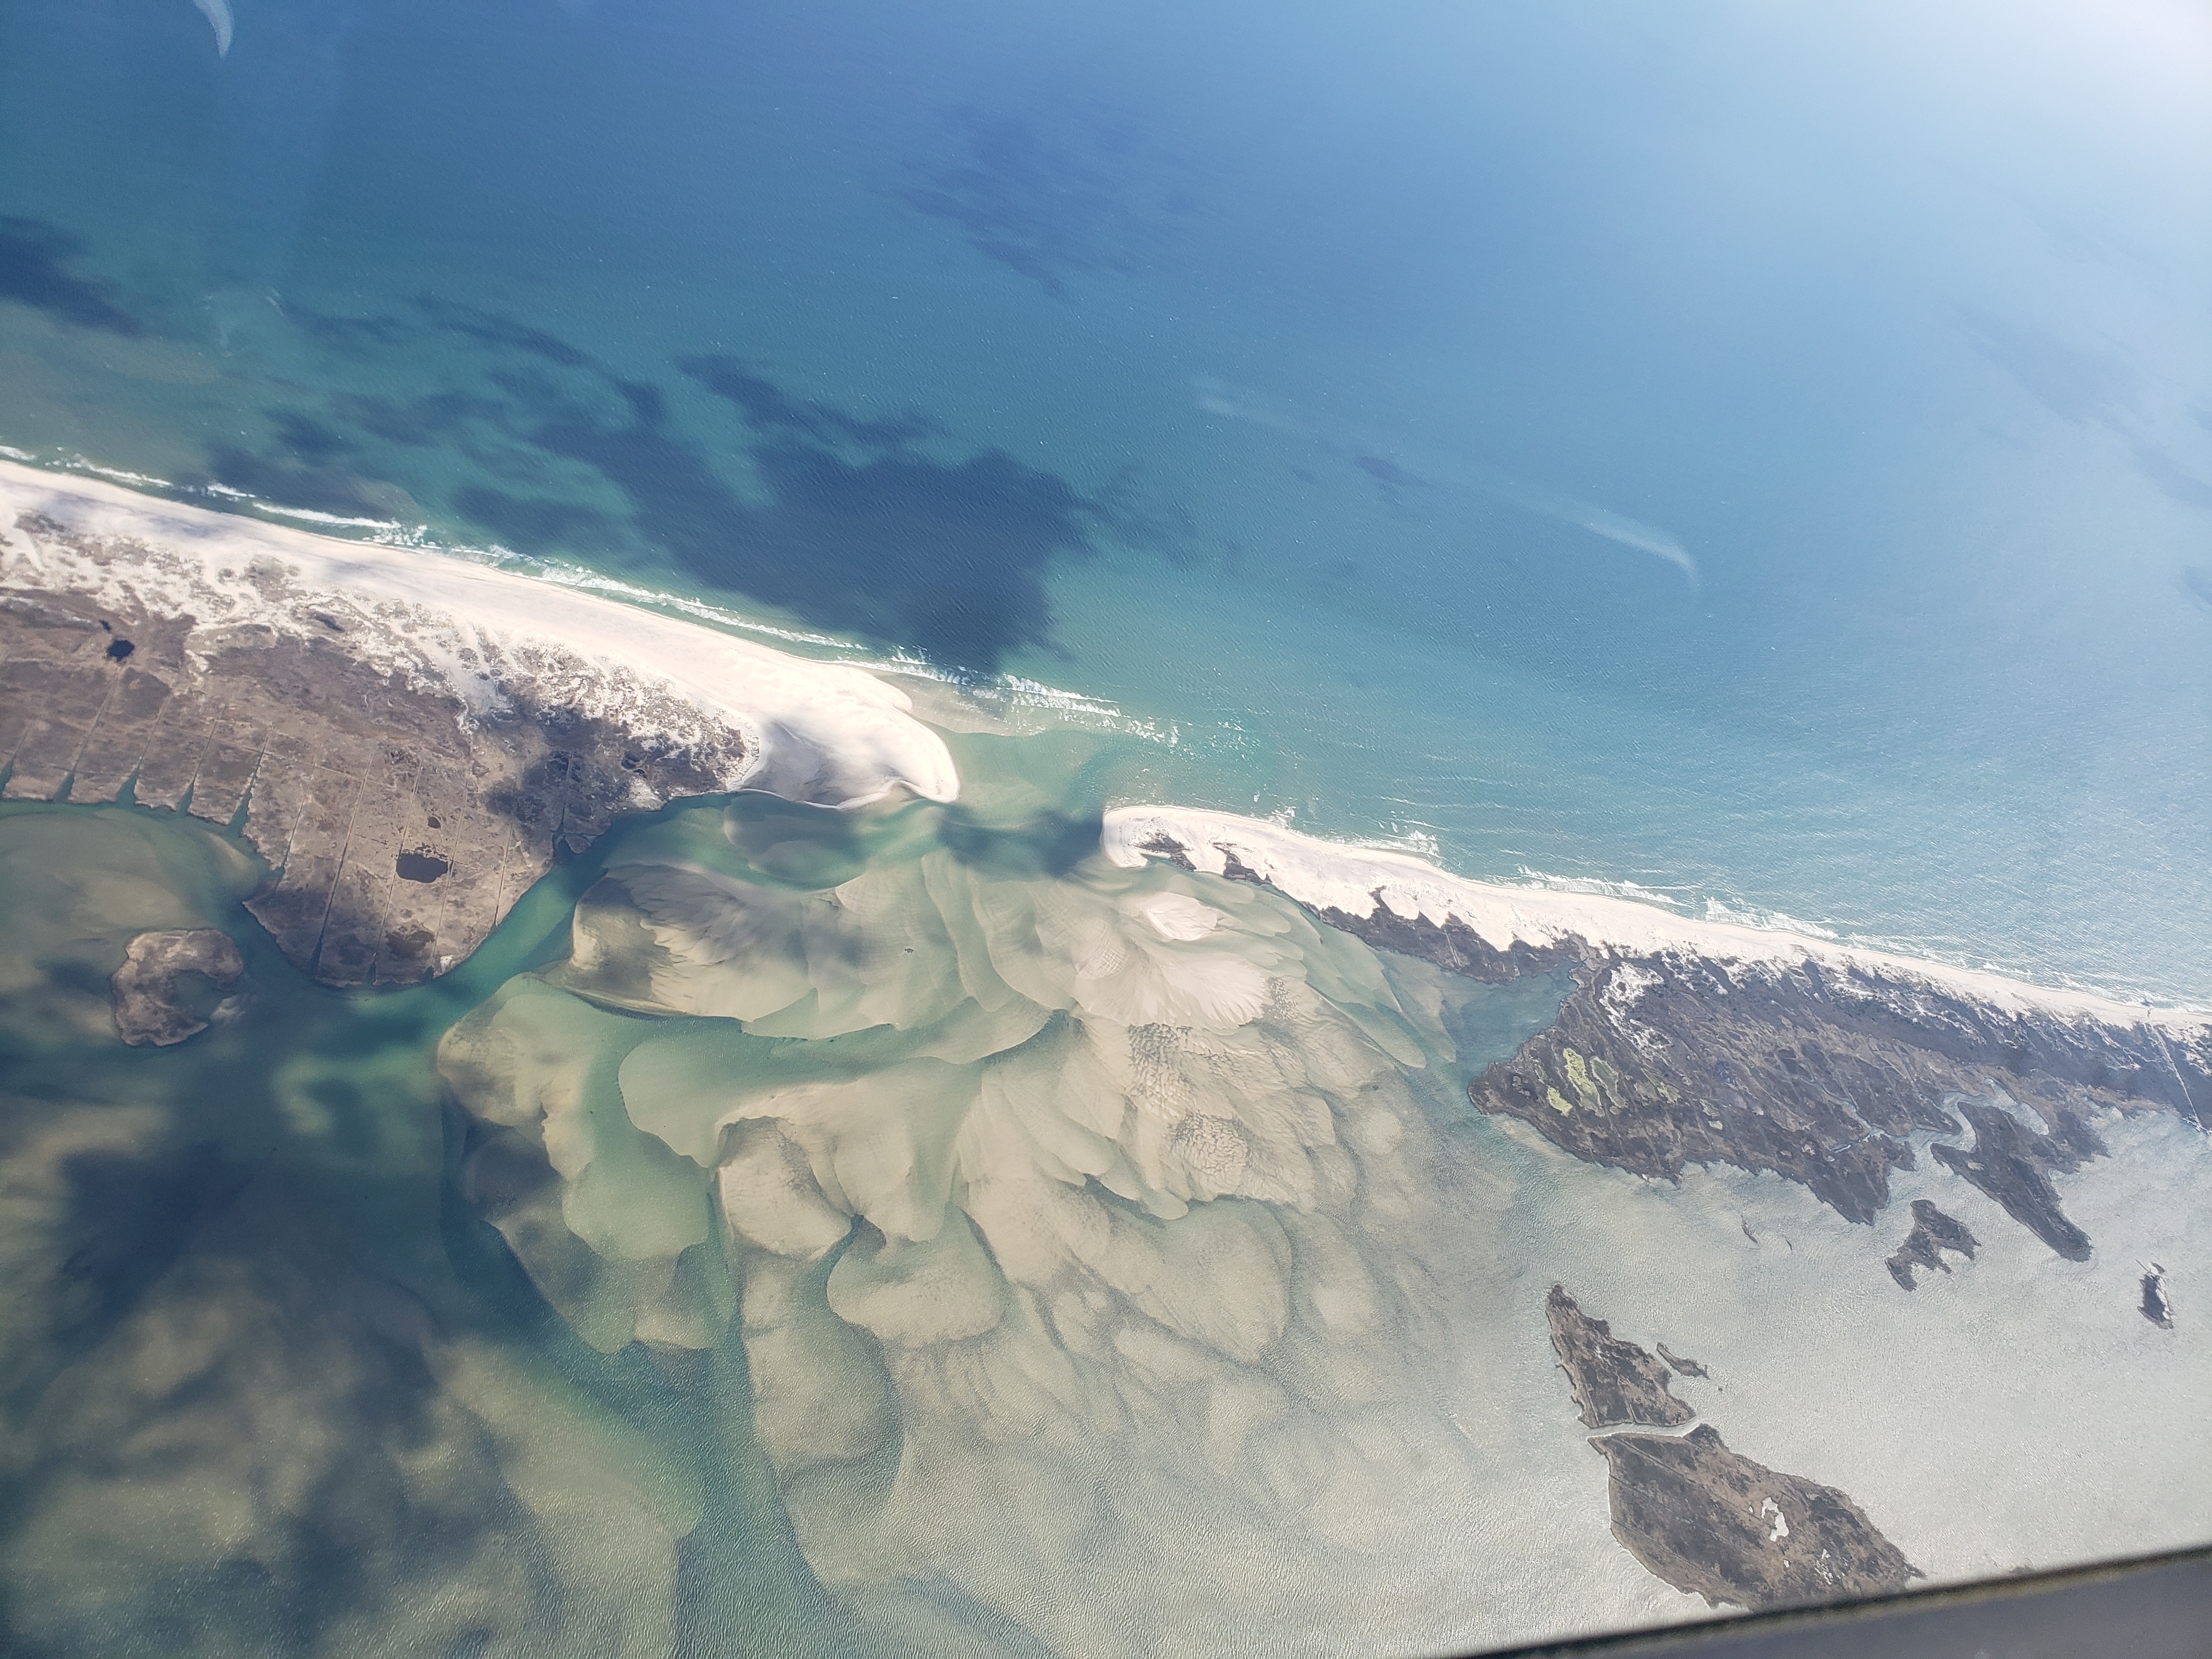 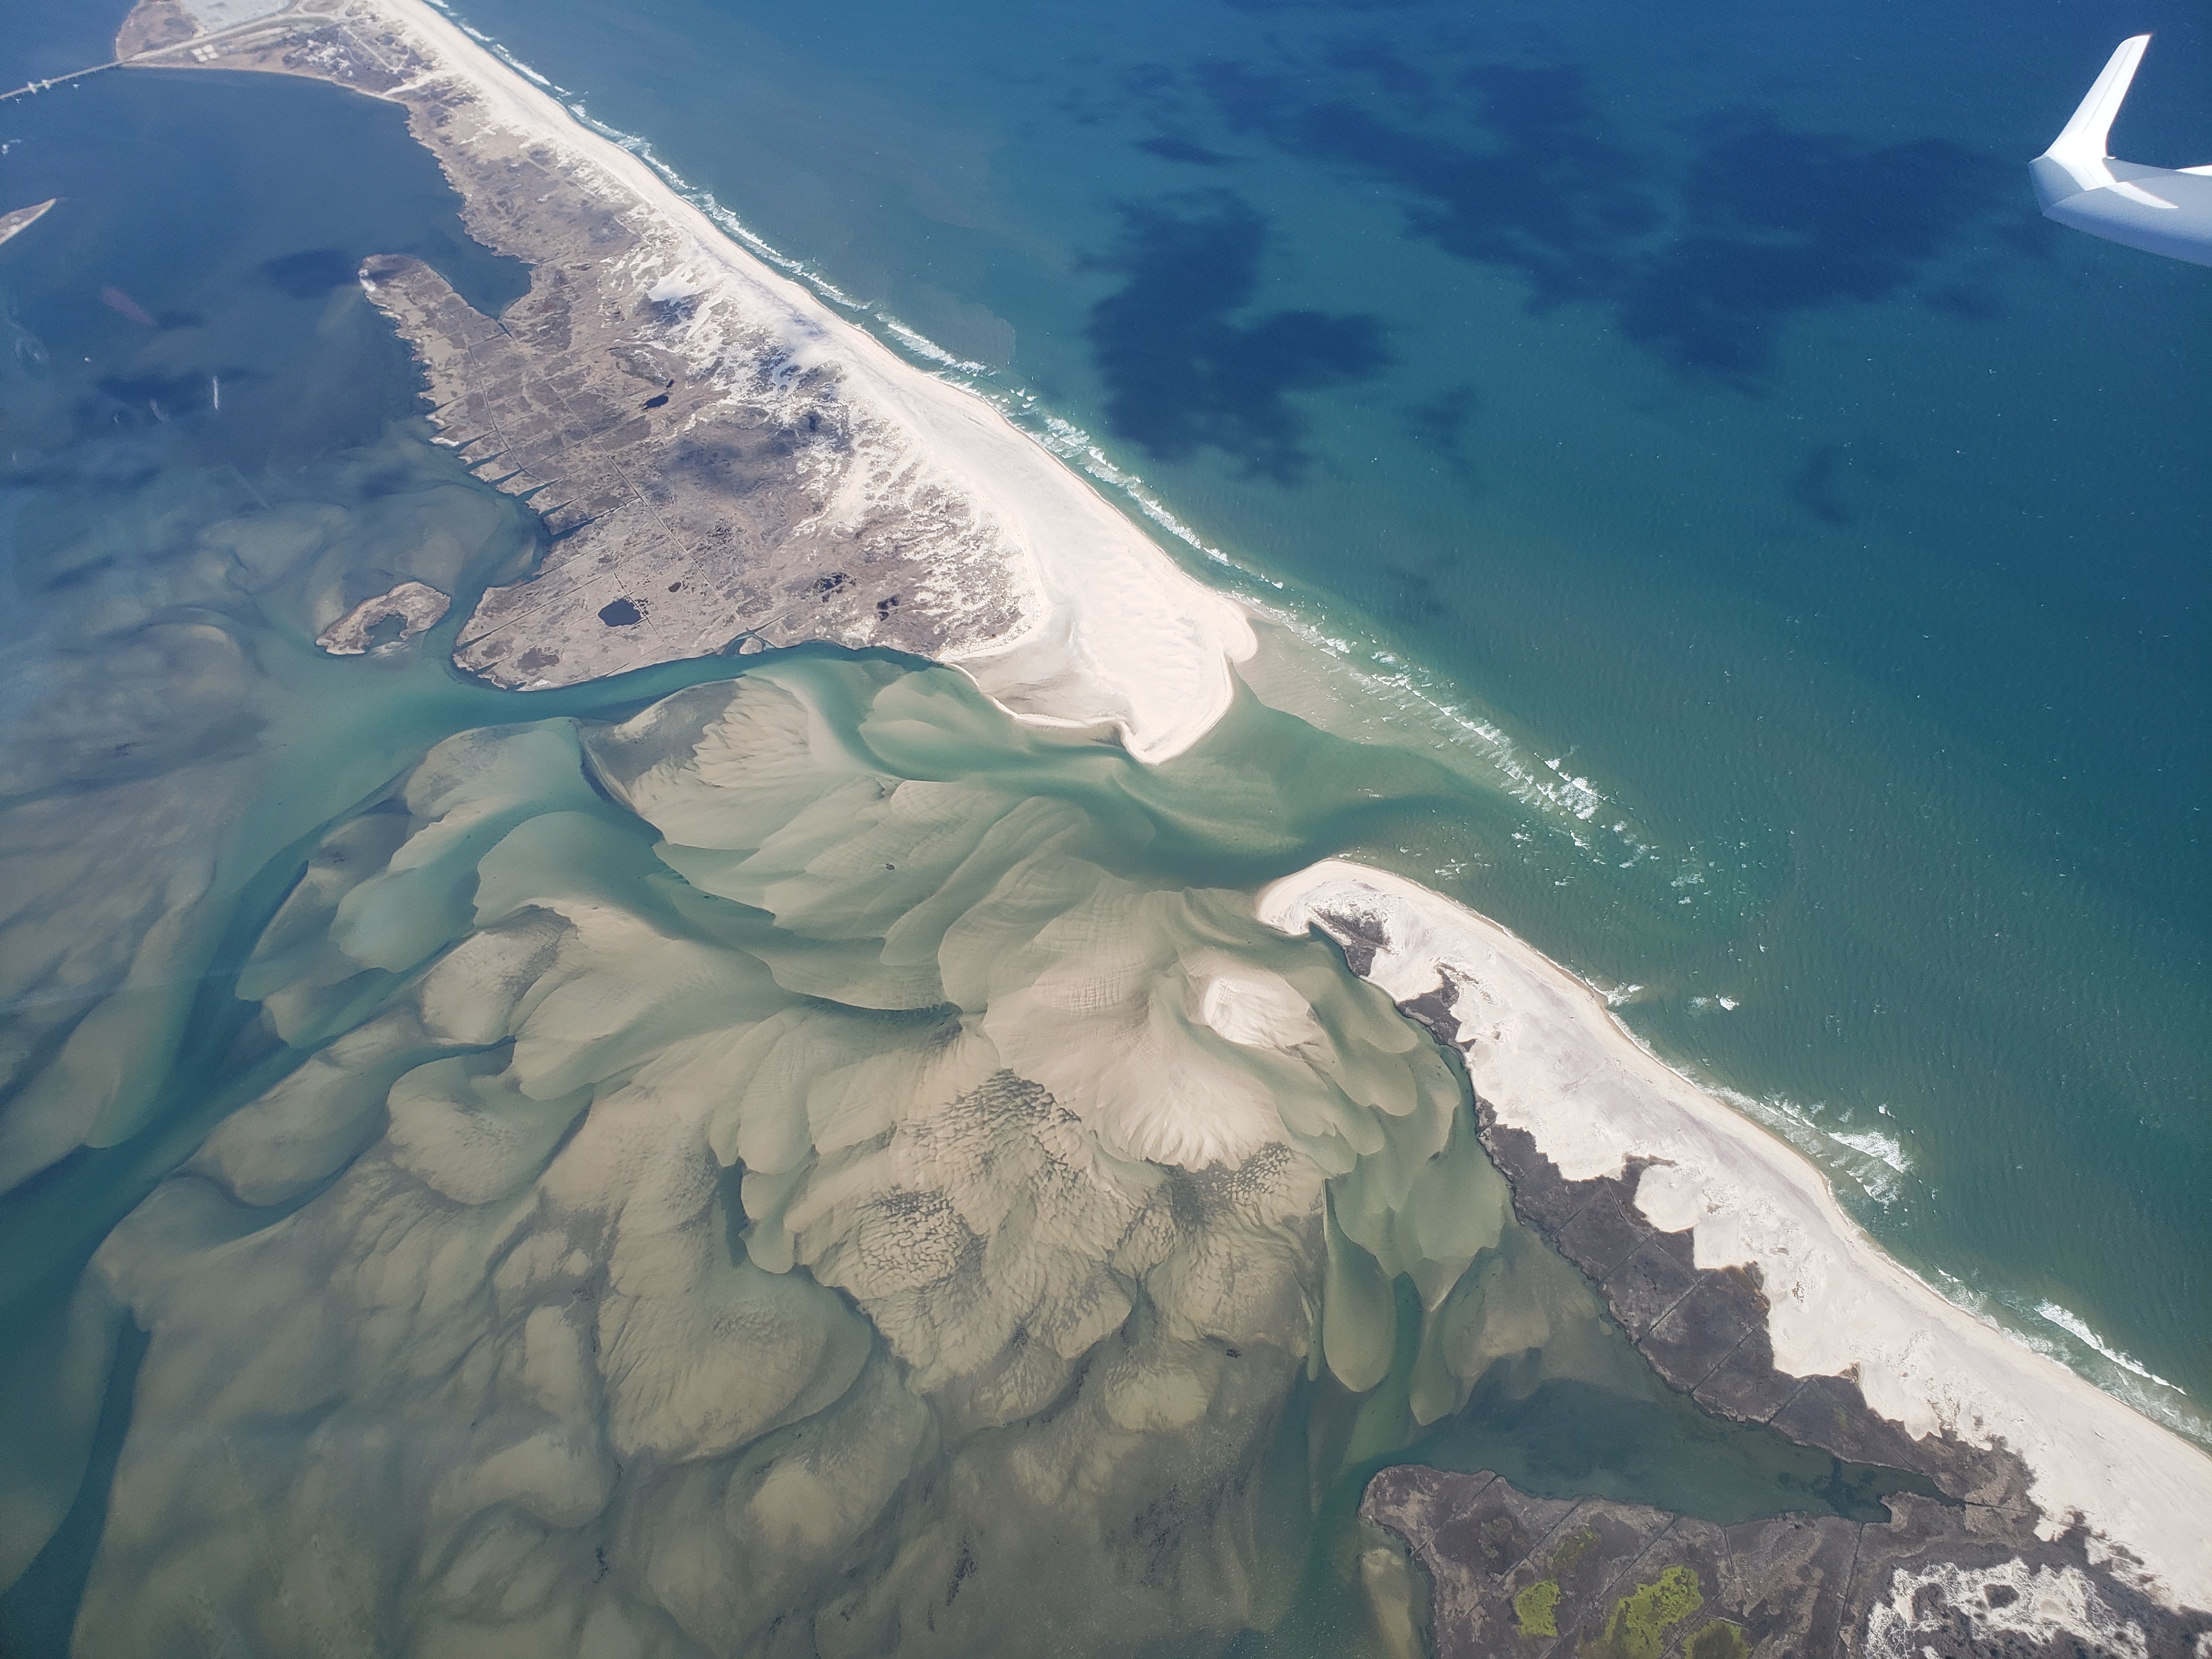 |
Sept 4, 2021 (CF)  |
Nov 3, 2021 (RG)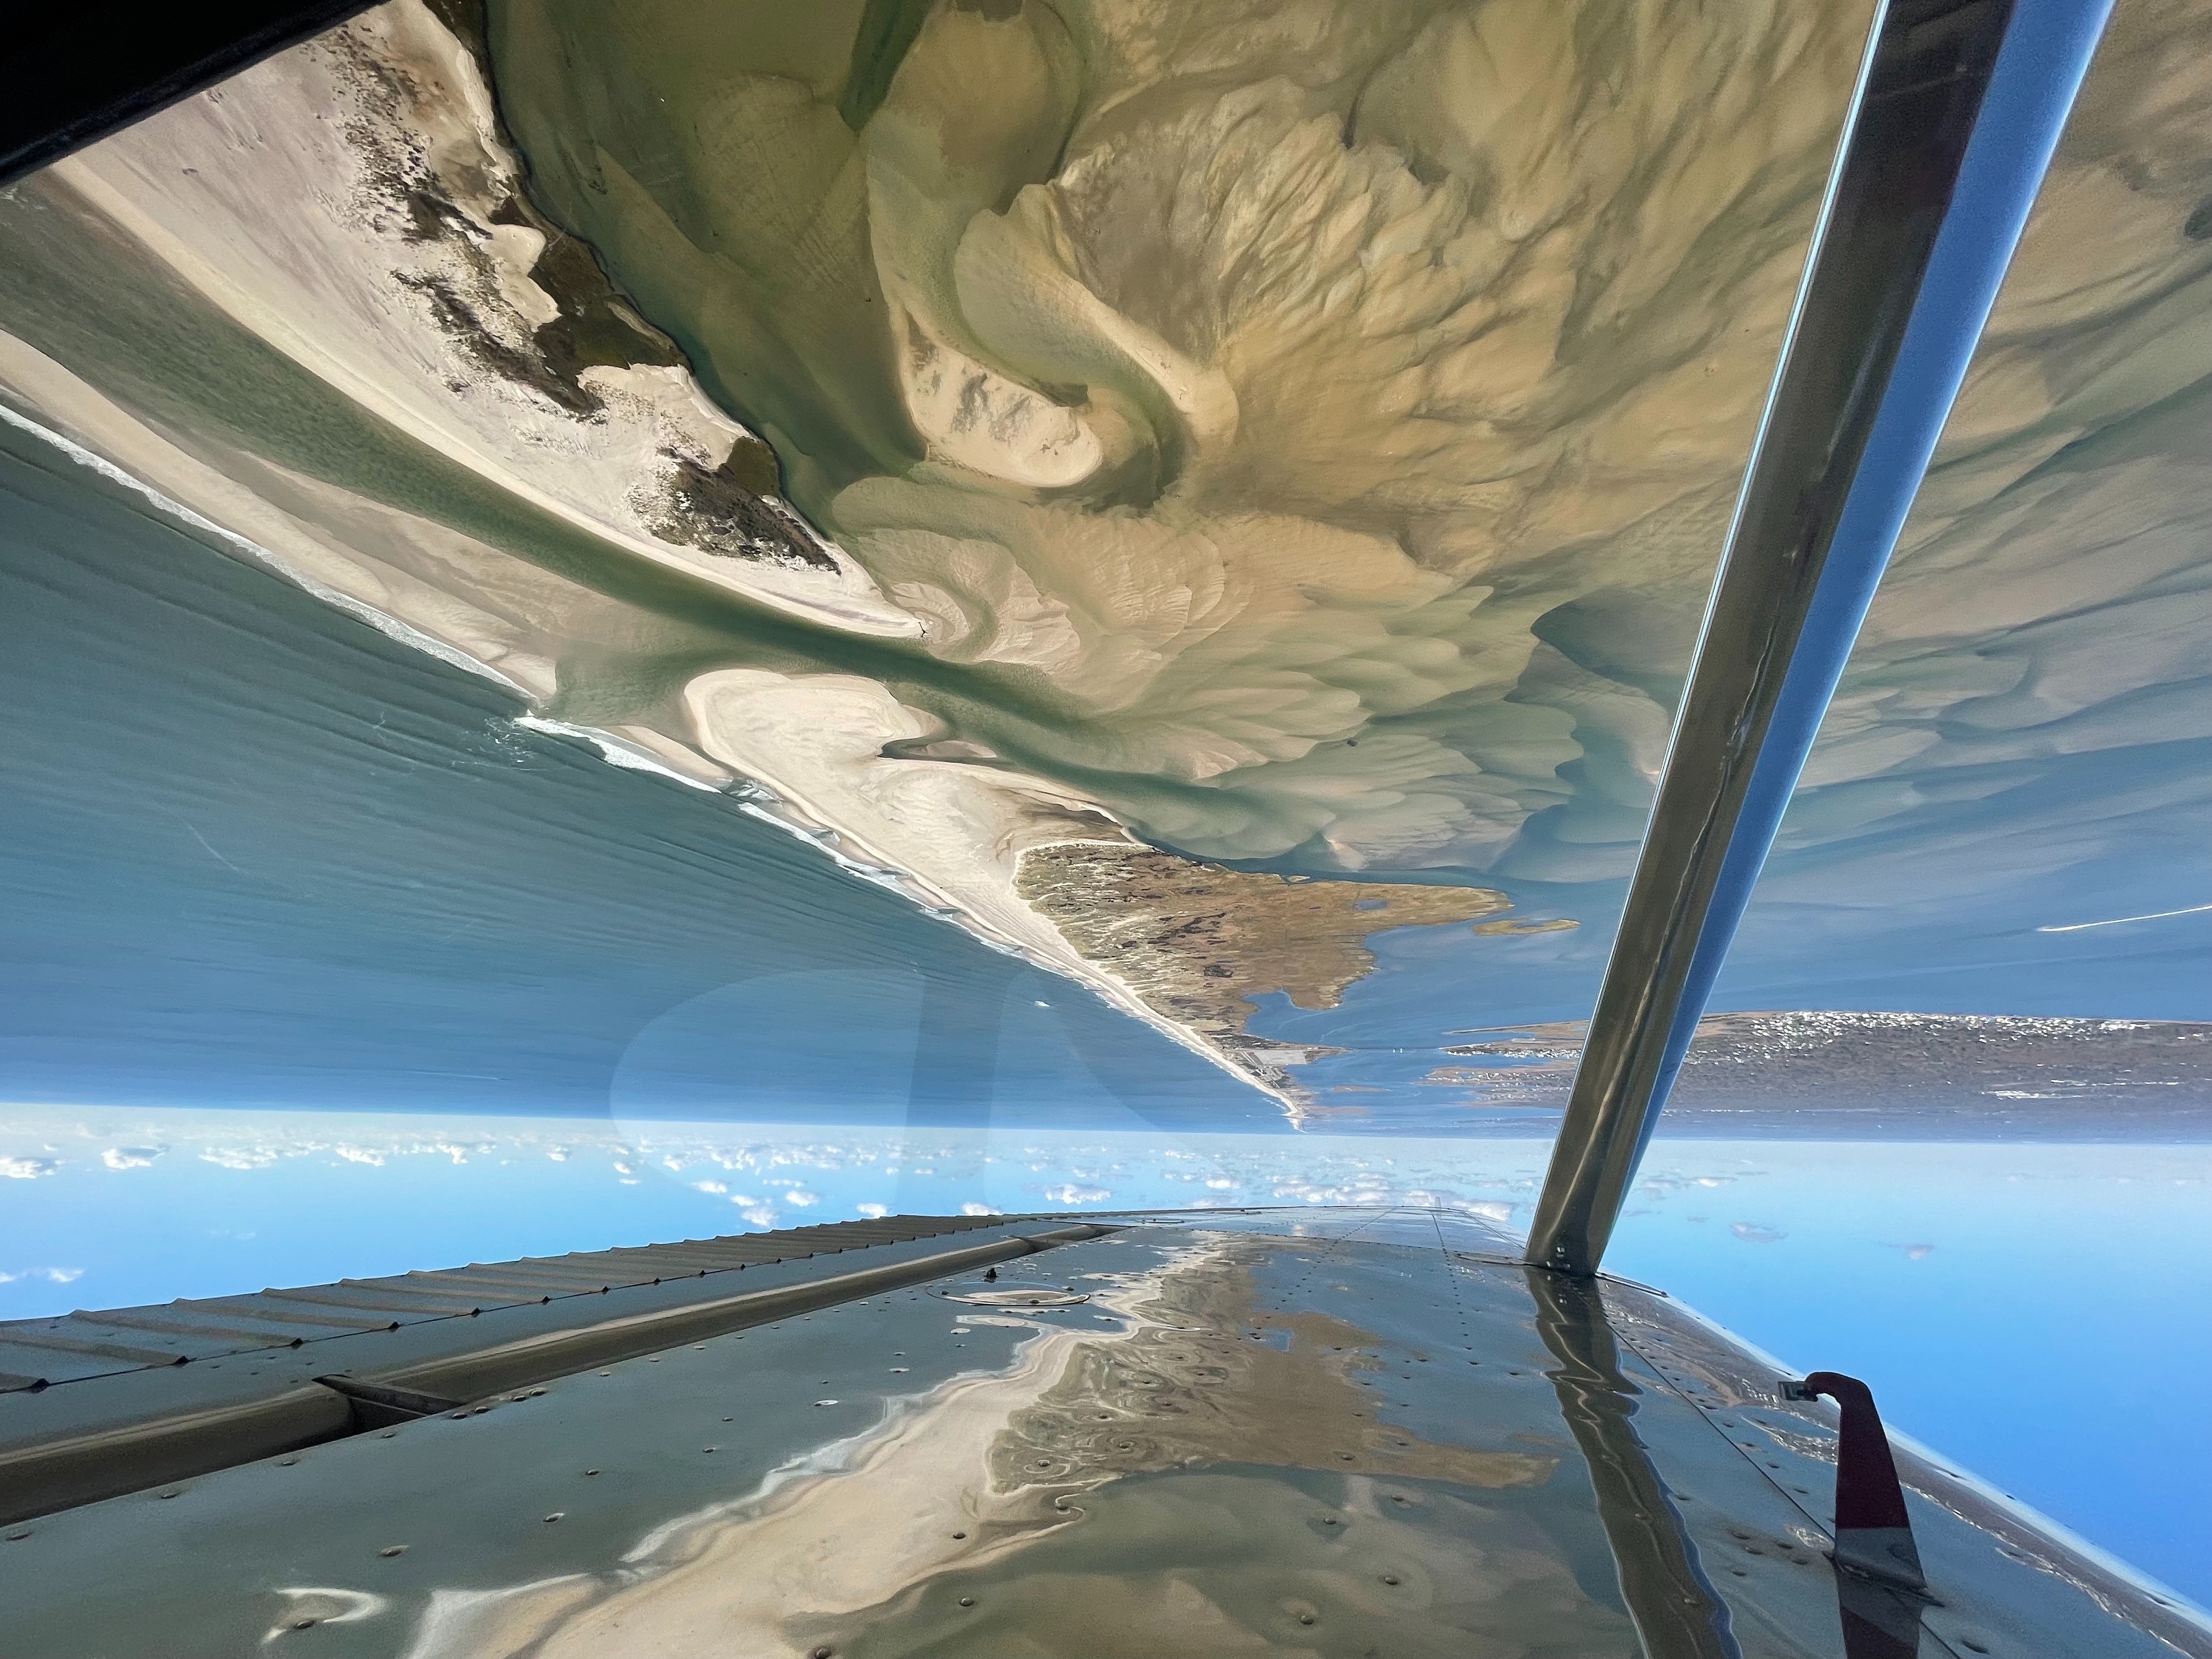 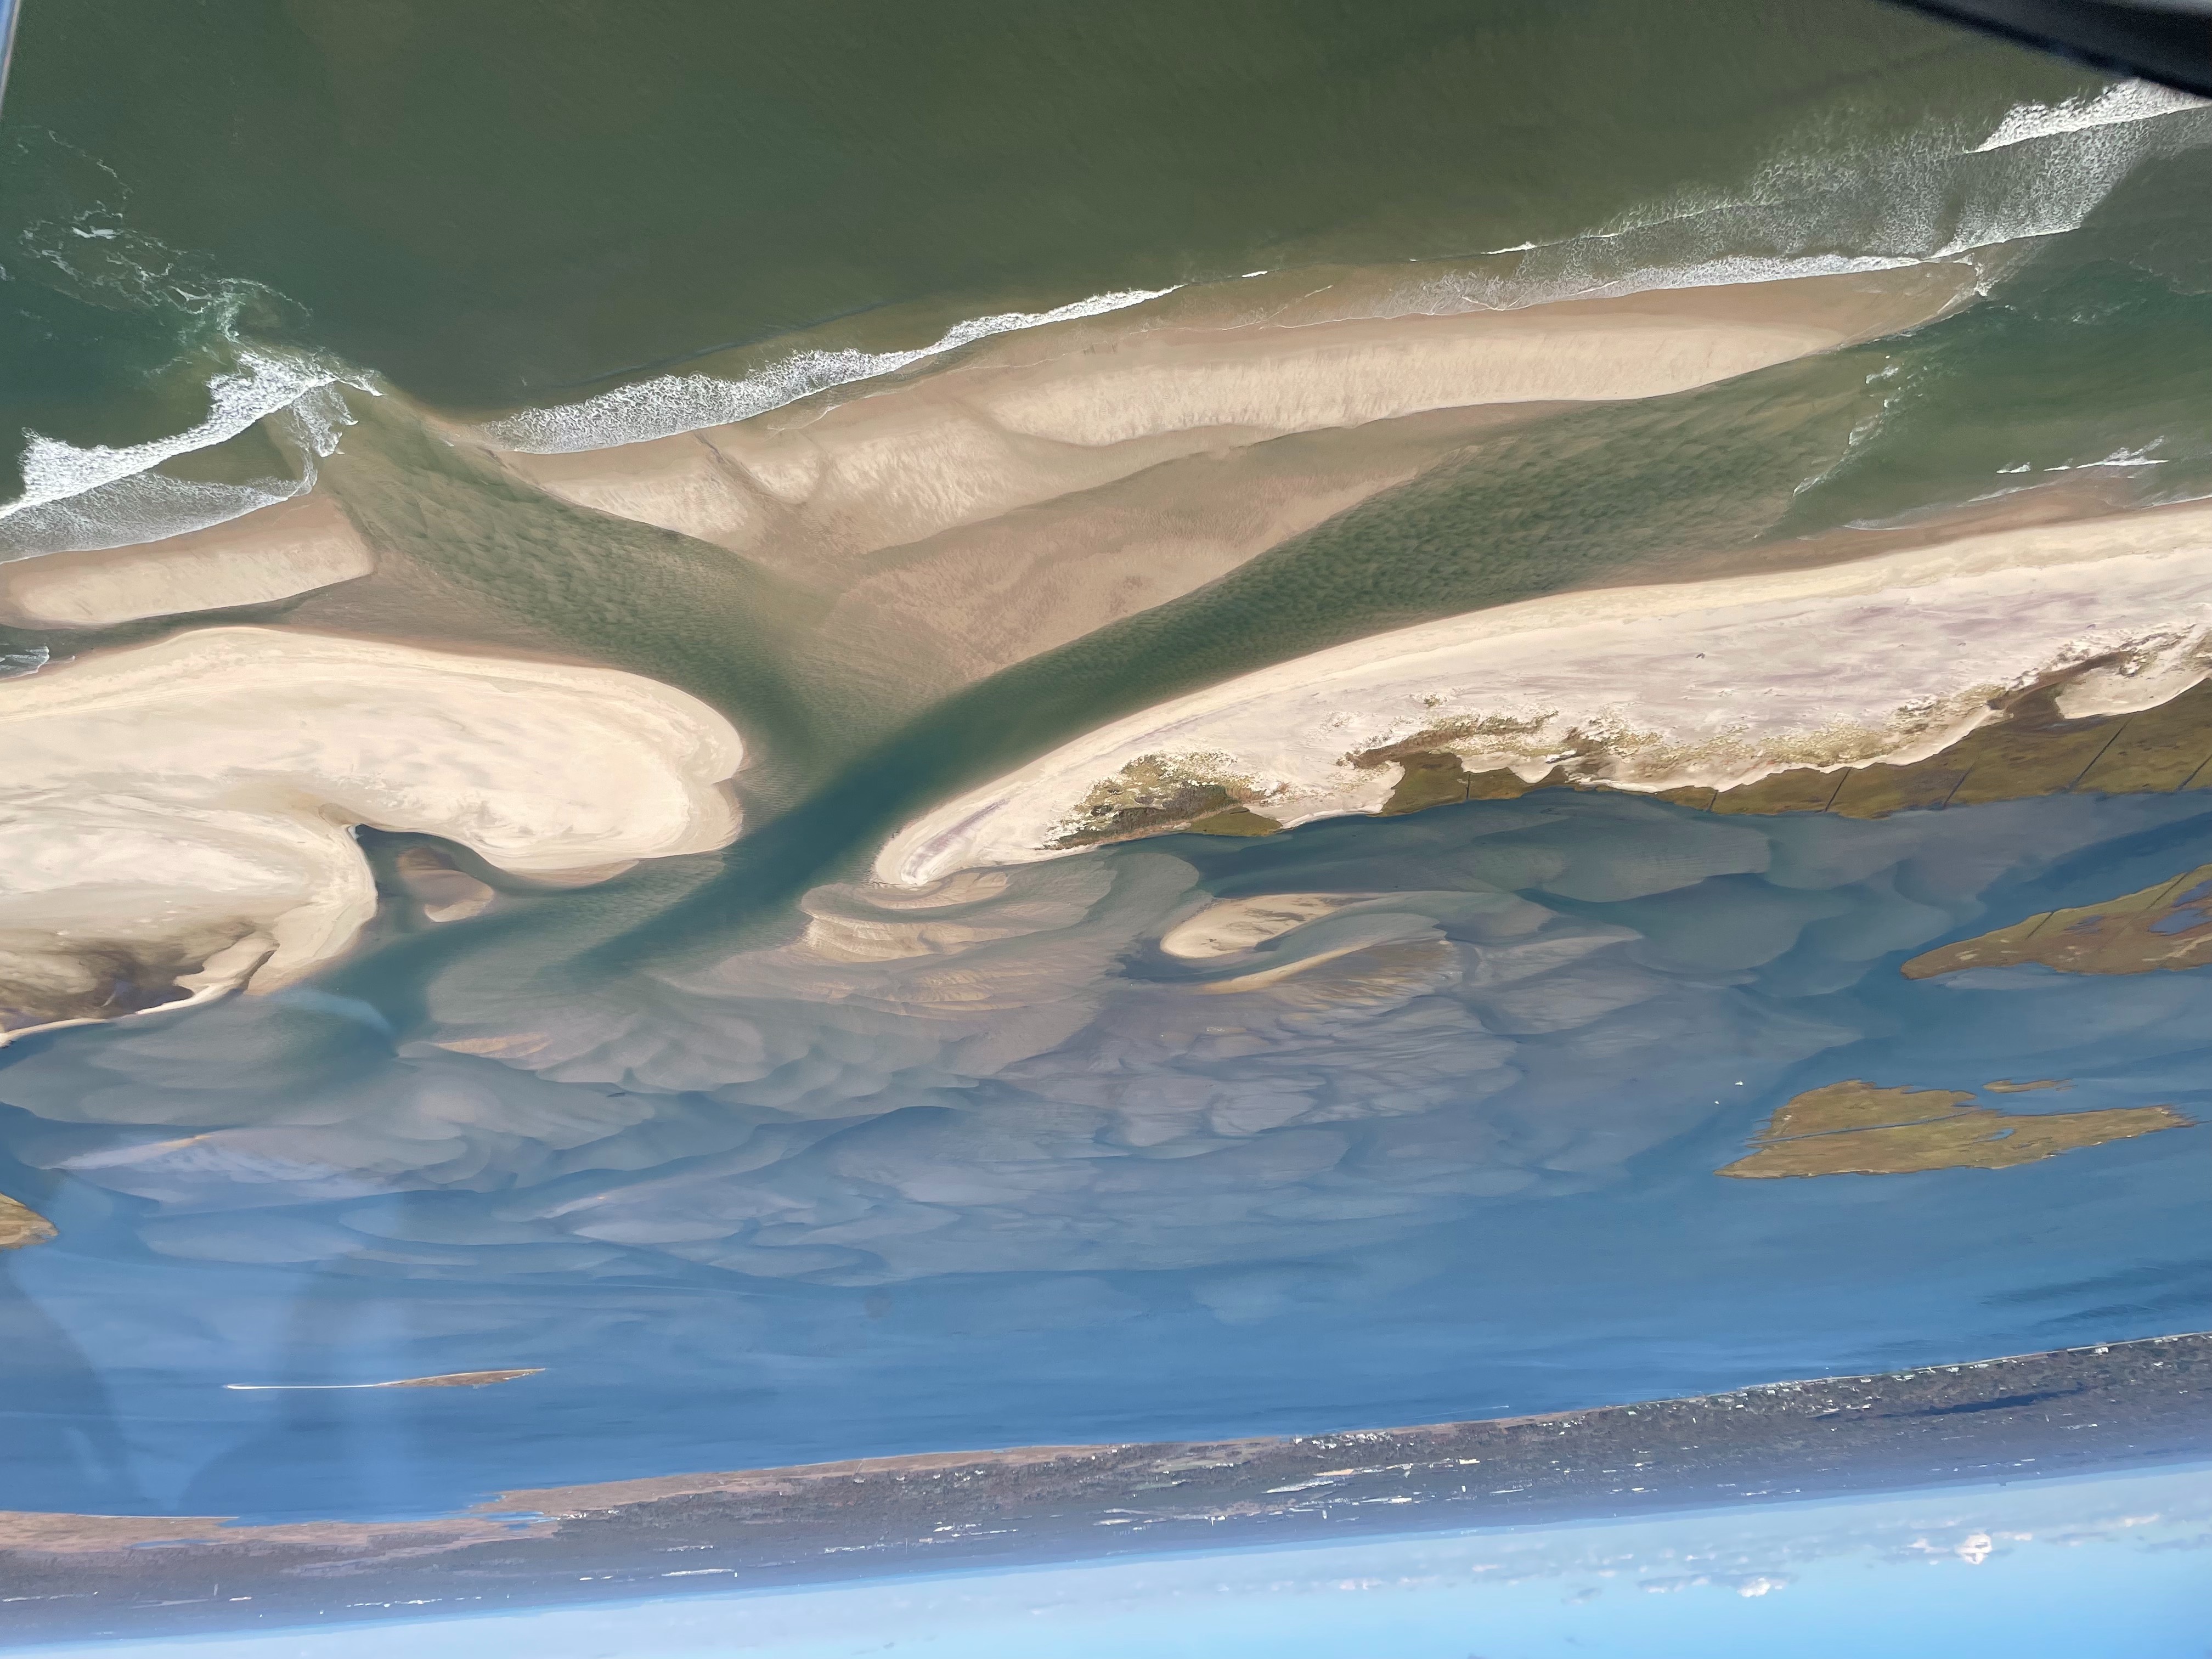 |
||||
Nov 20, 2021 (RG)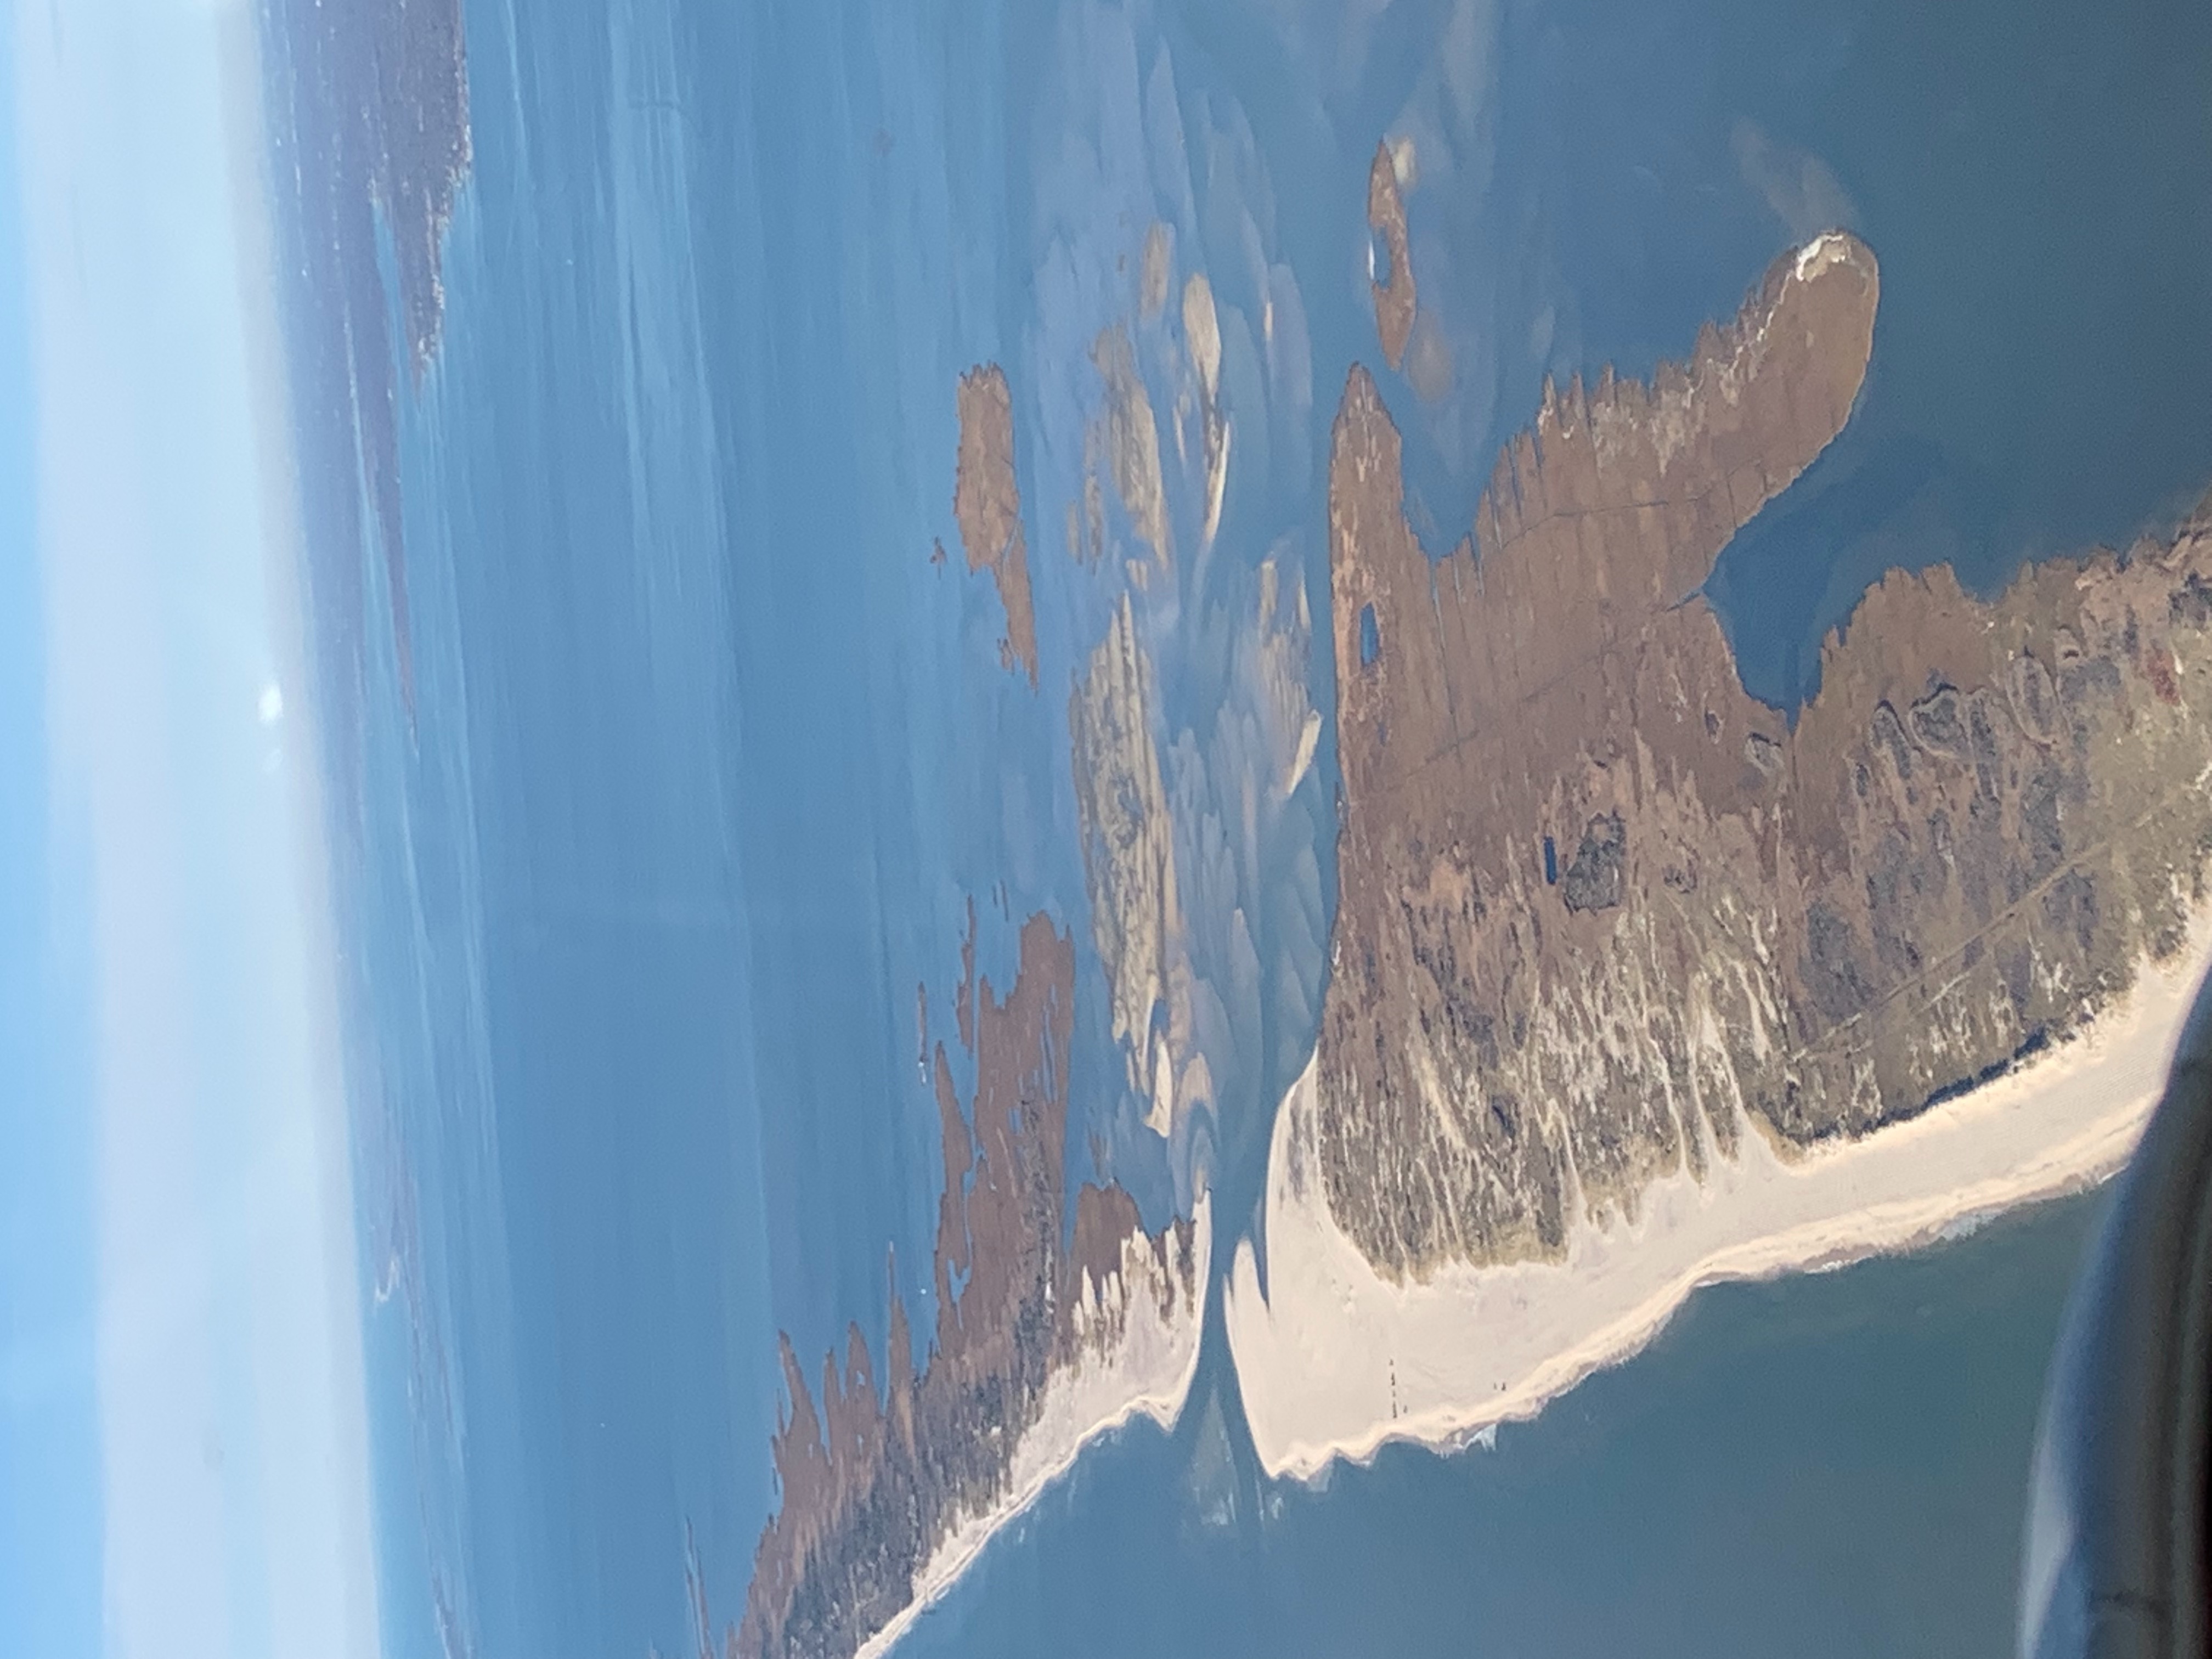 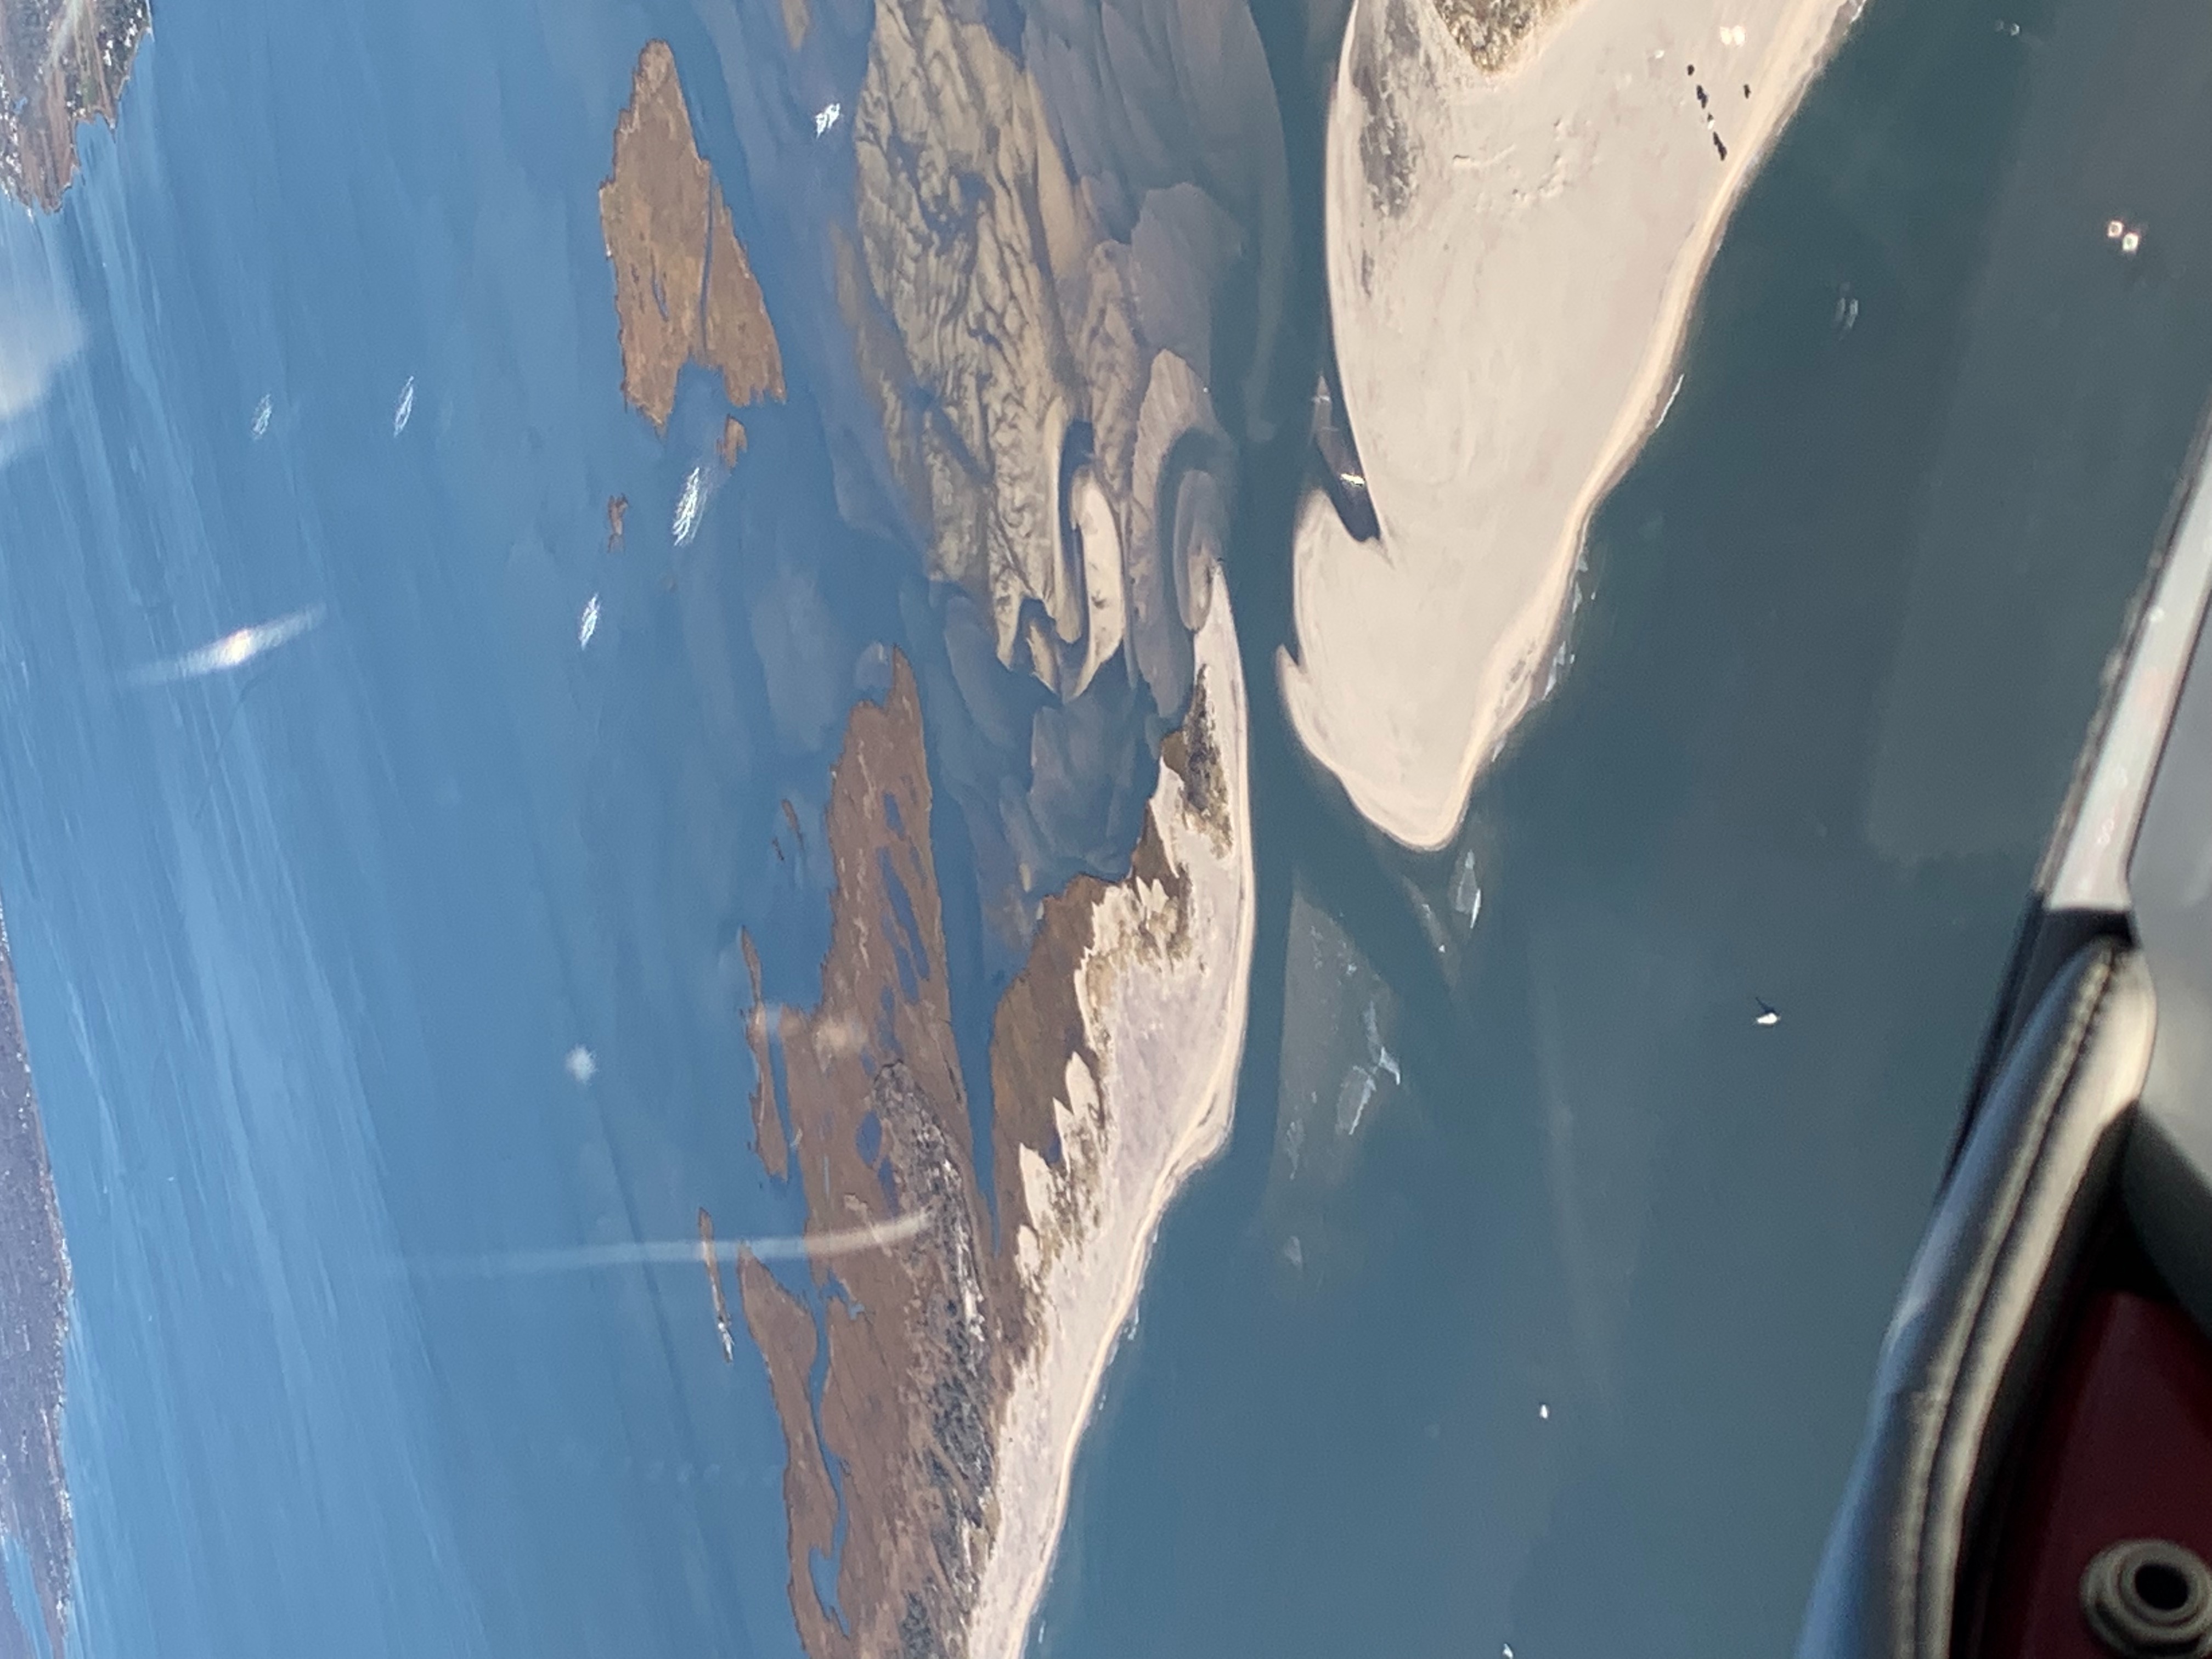 |
Dec 5, 2021 (RG)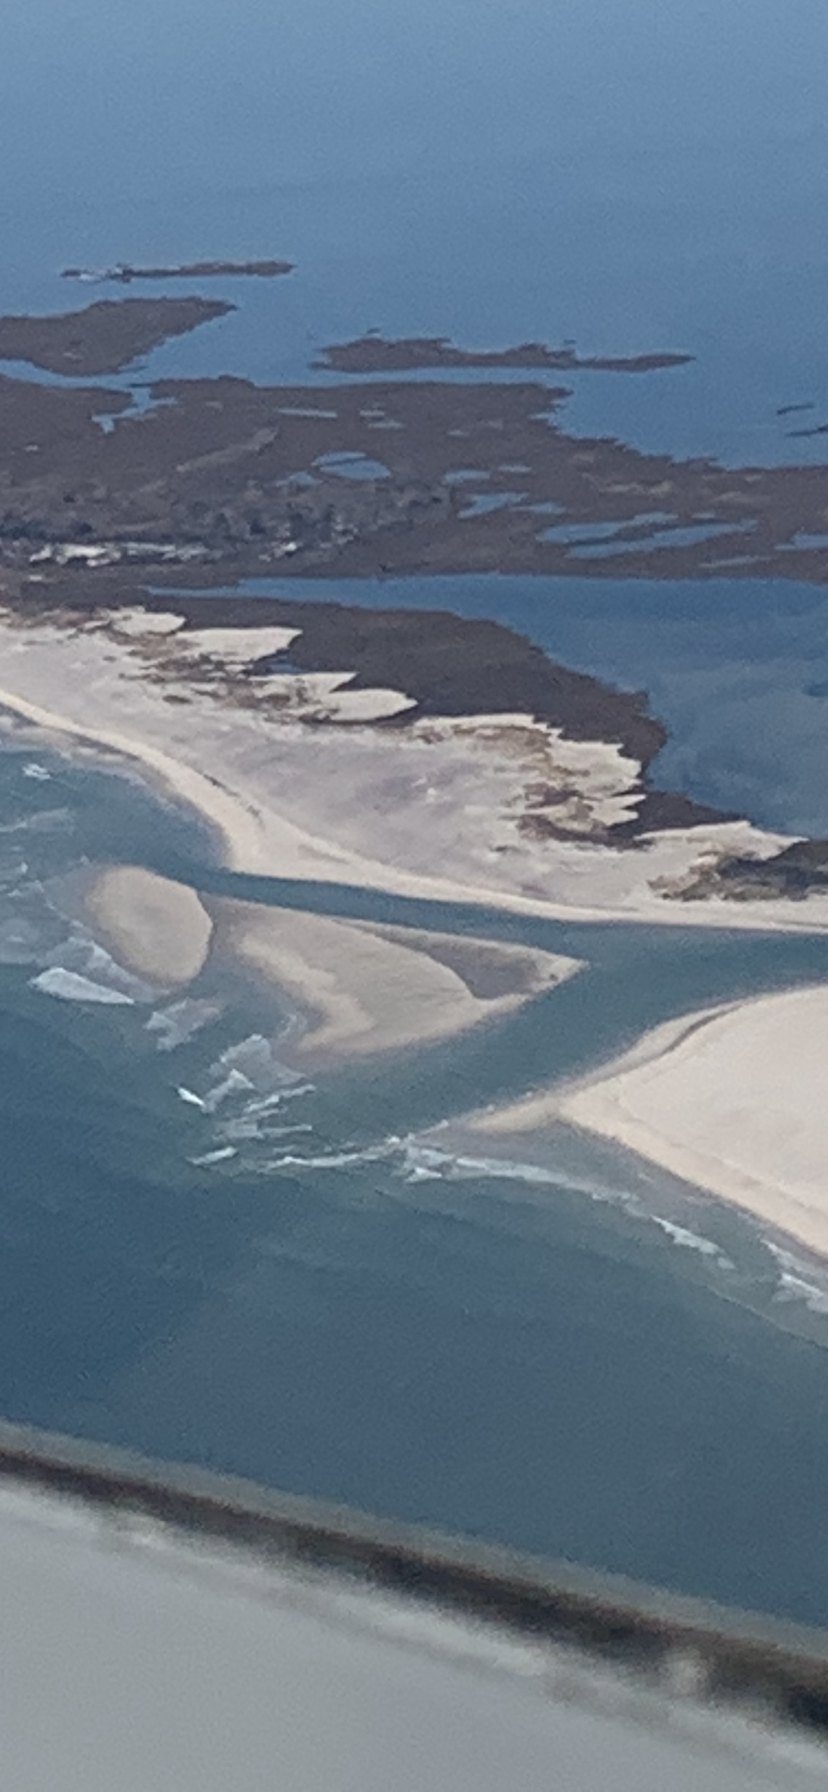 |
Jan 13, 2022 (RG)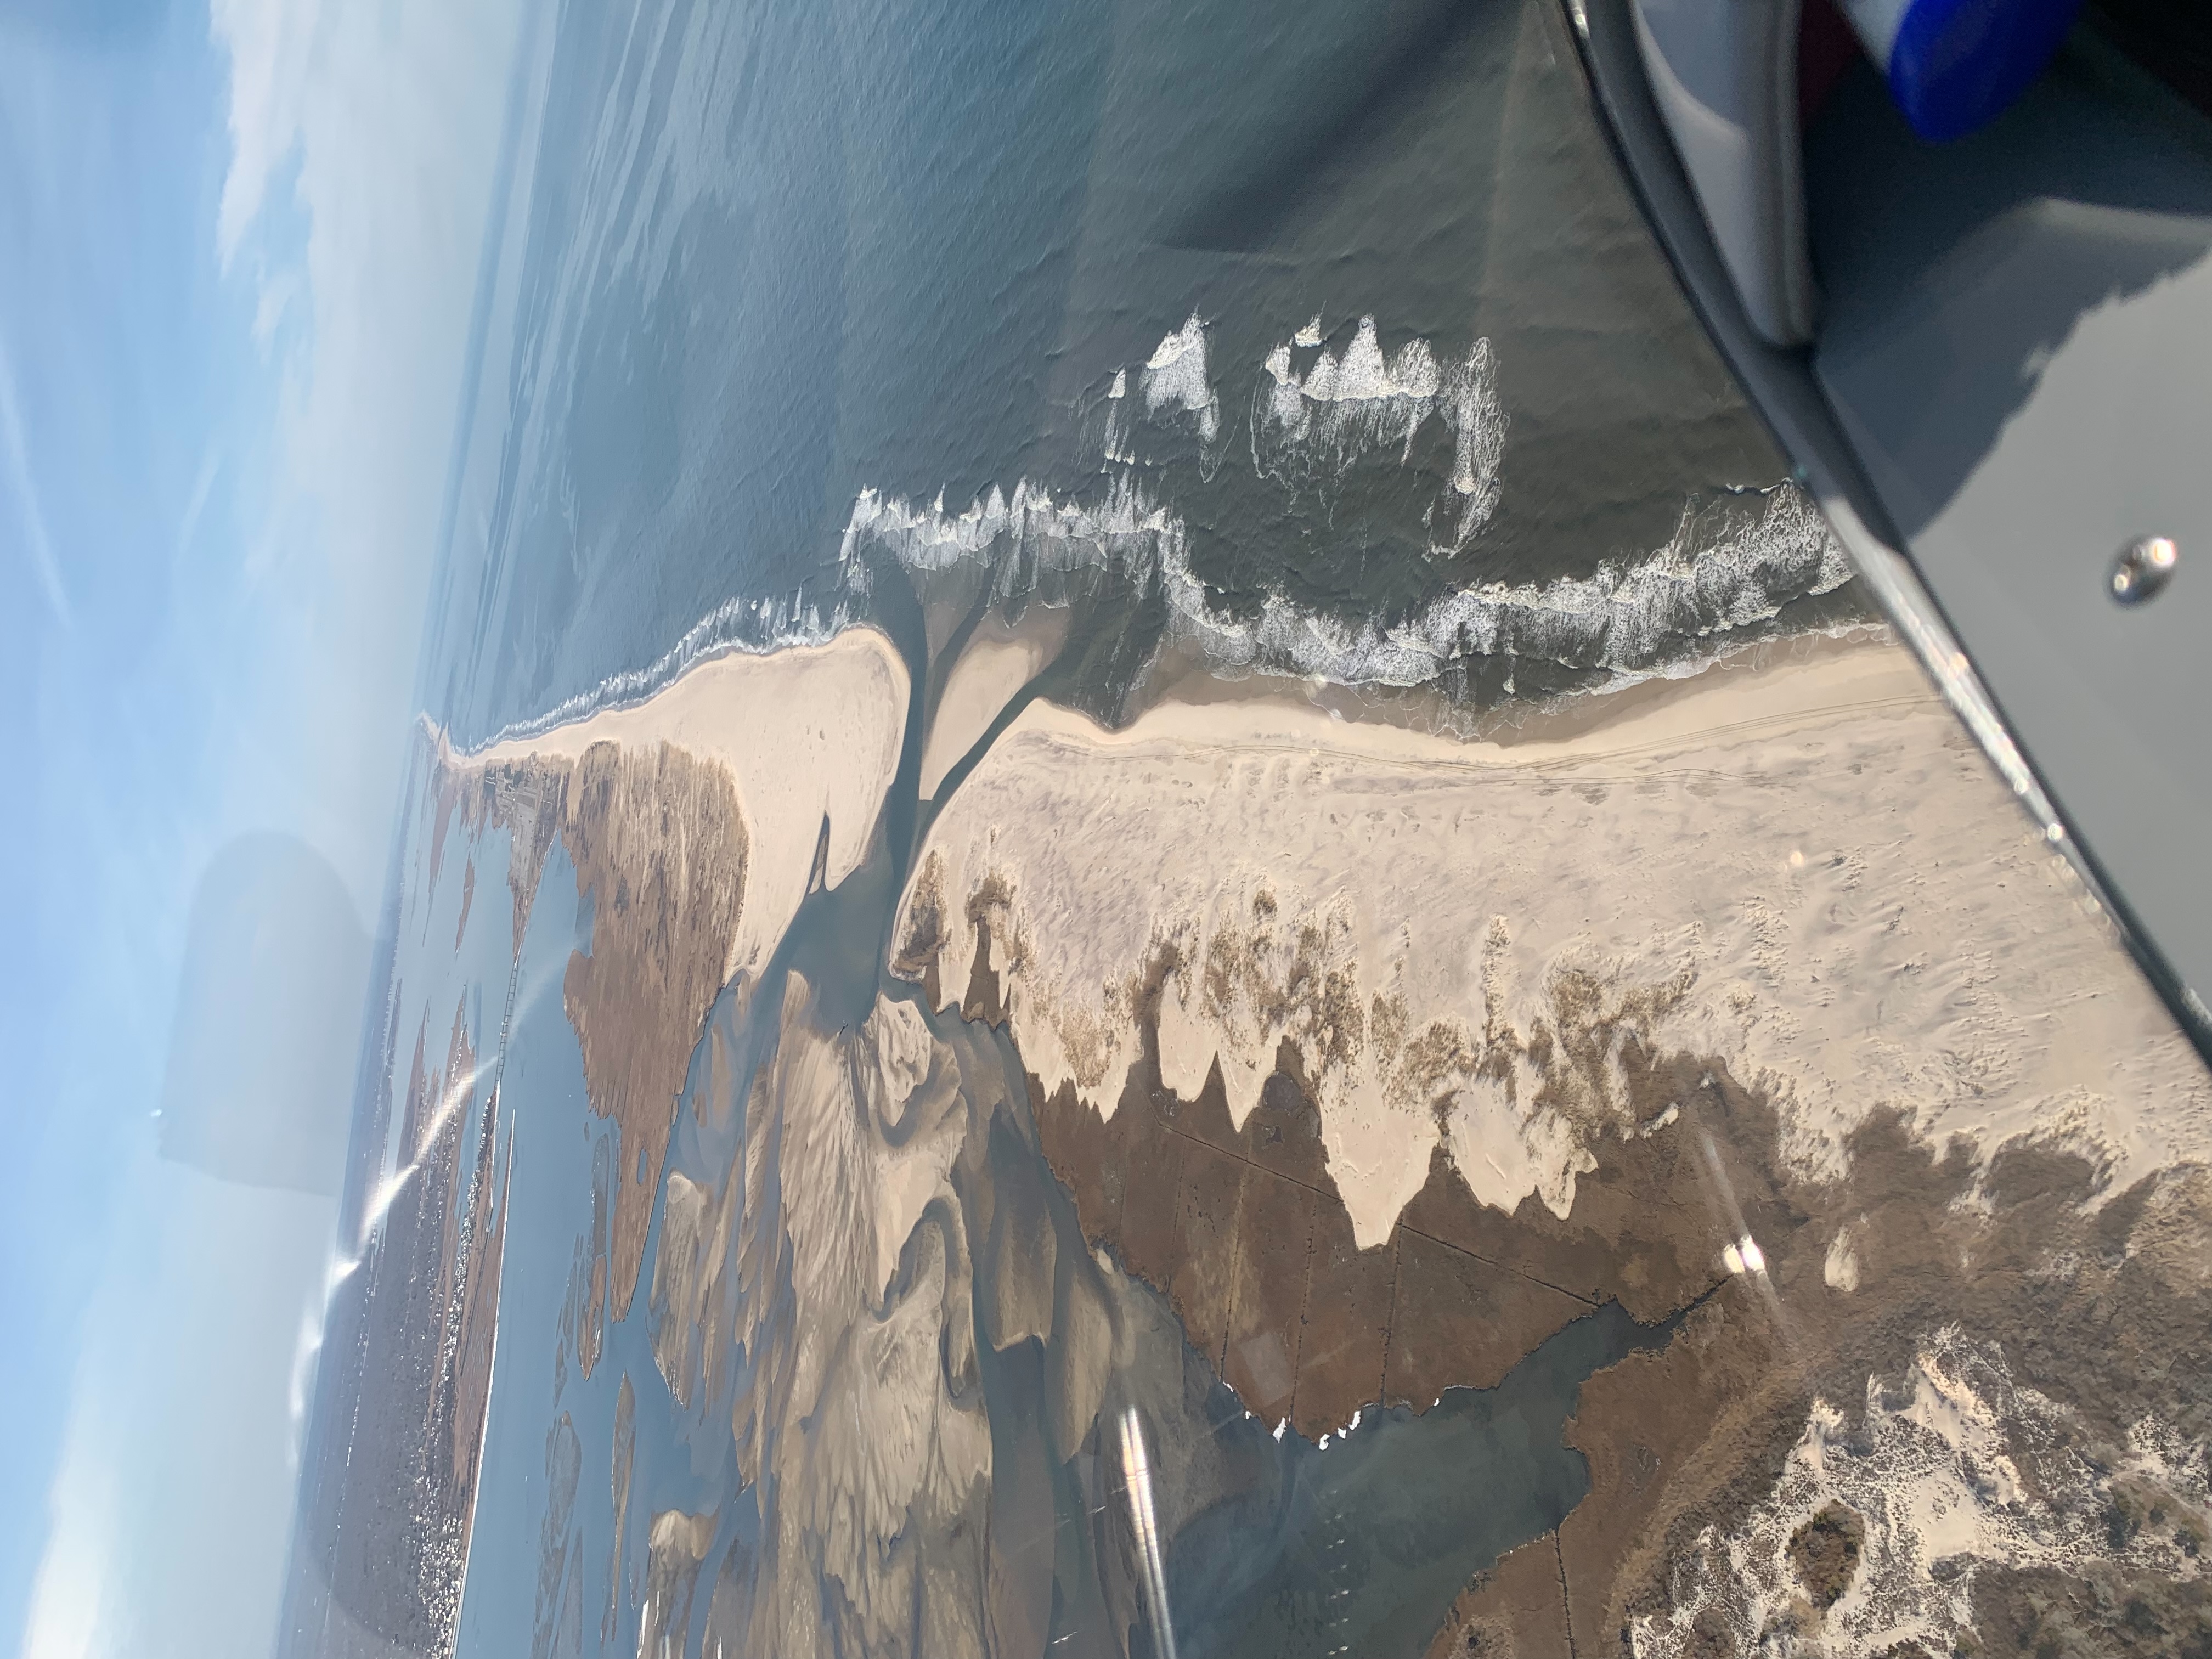 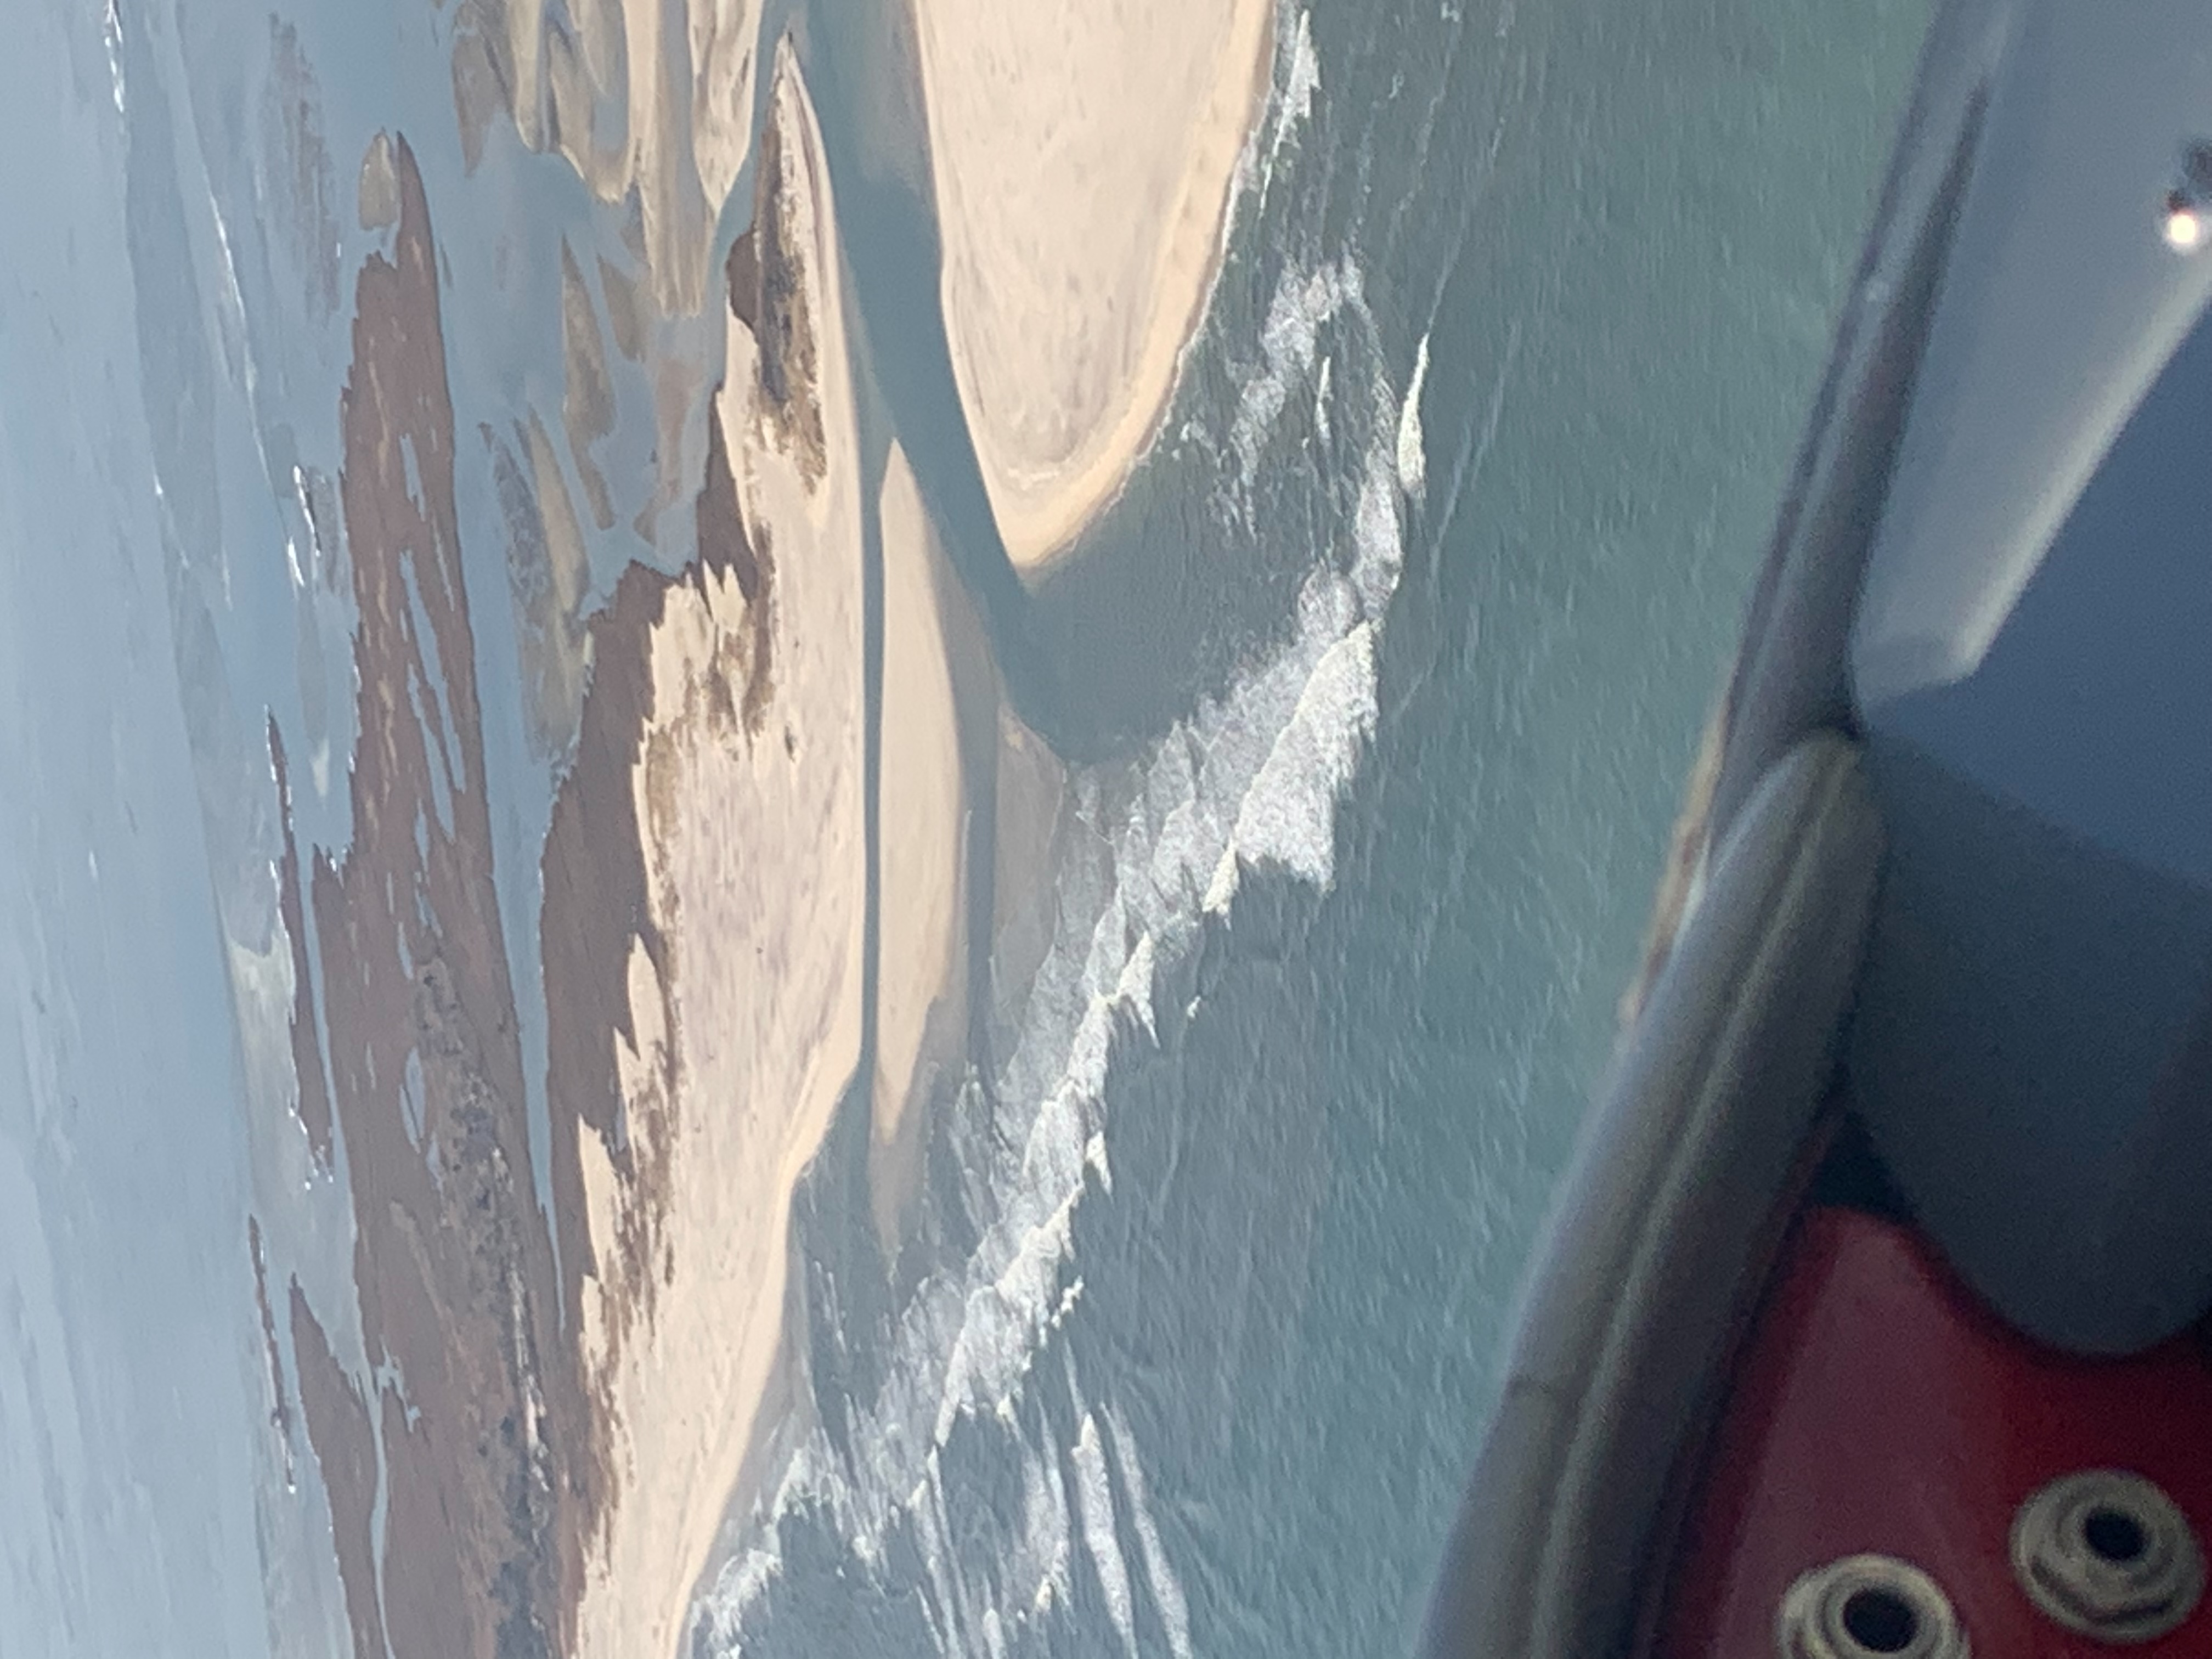 |
Jan 27, 2022 (CF) 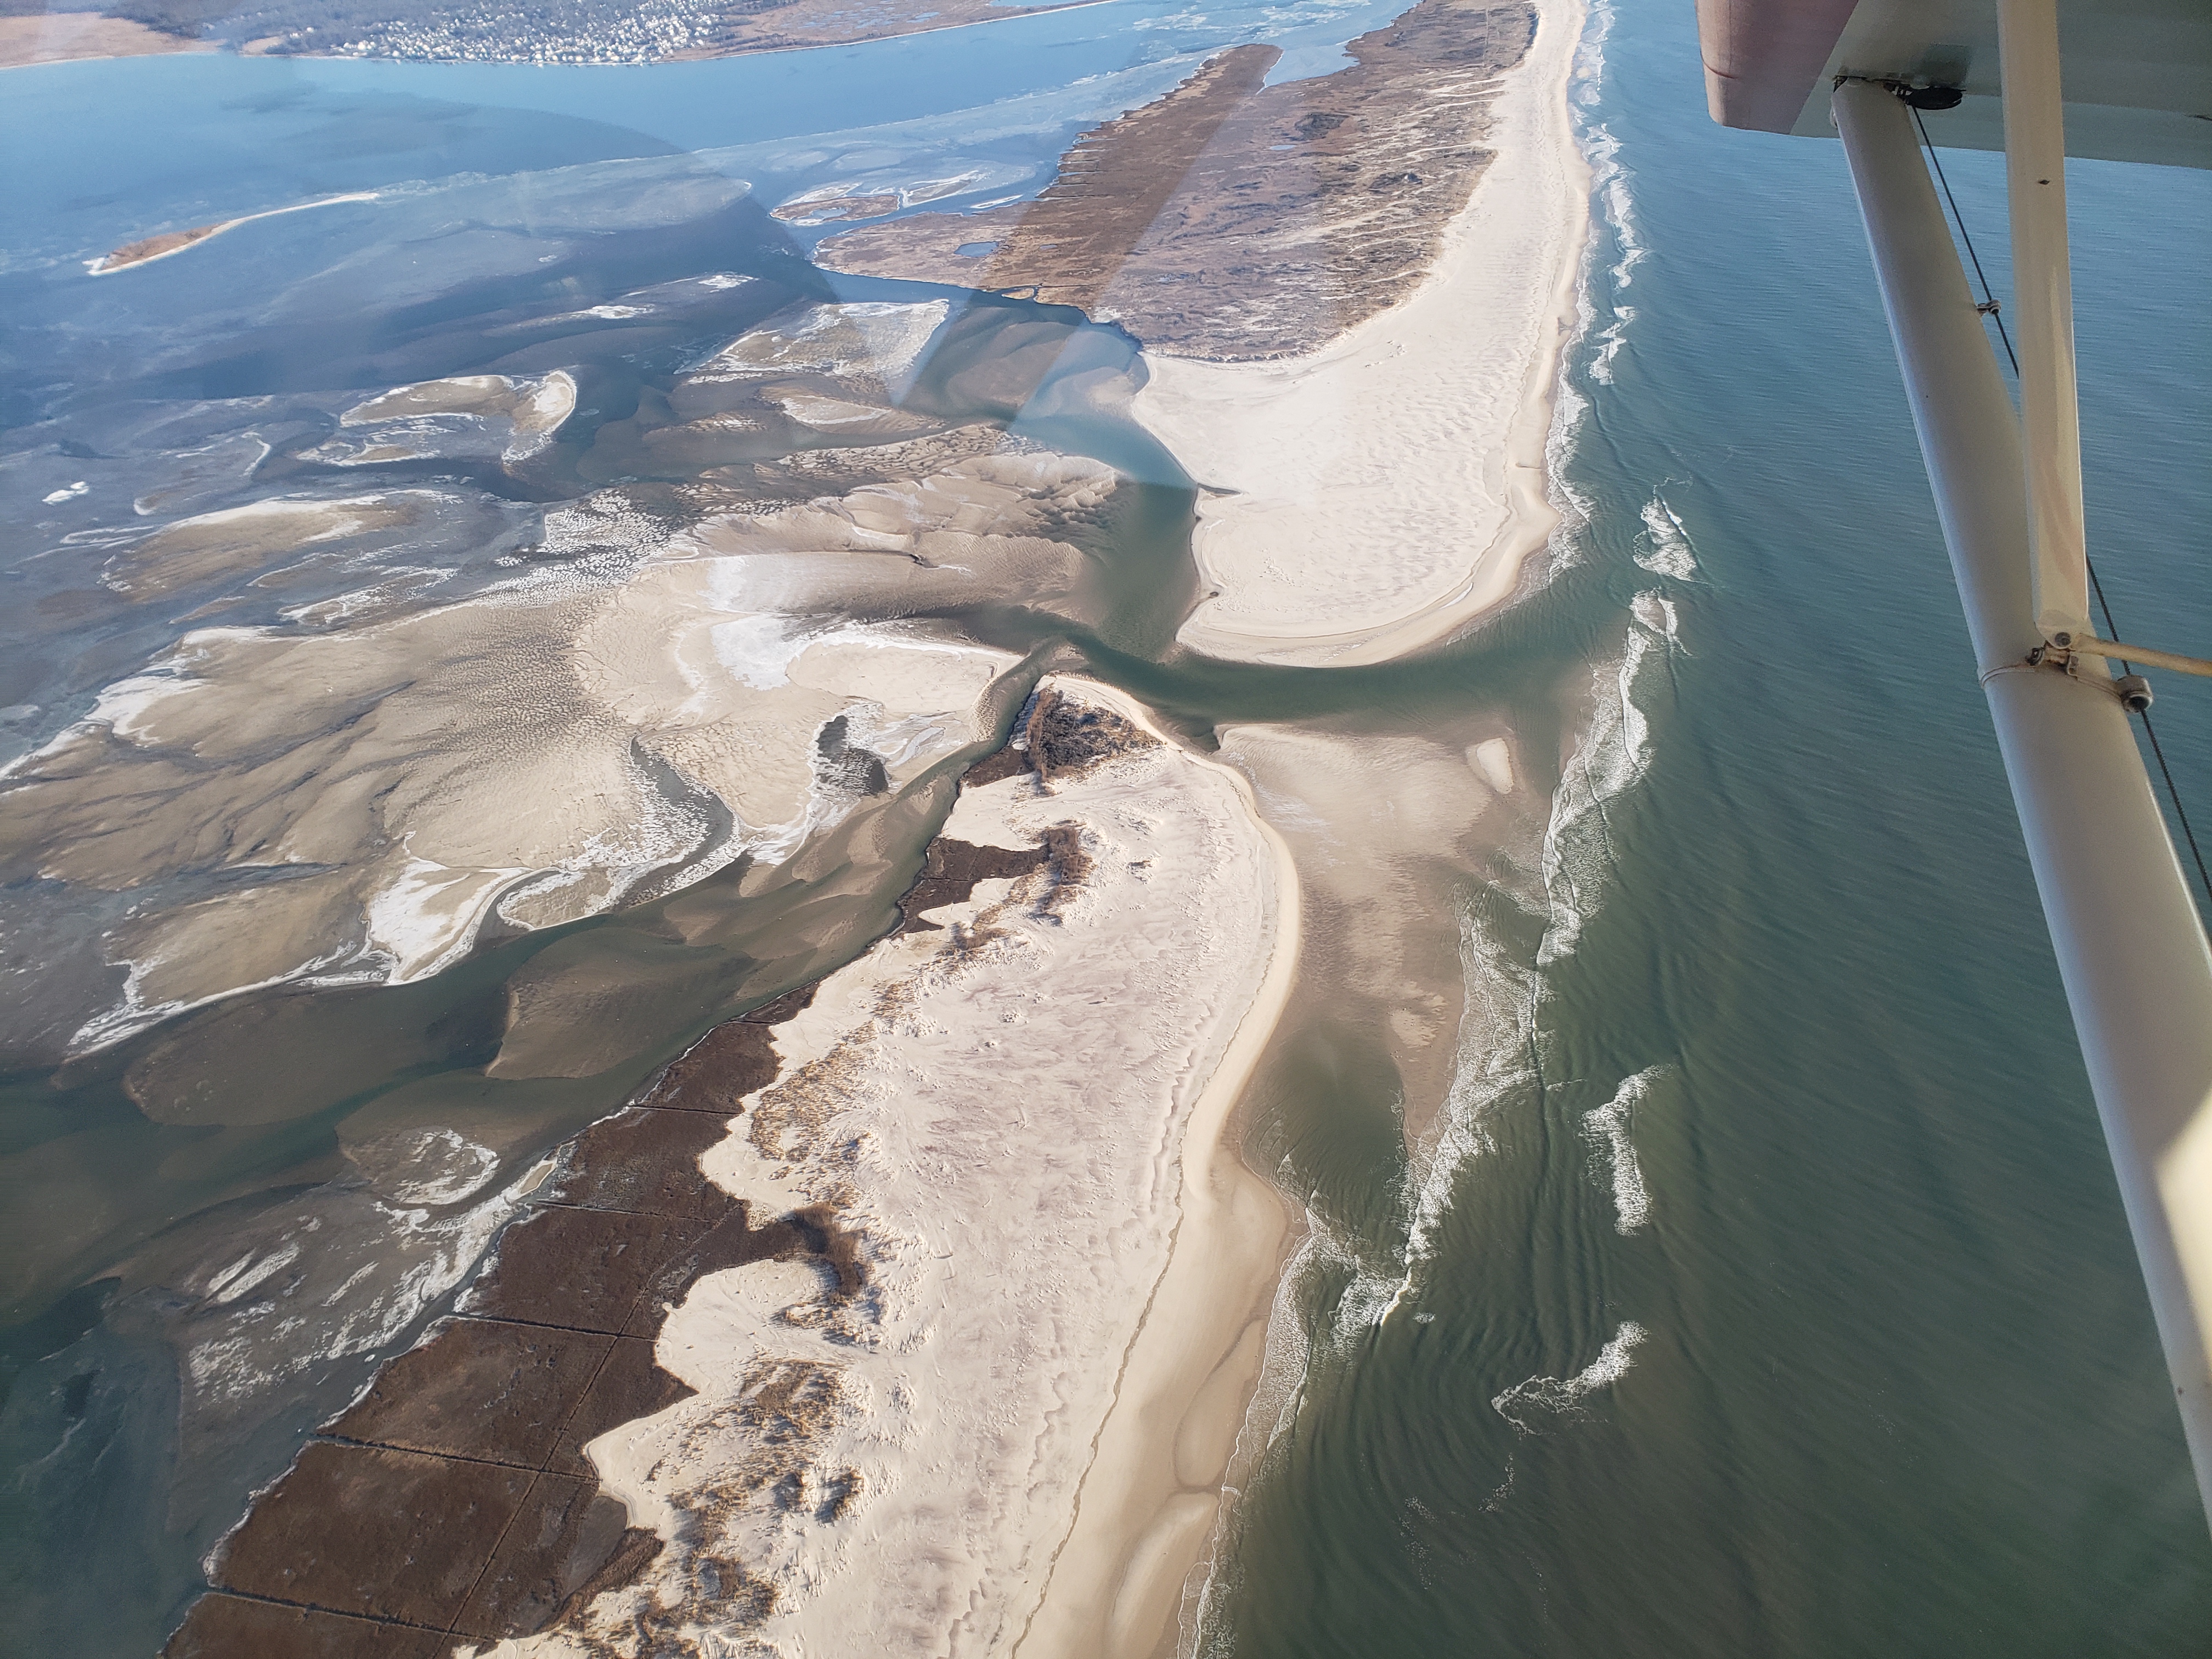 |
||||
Jan 28, 2022 (JV)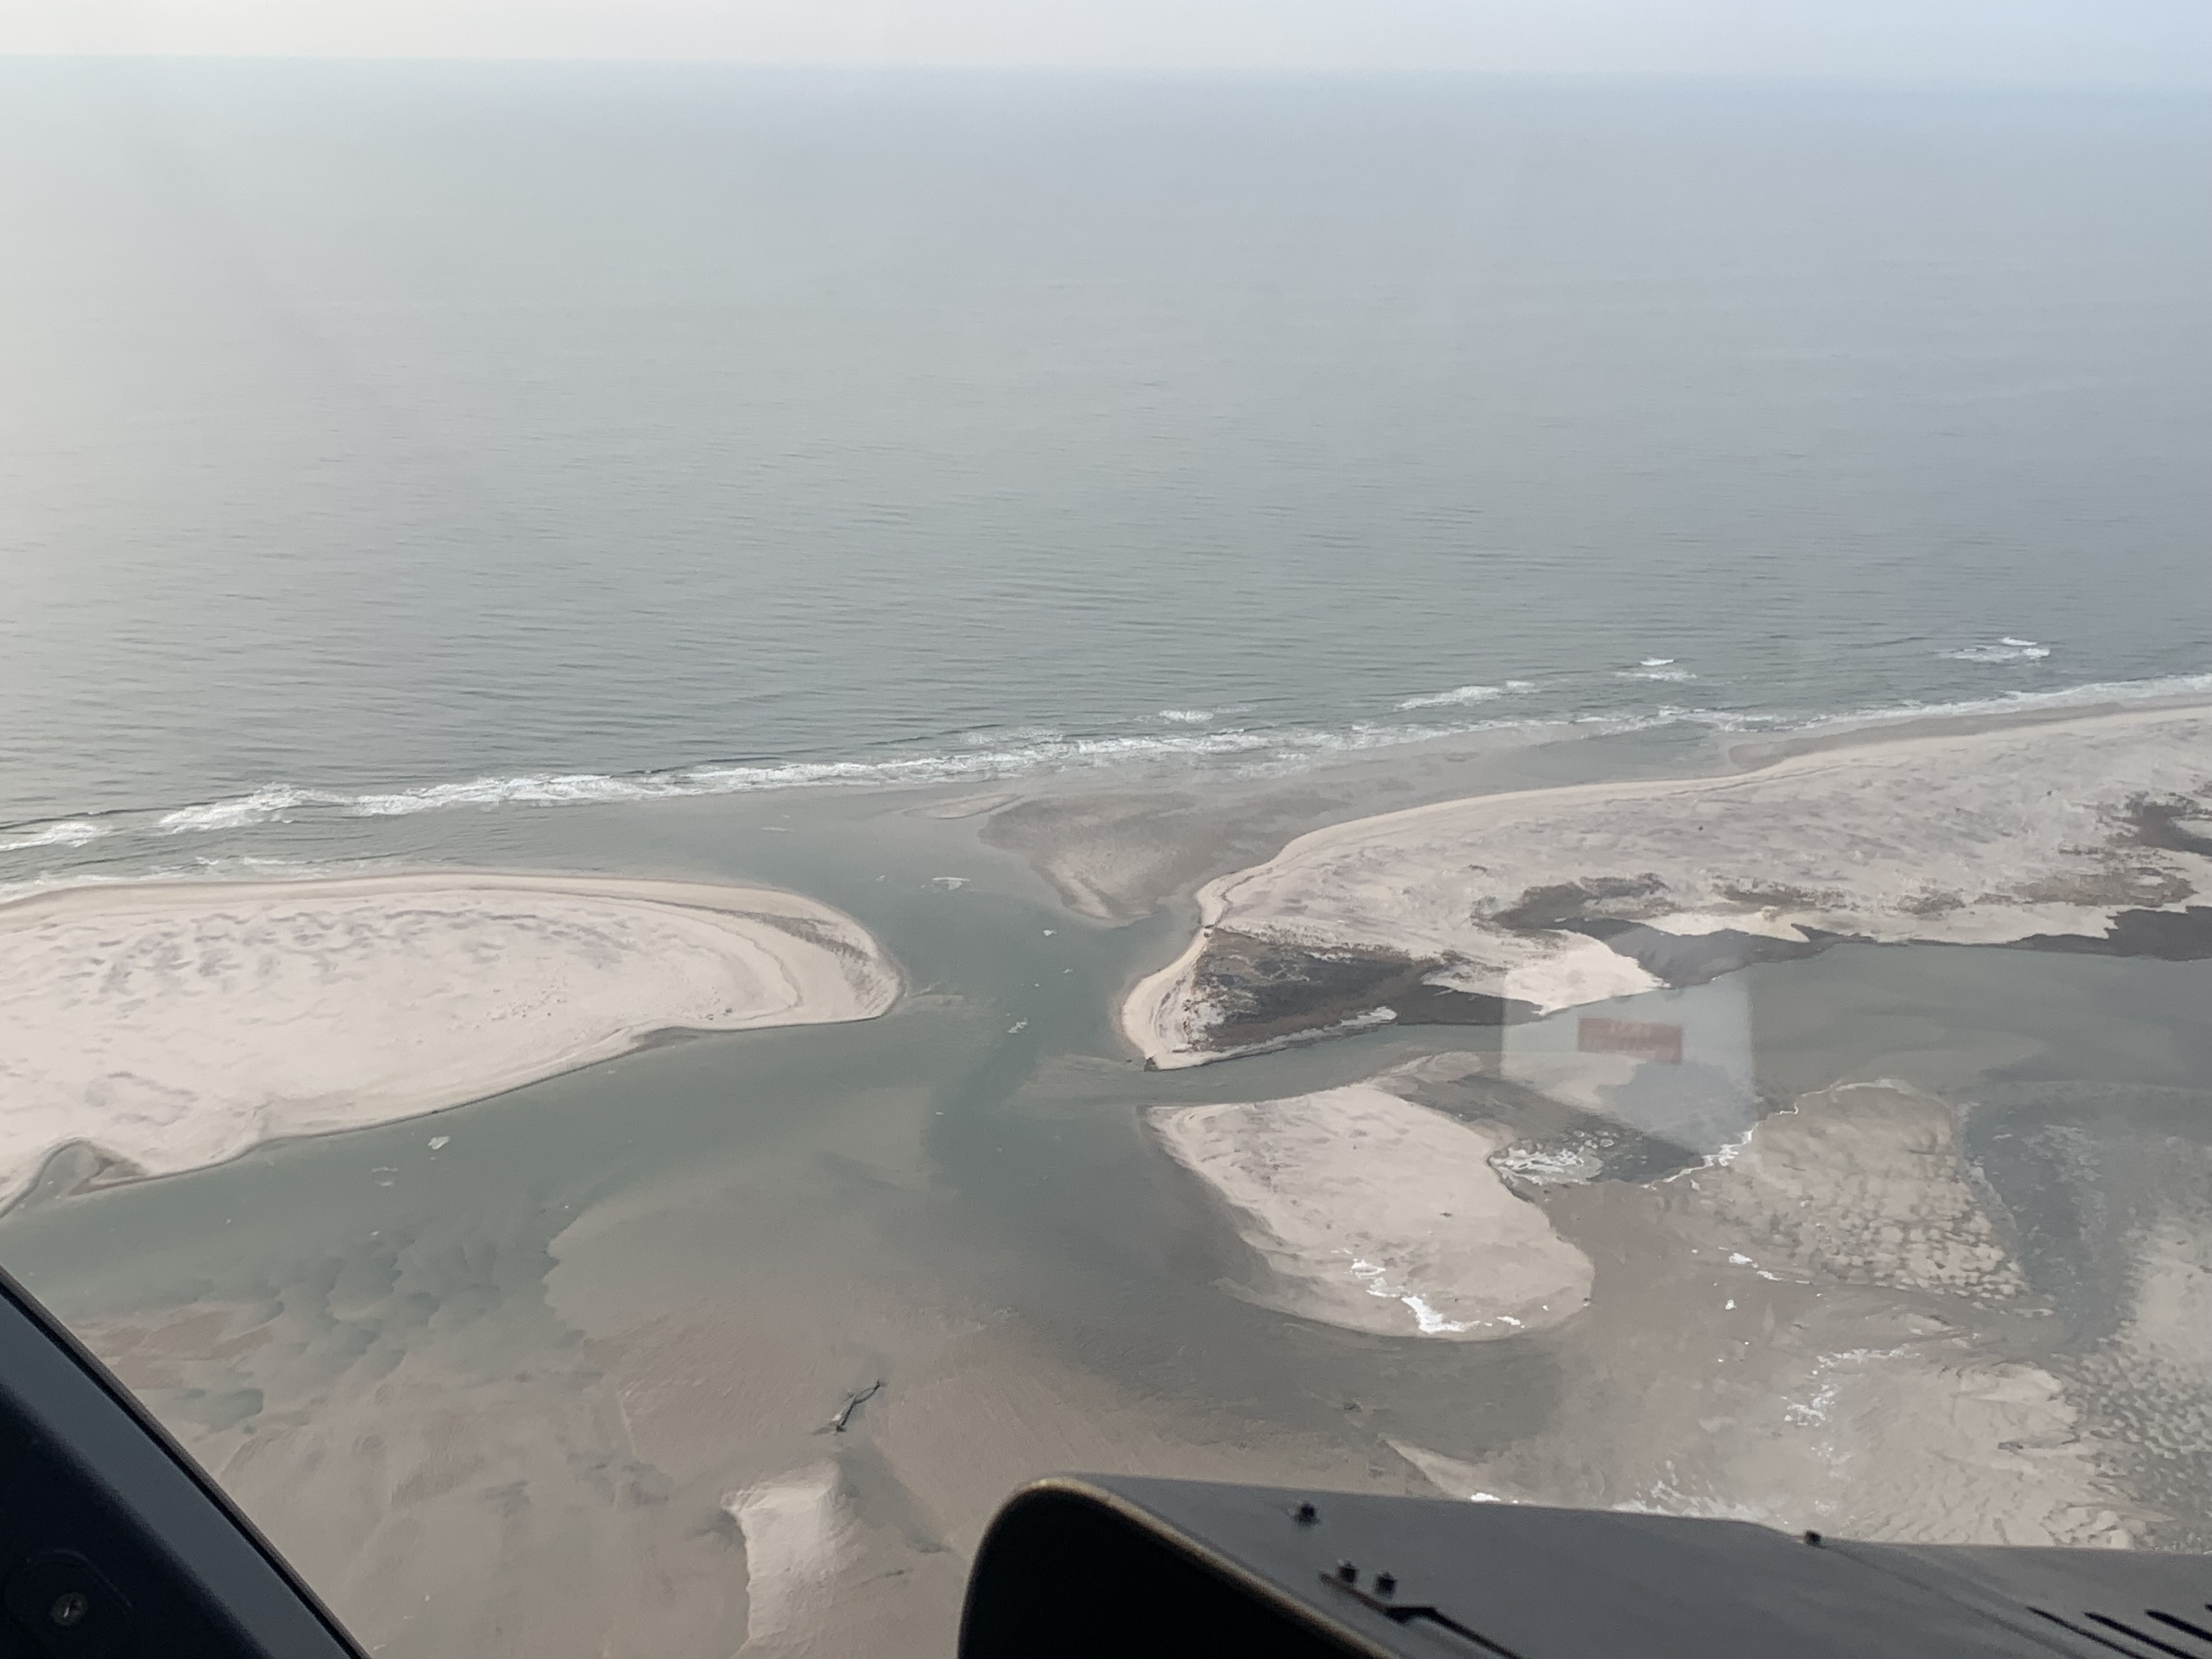 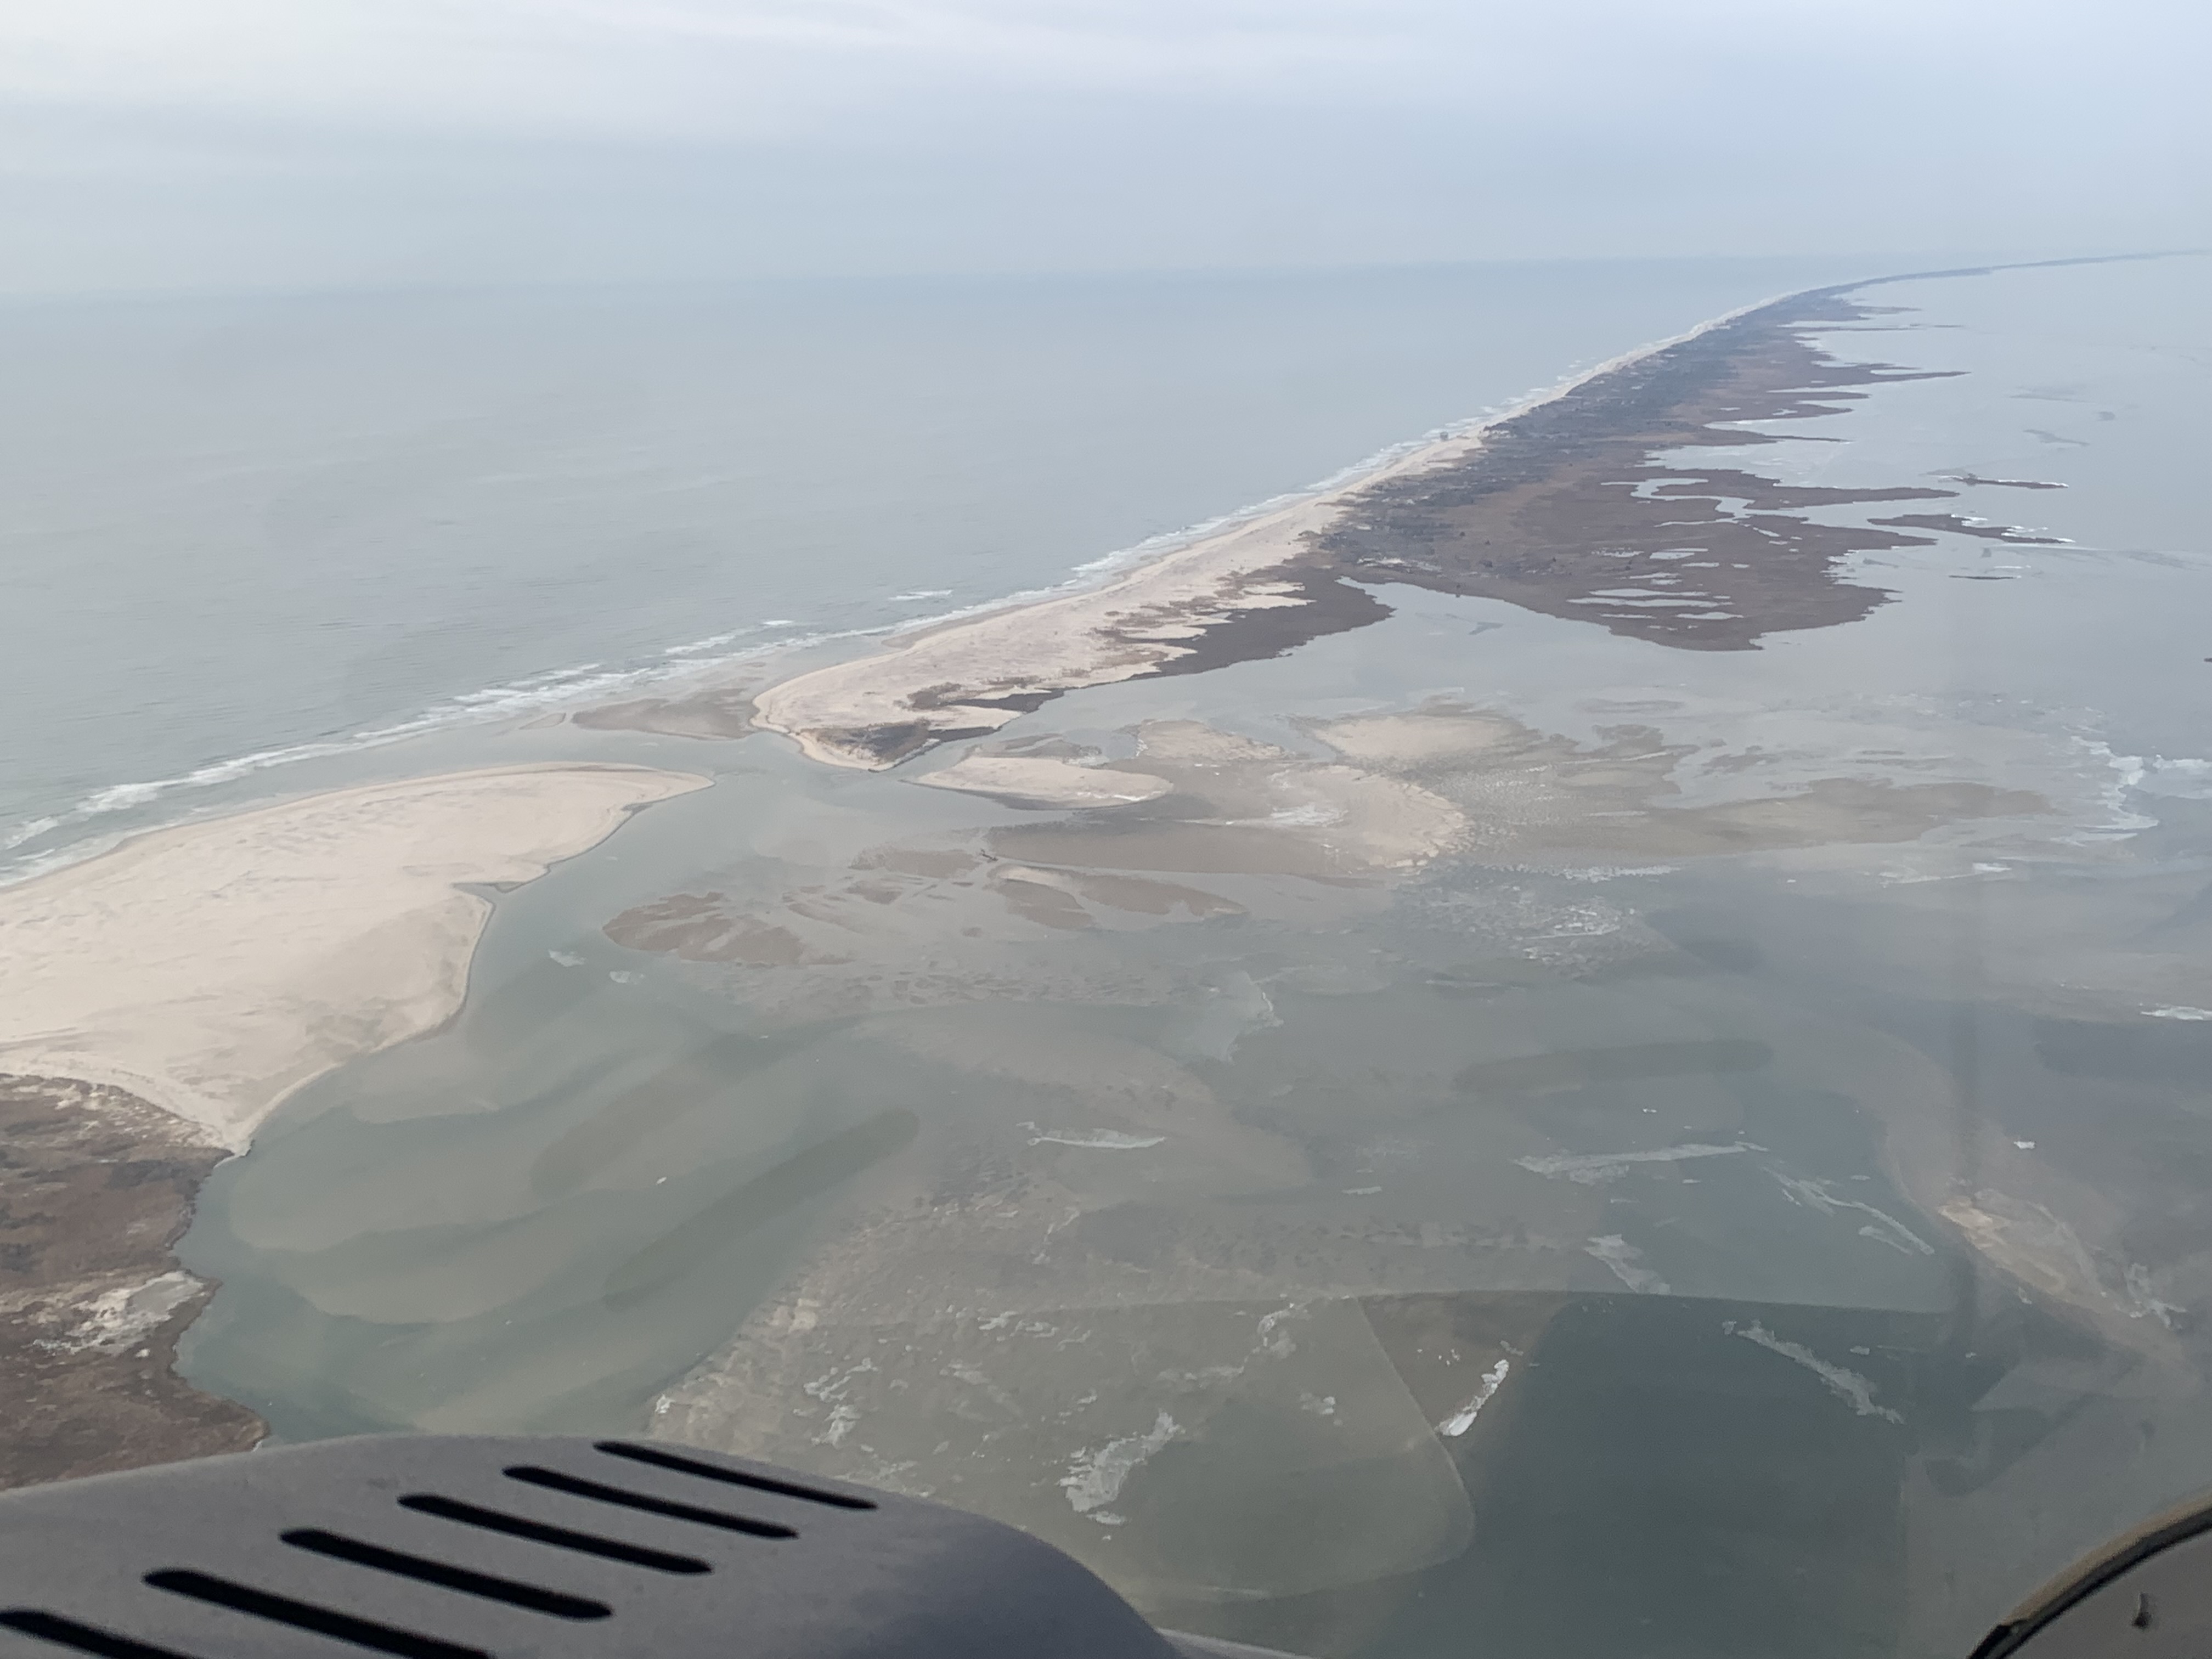 |
Feb 16, 2022 (CF)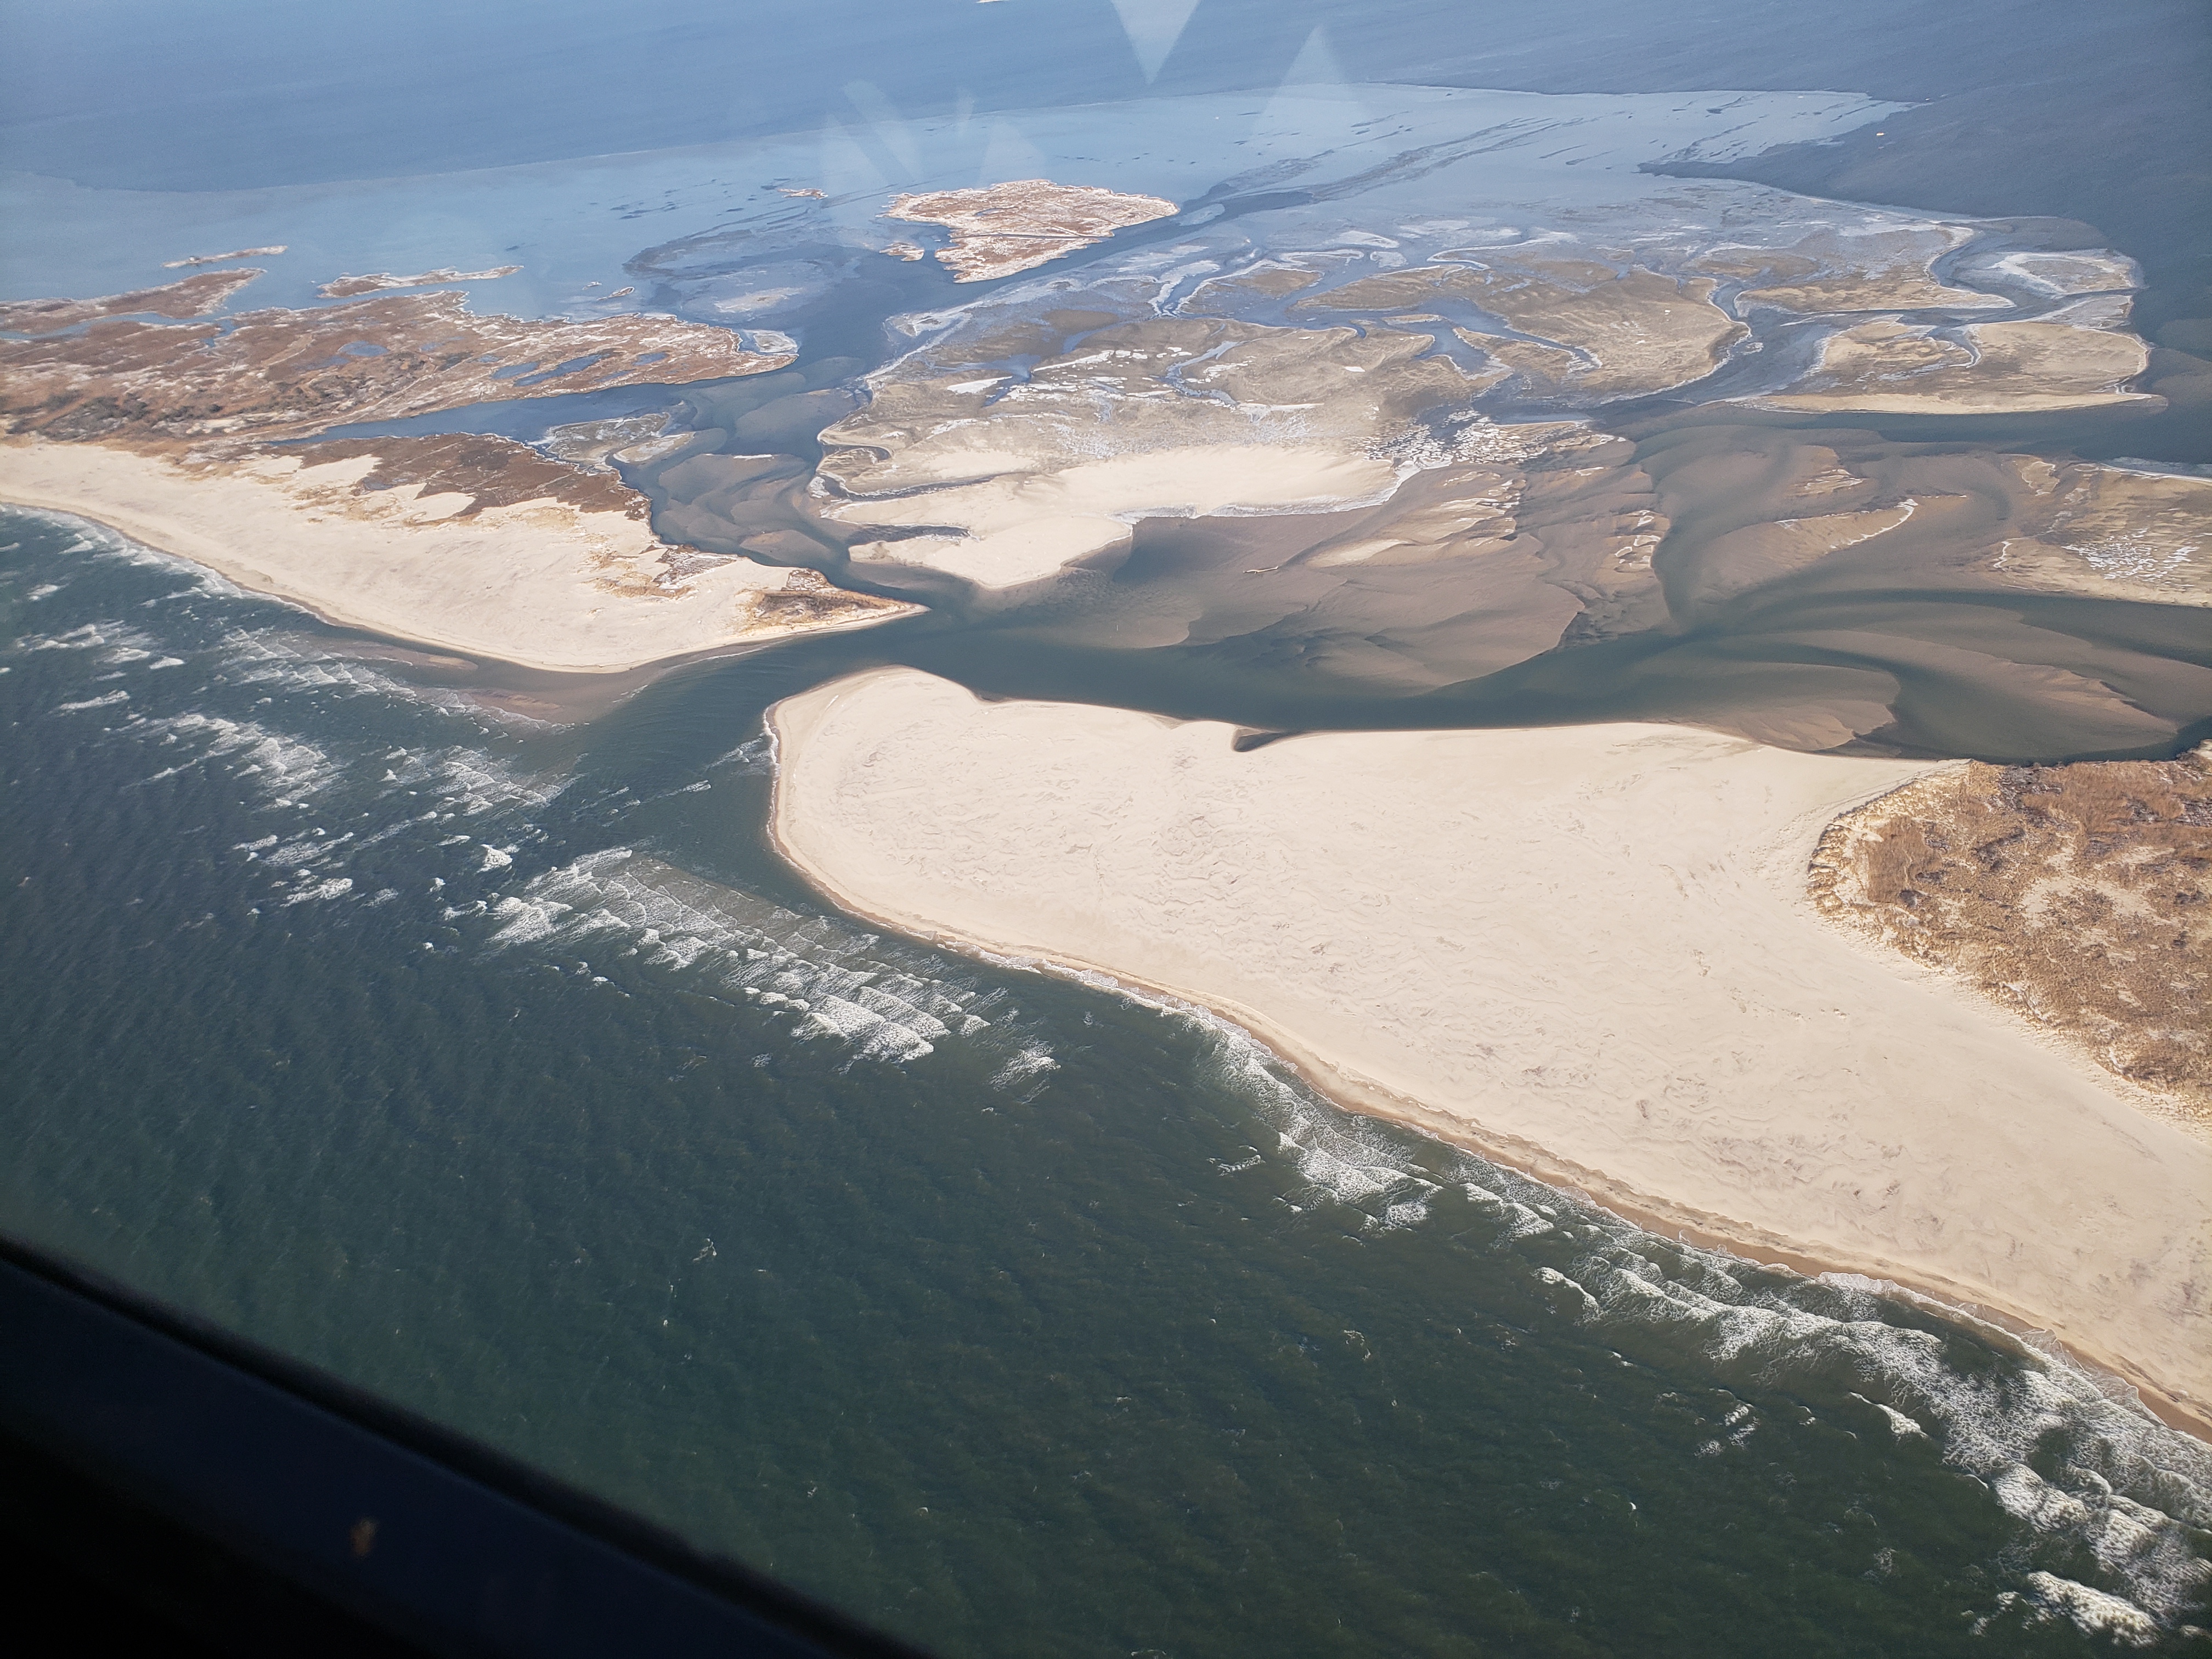 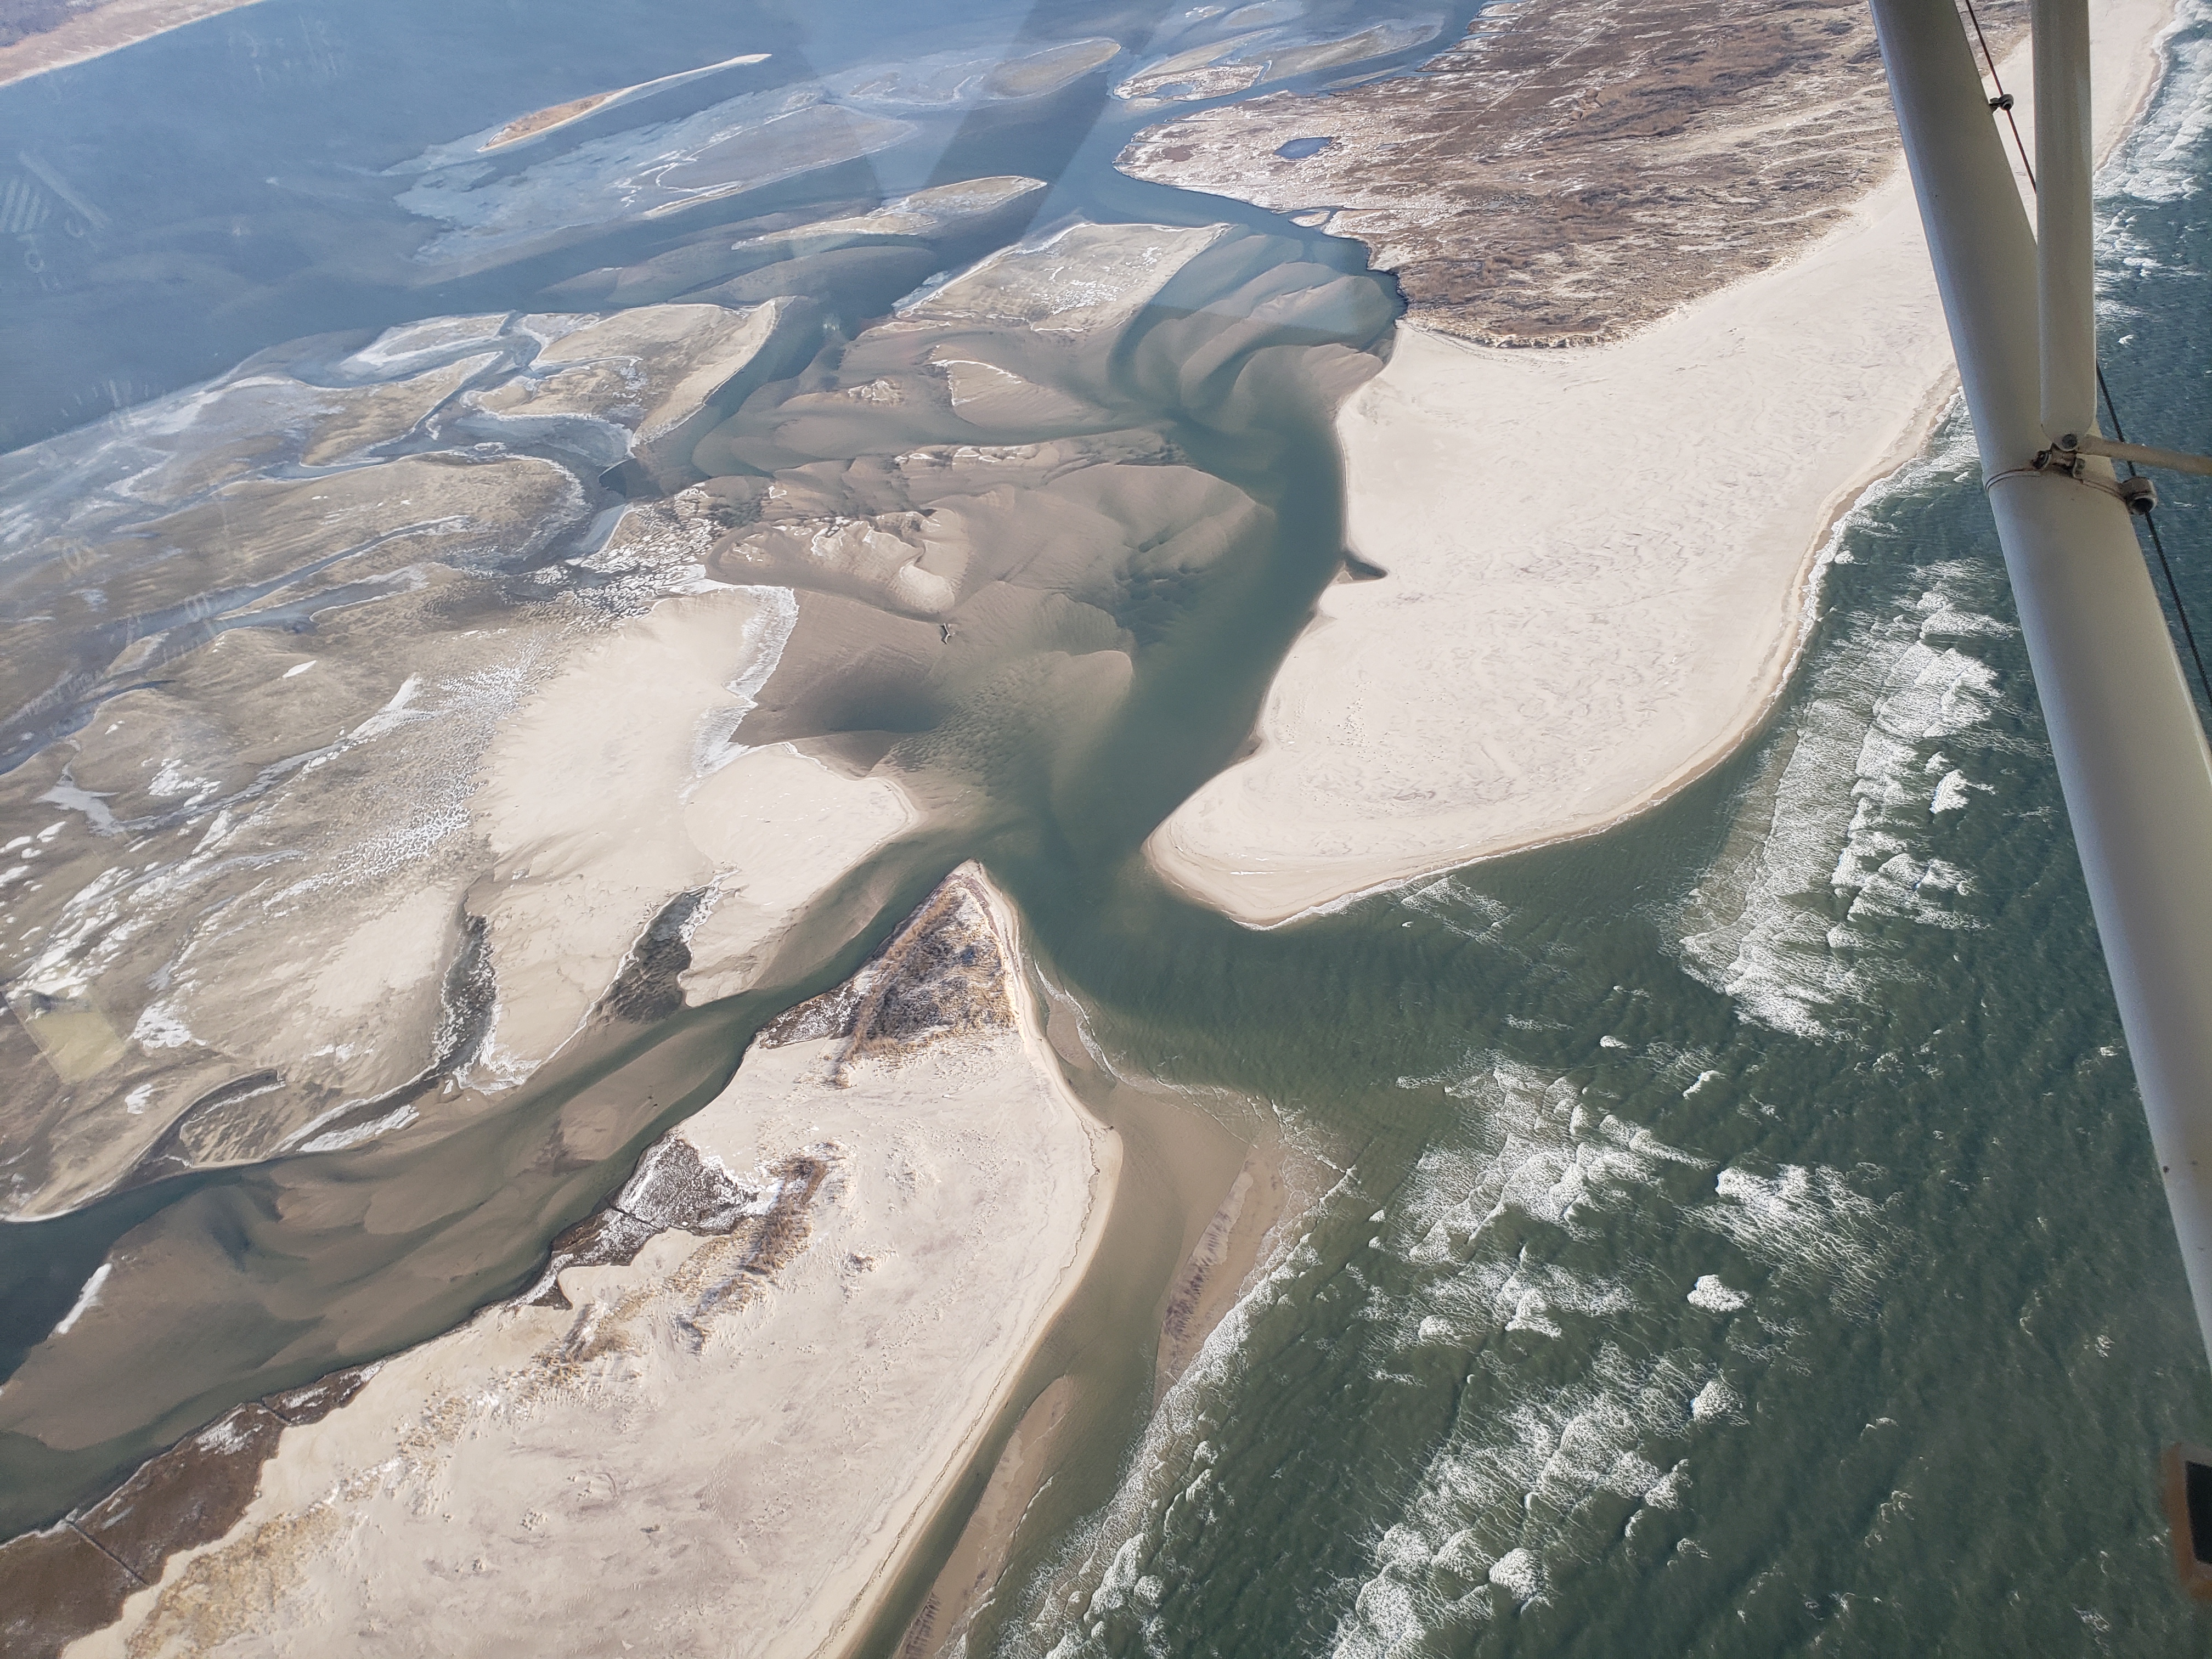 |
Mar 5, 2022 (RG)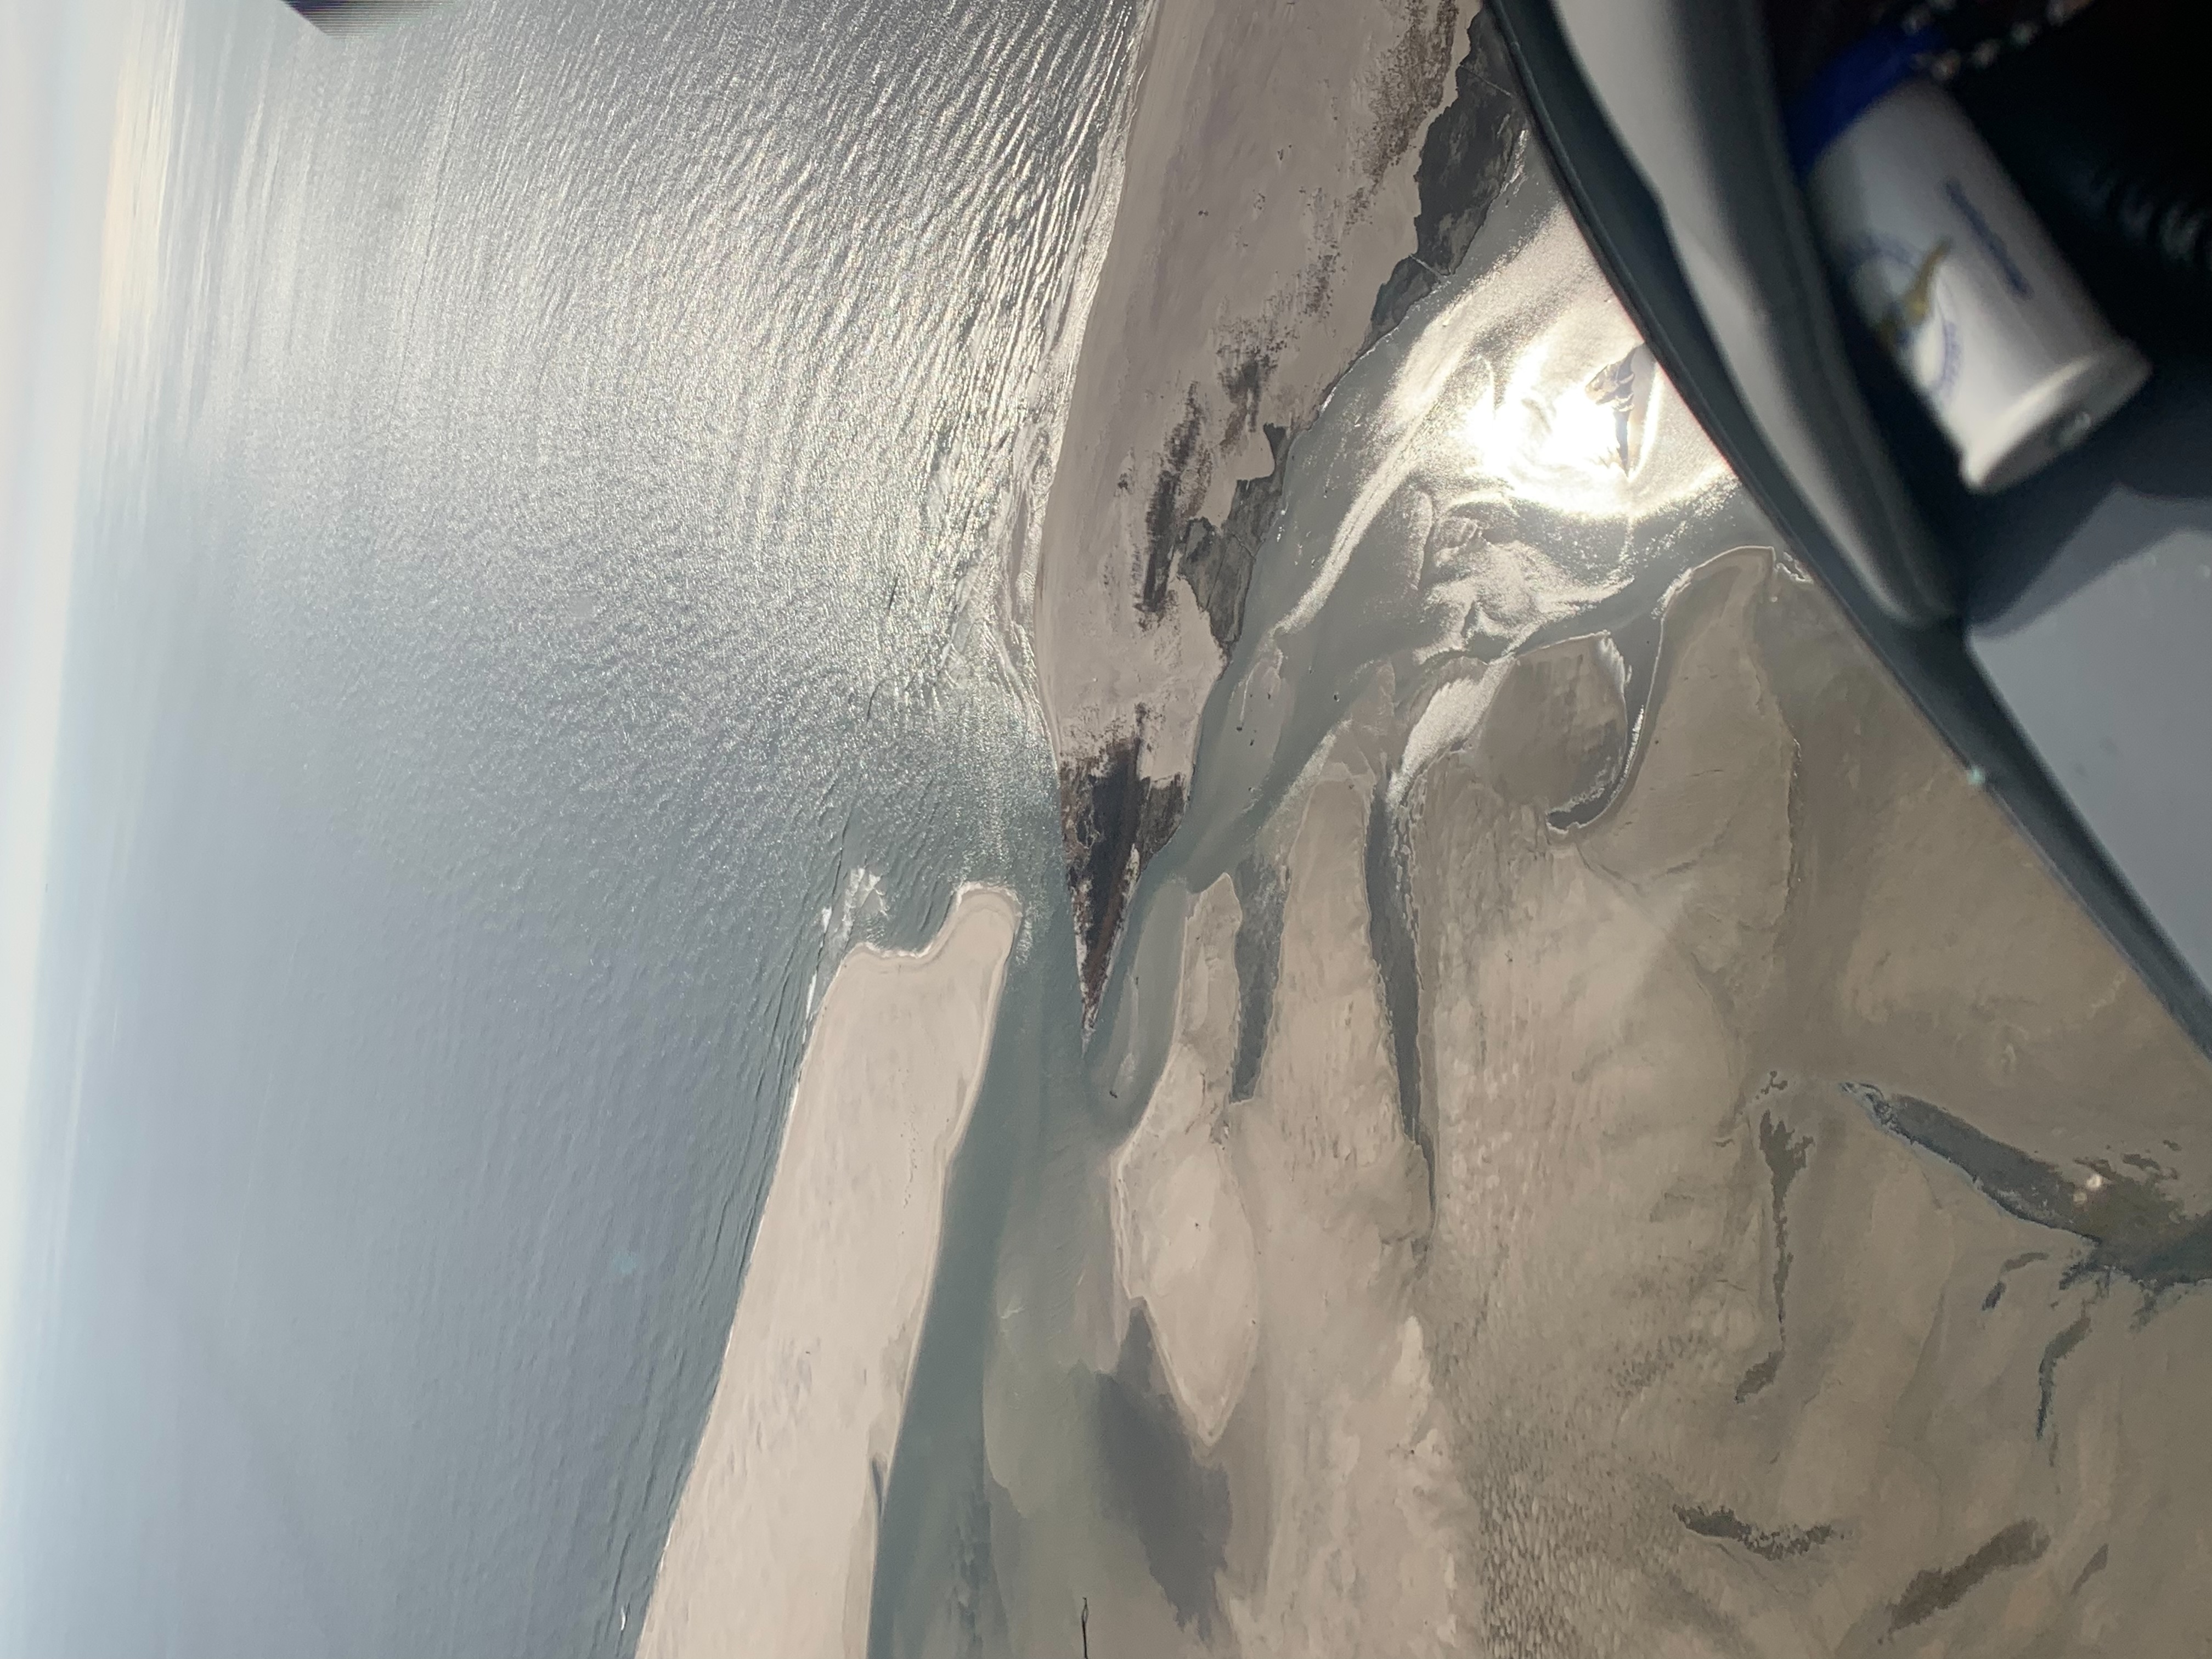 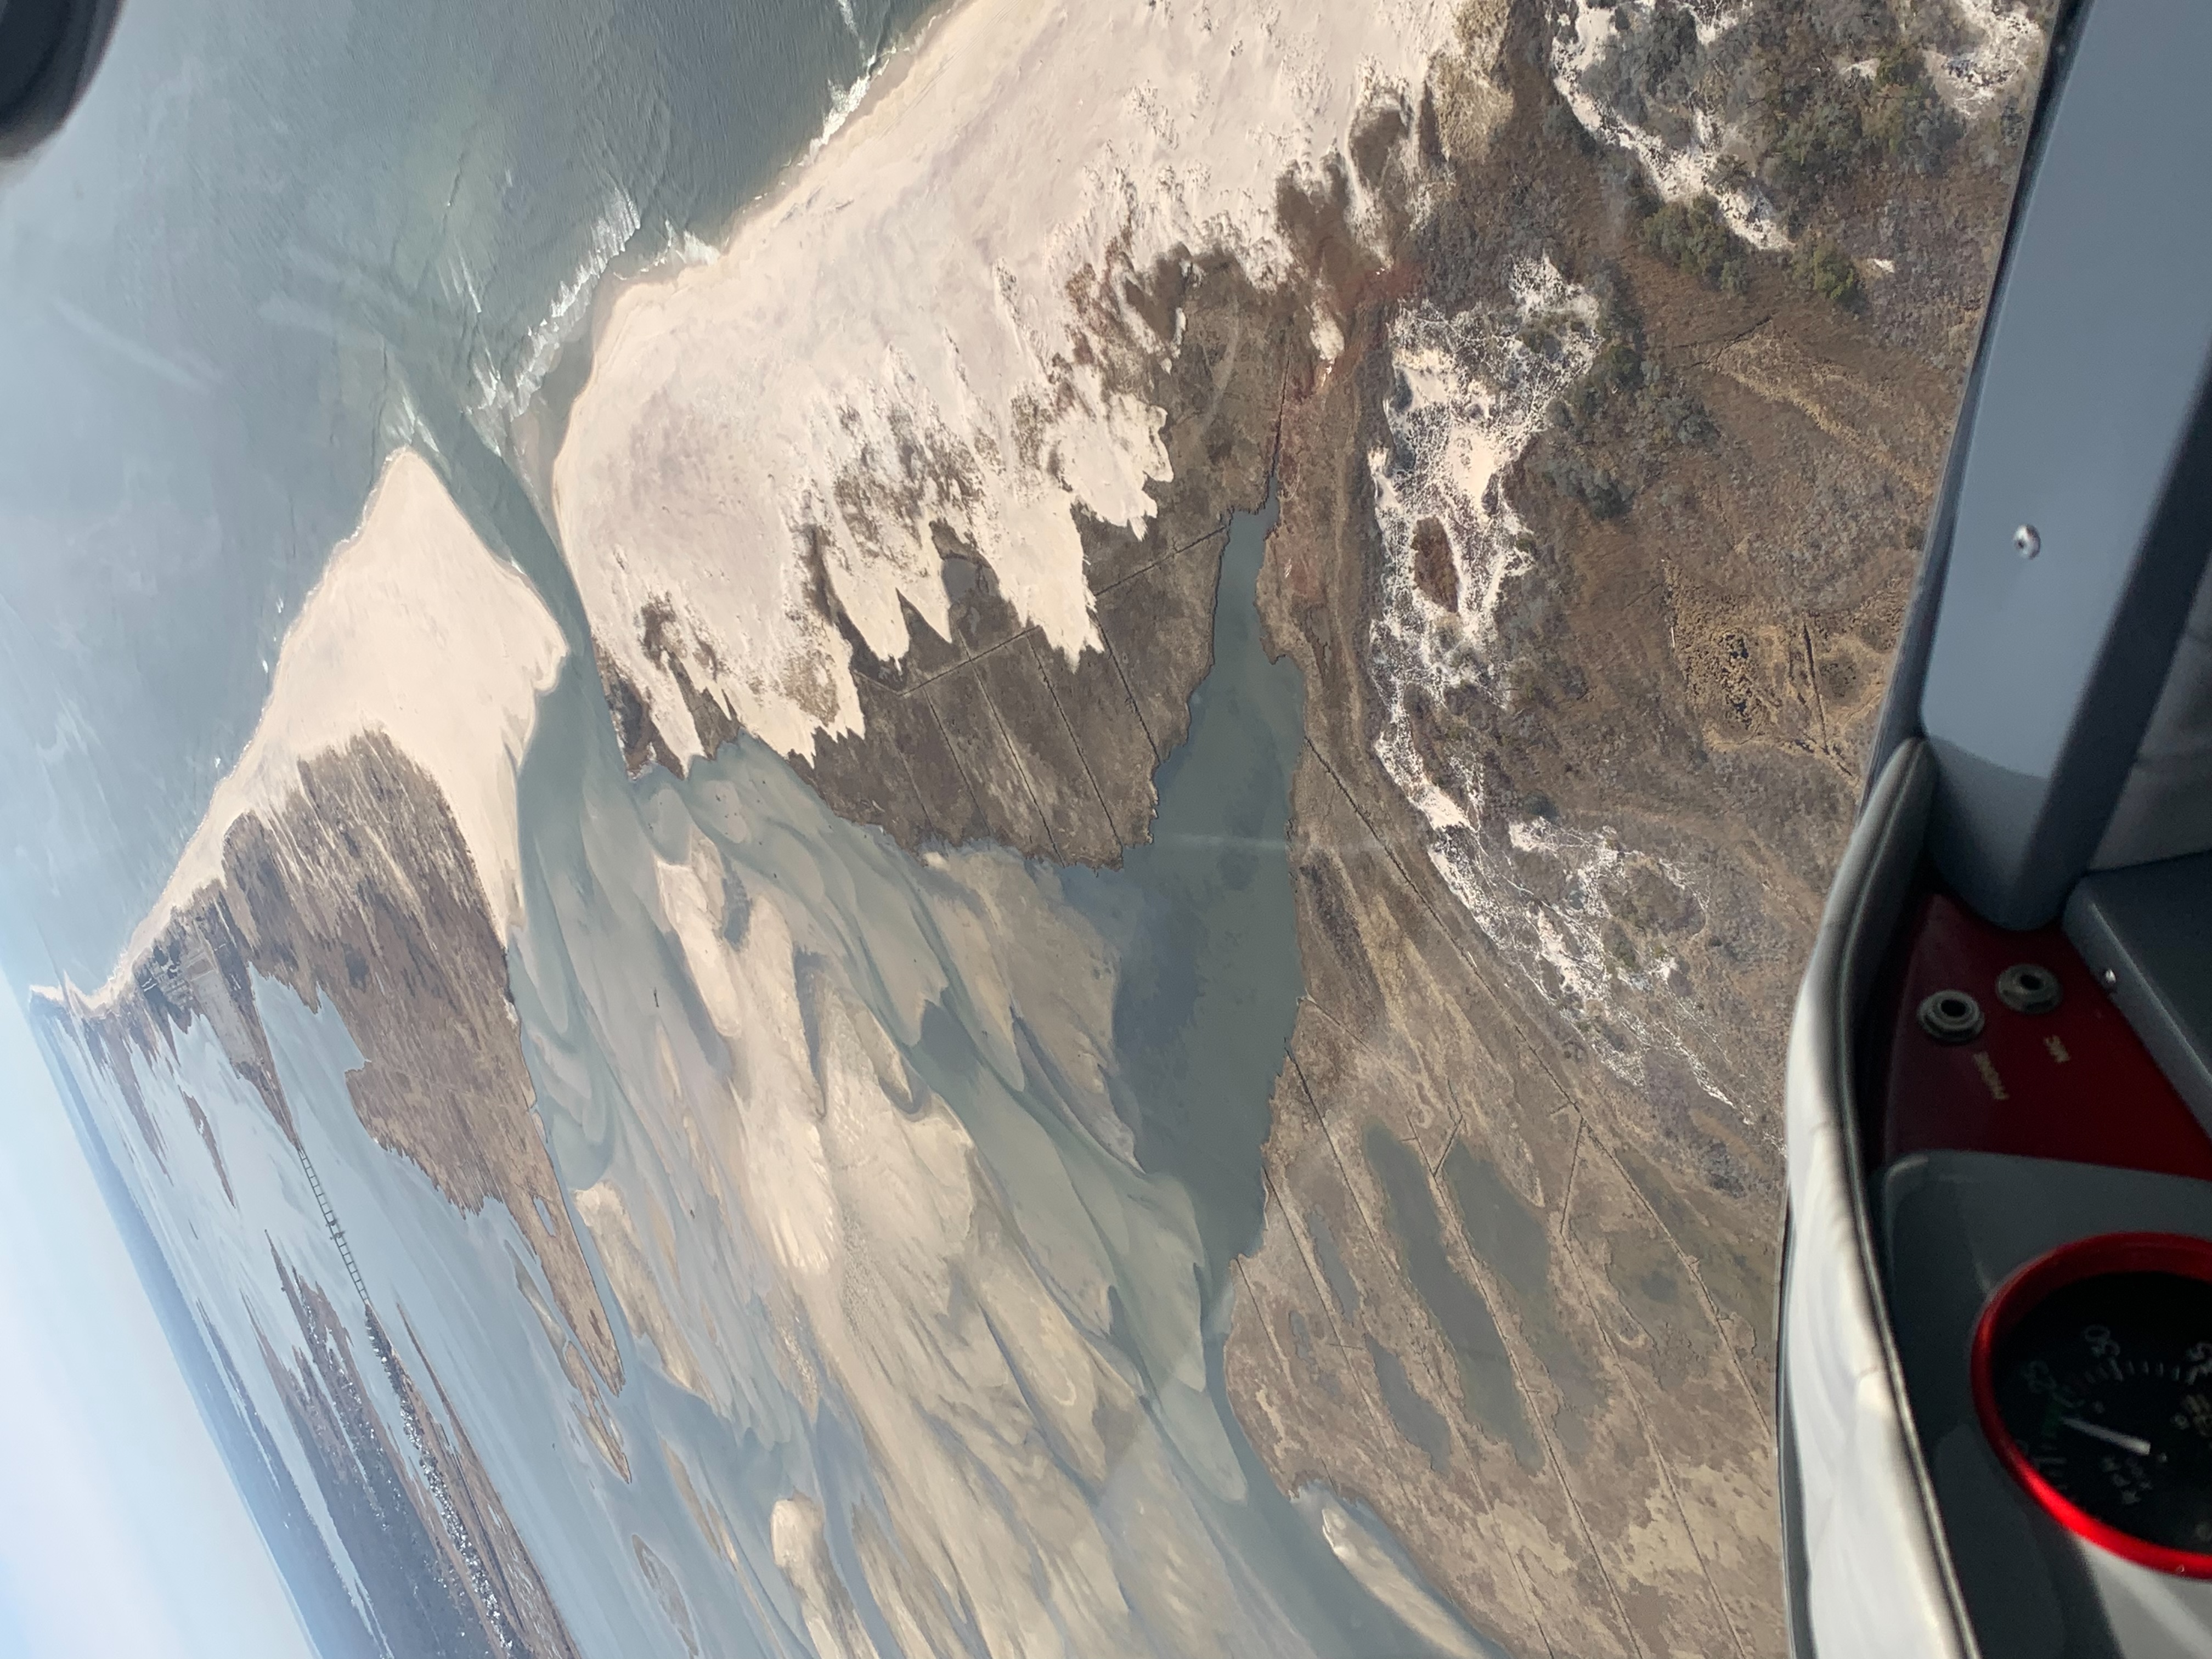 |
Mar 16, 2022 (RG&CF)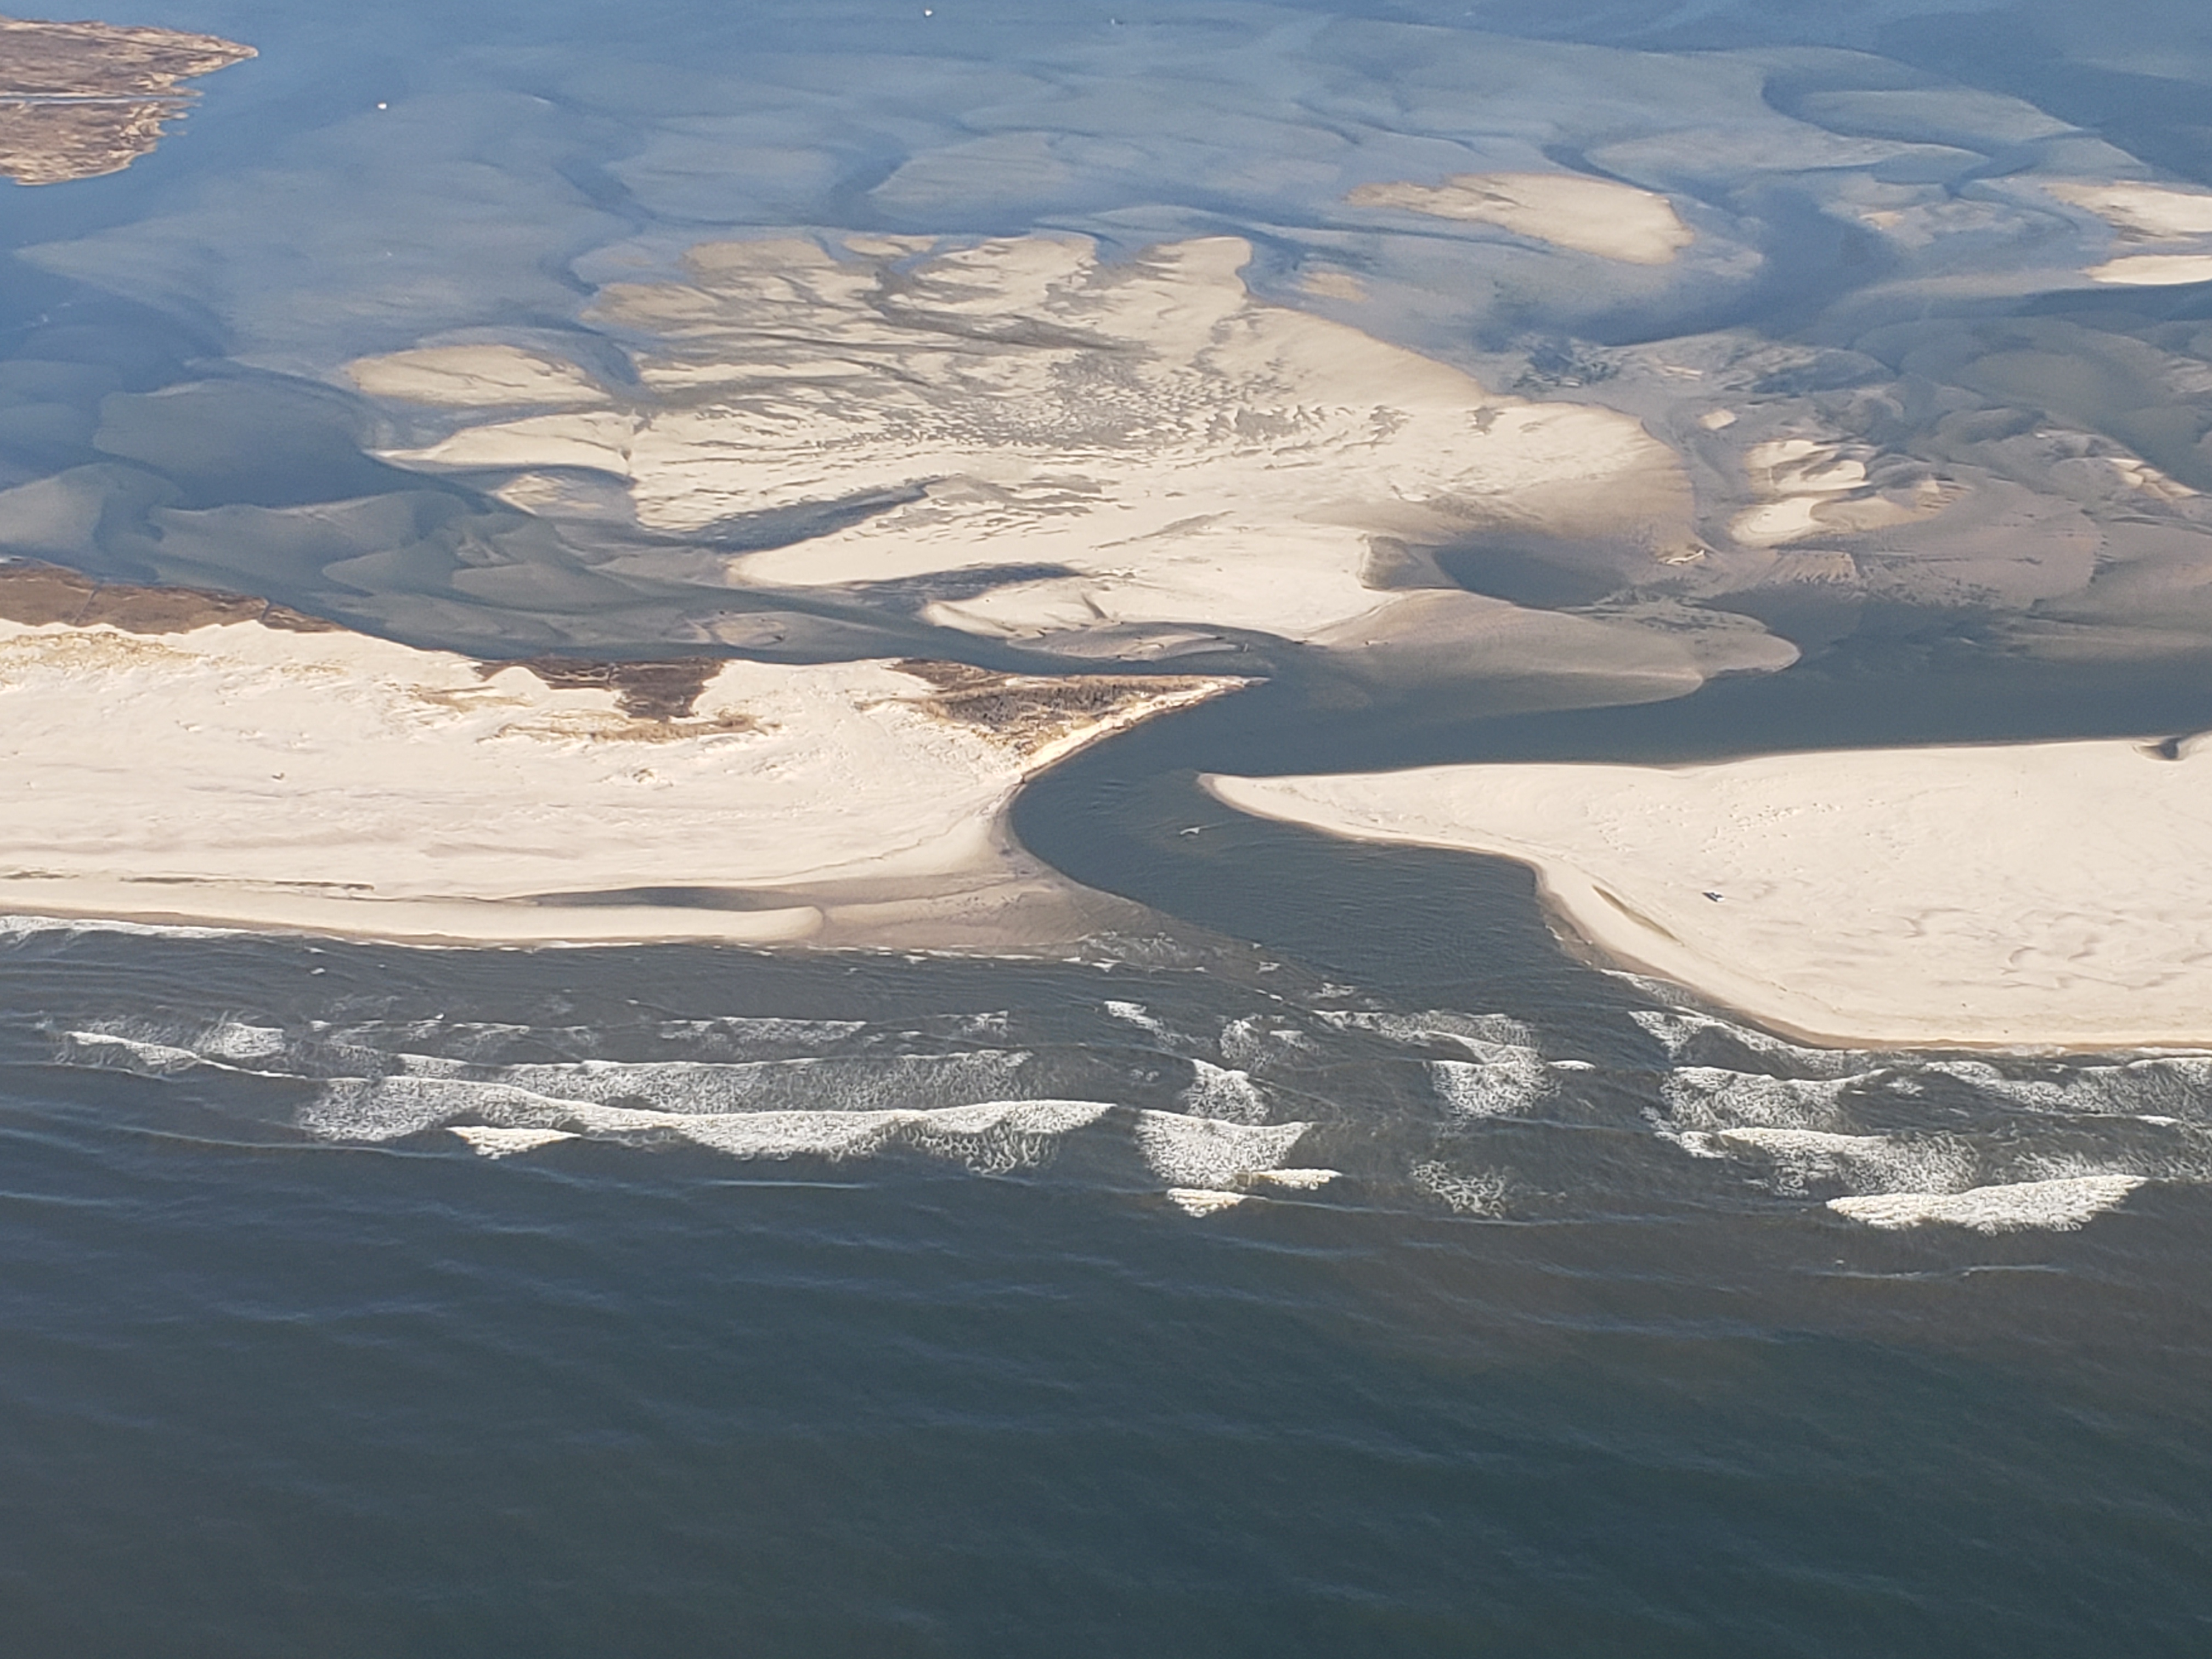  |
||||
April 23, 2022 (RG)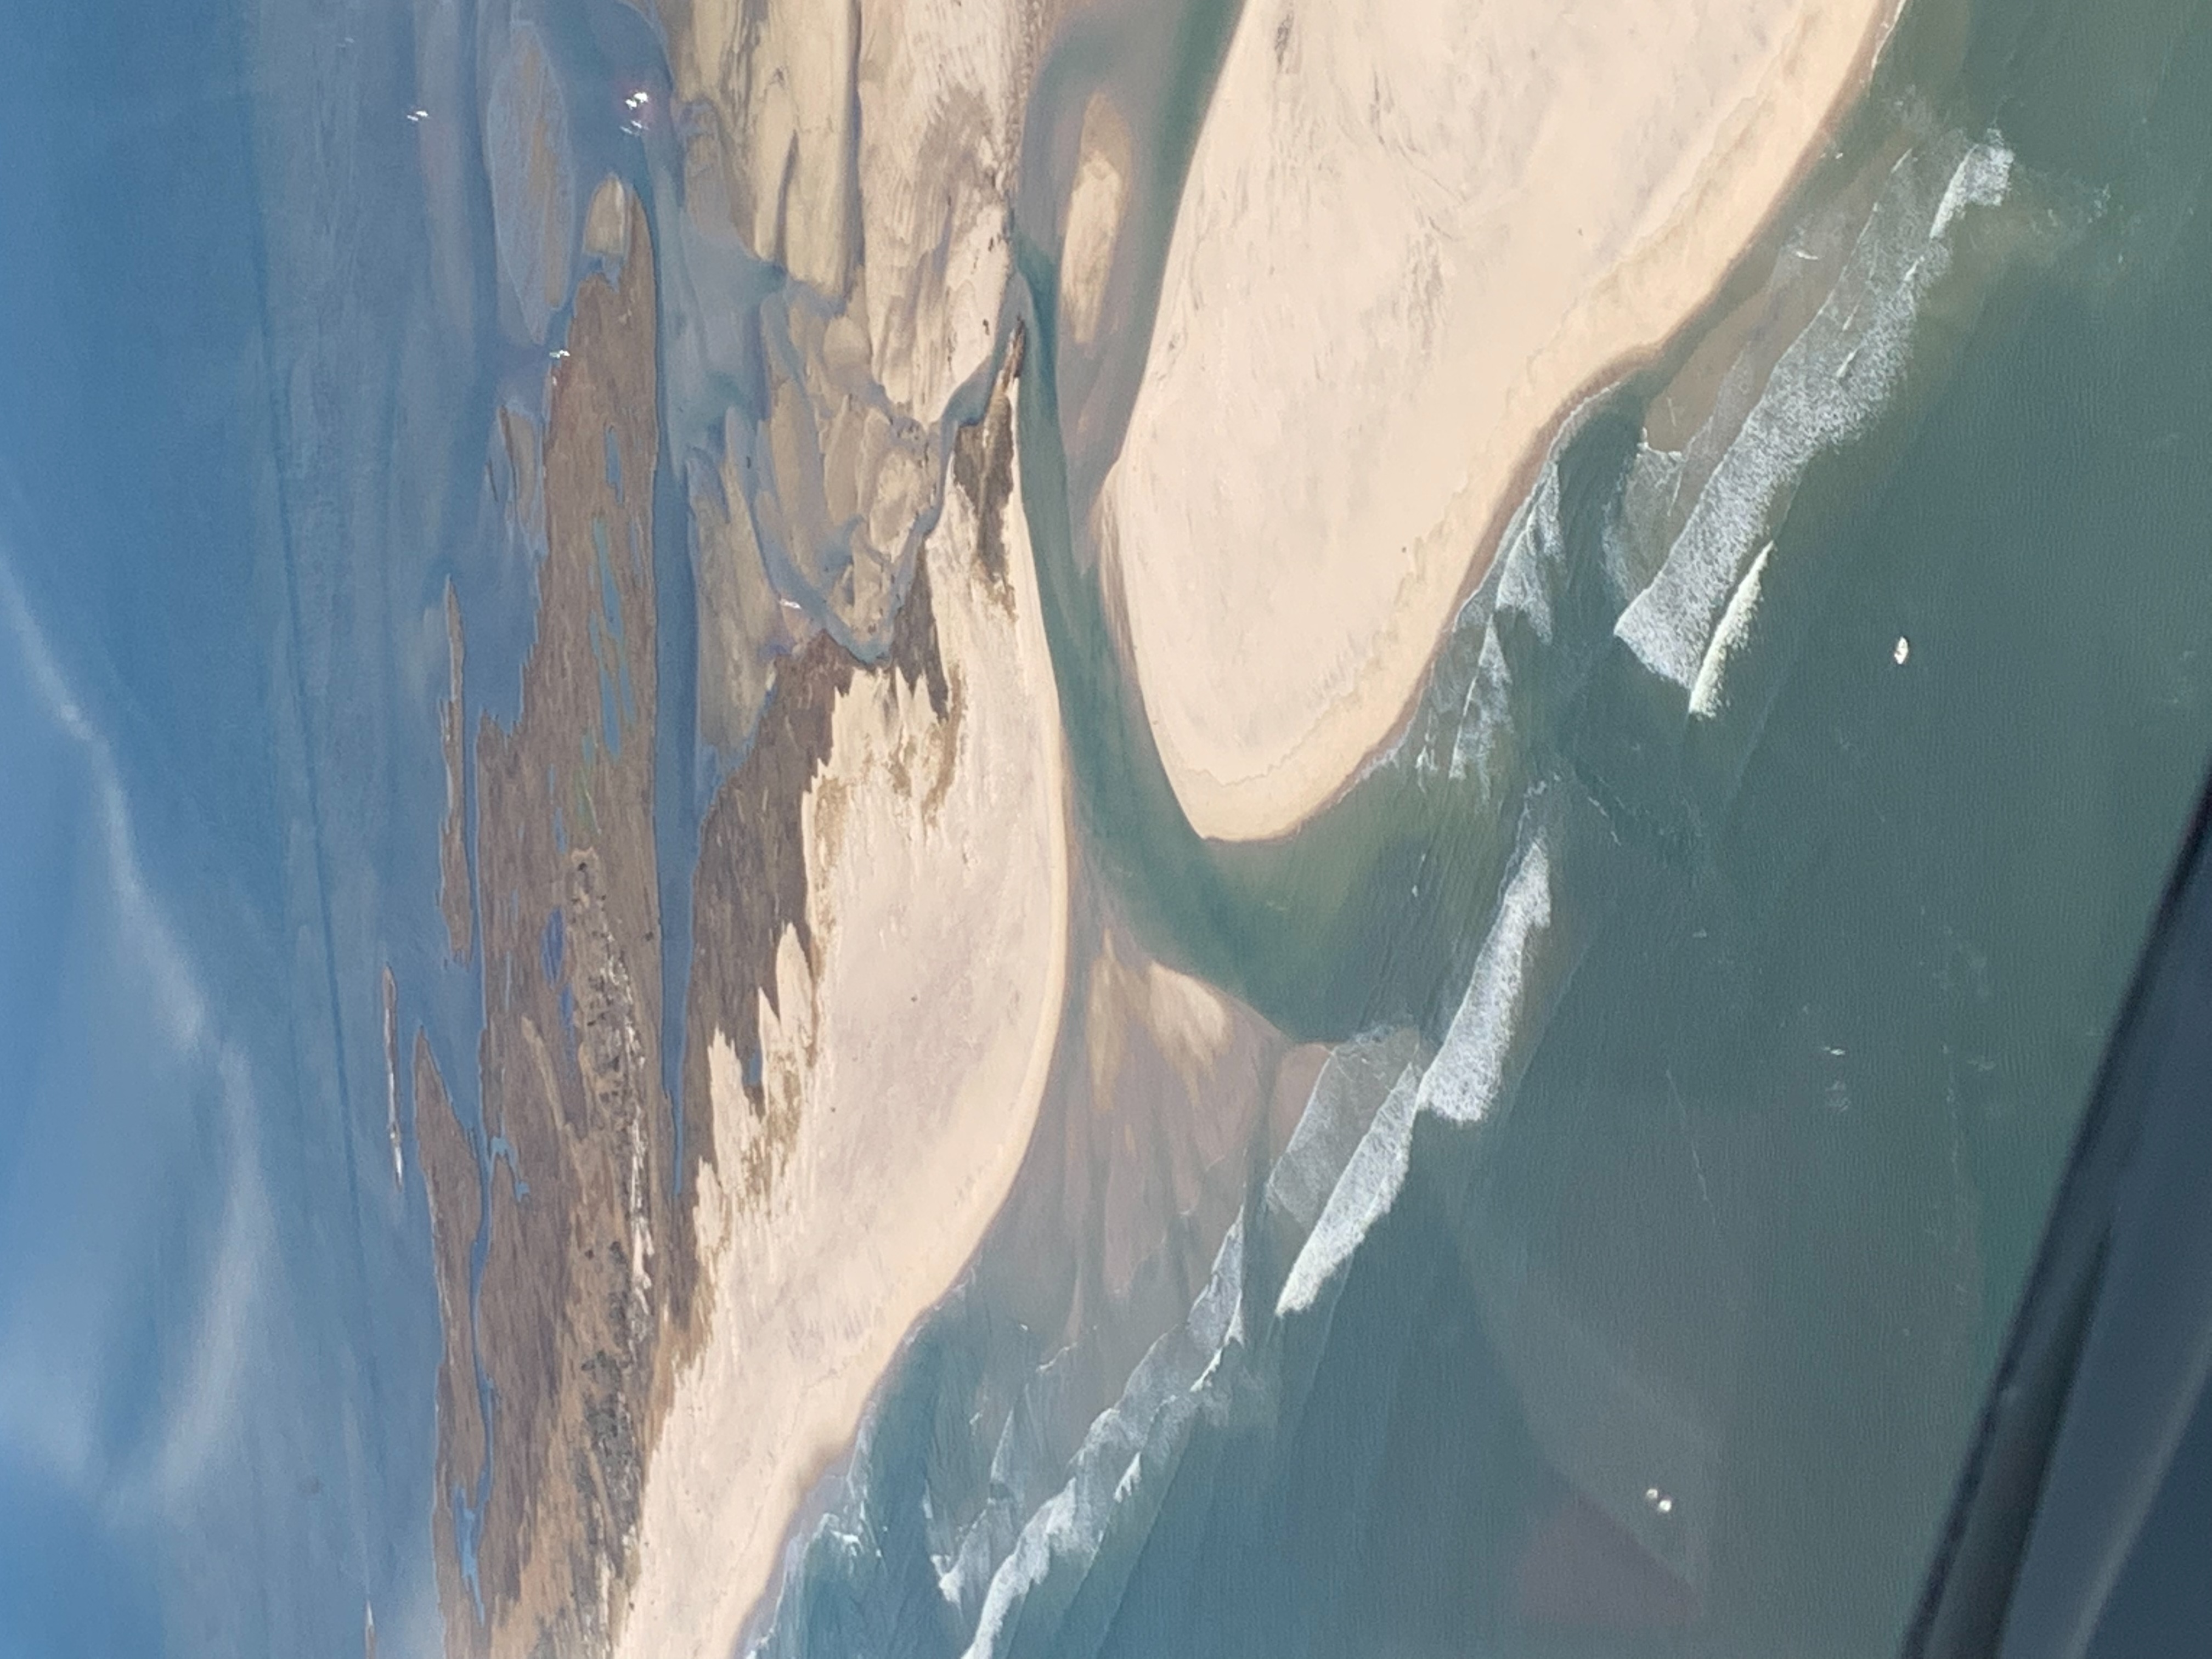  |
April 25, 2022 (RG&CF)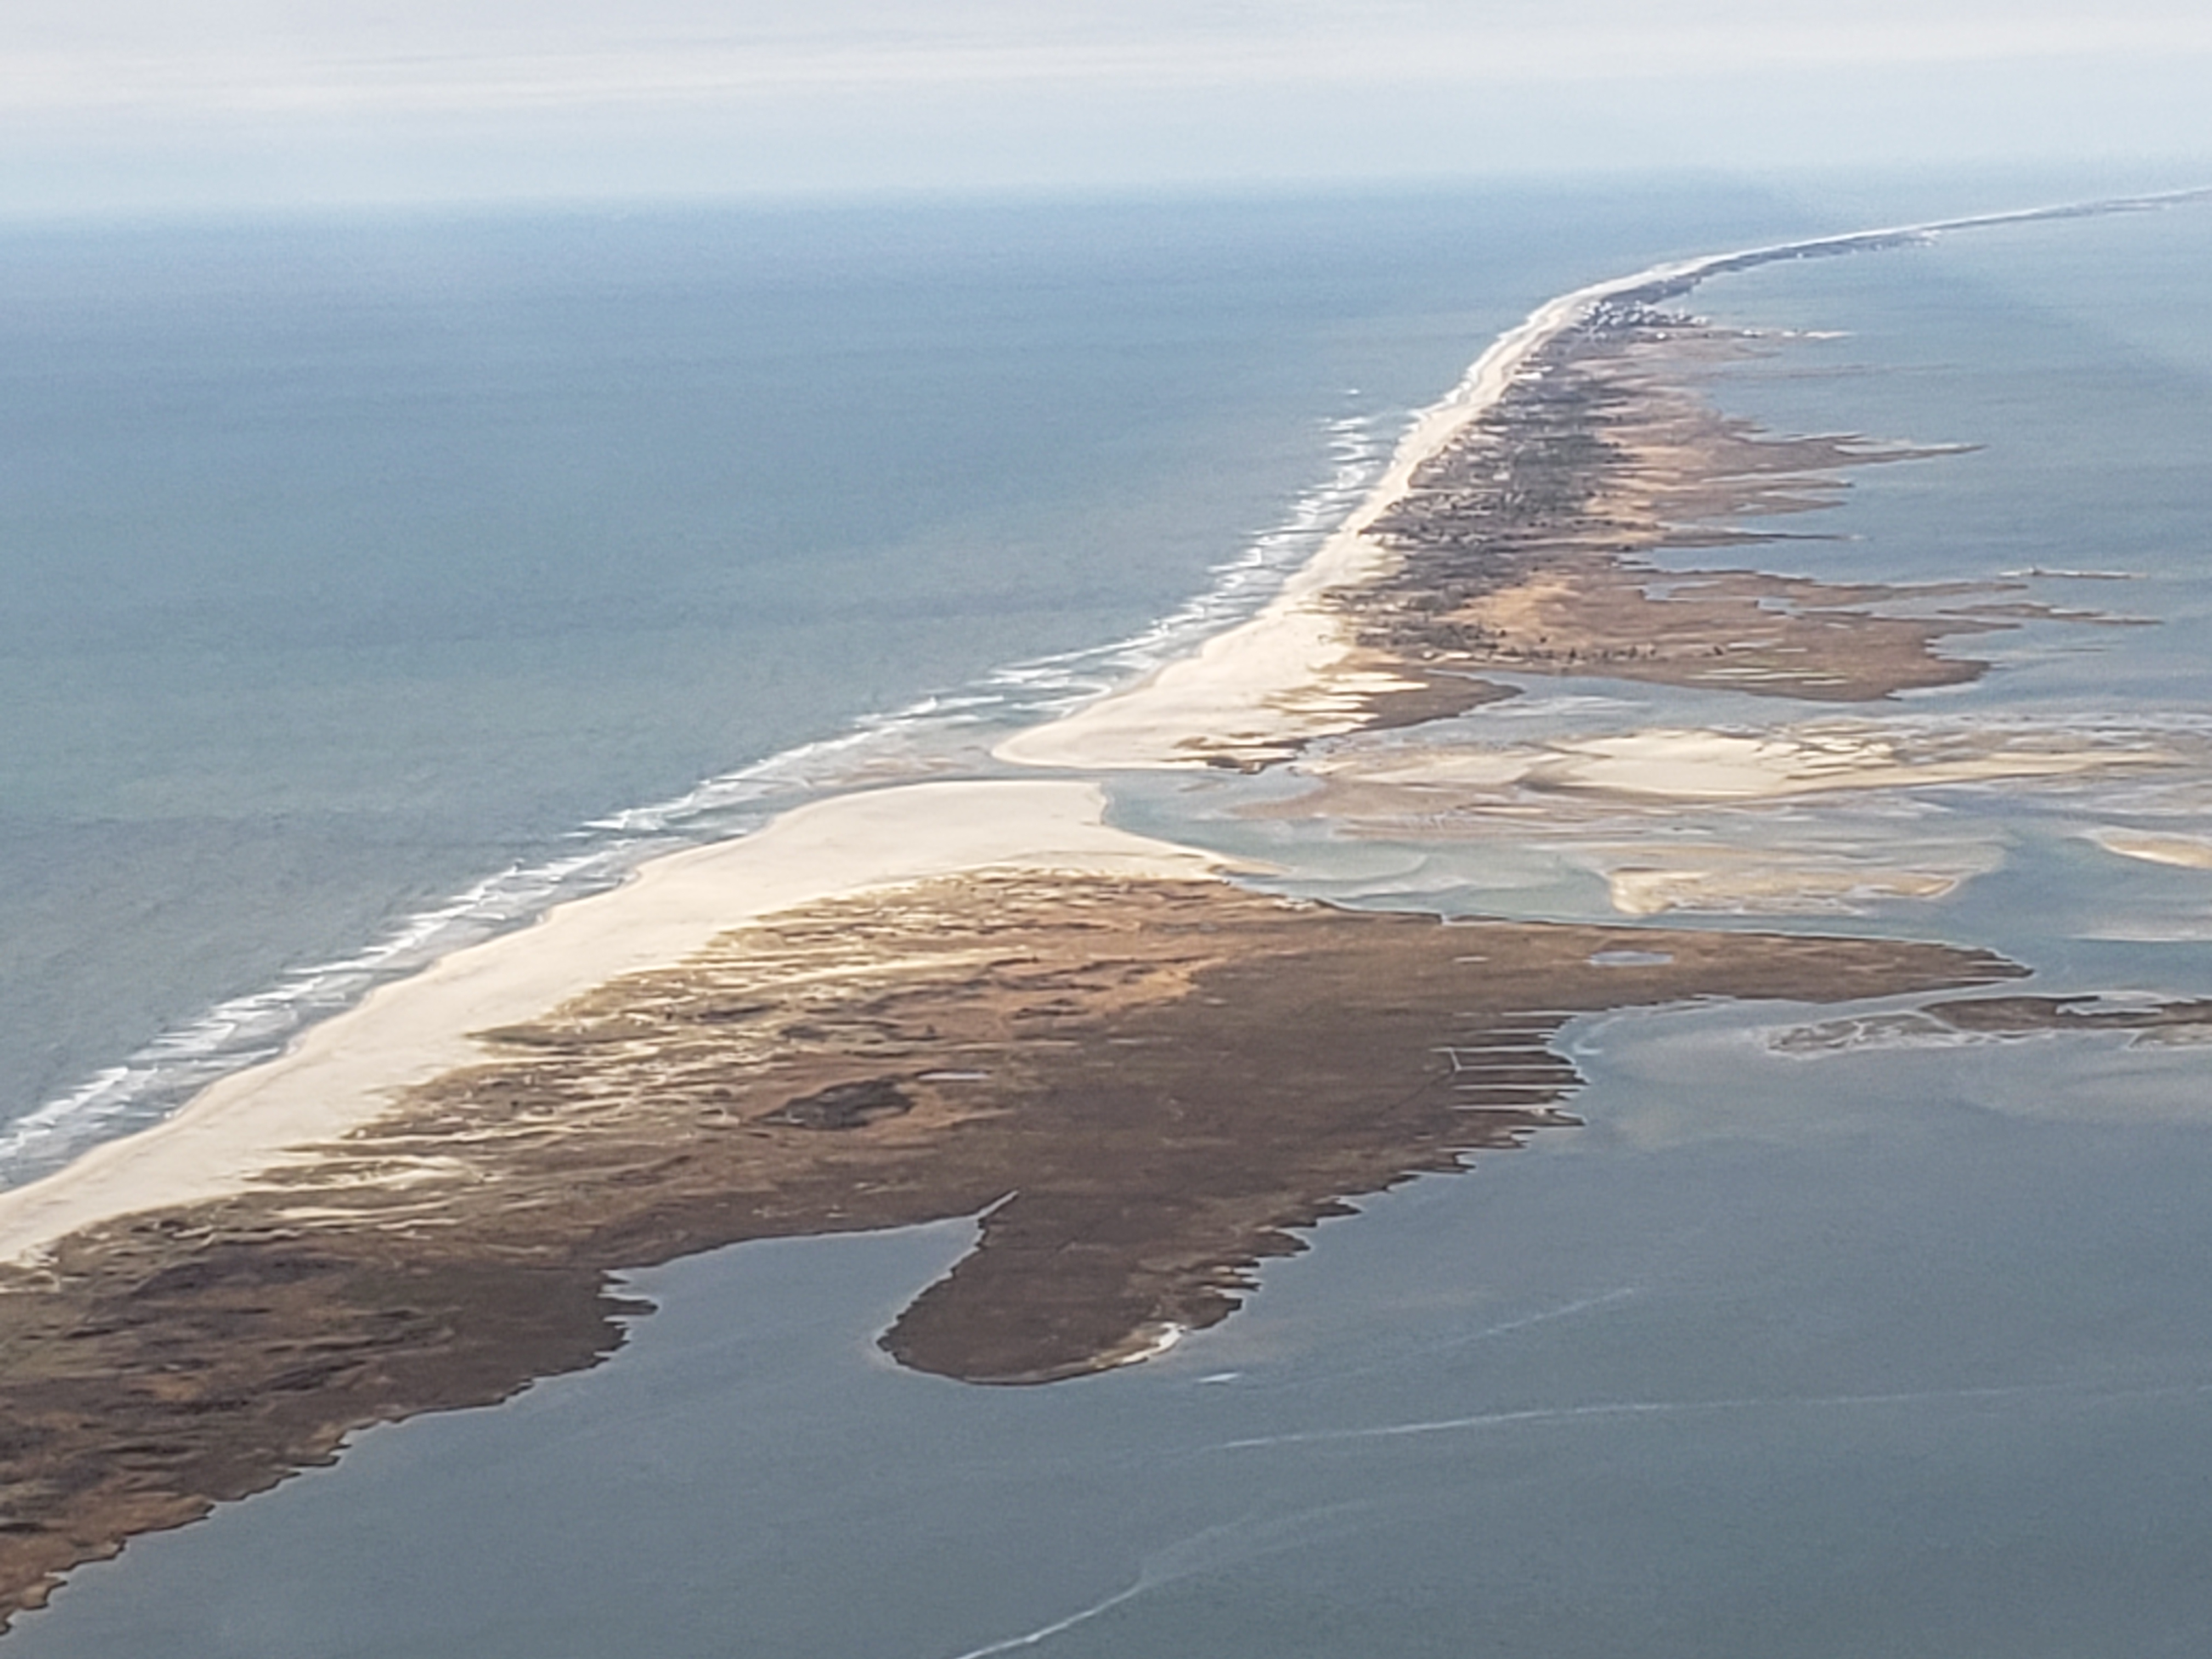  |
June 7, 2022 (RG&CF) 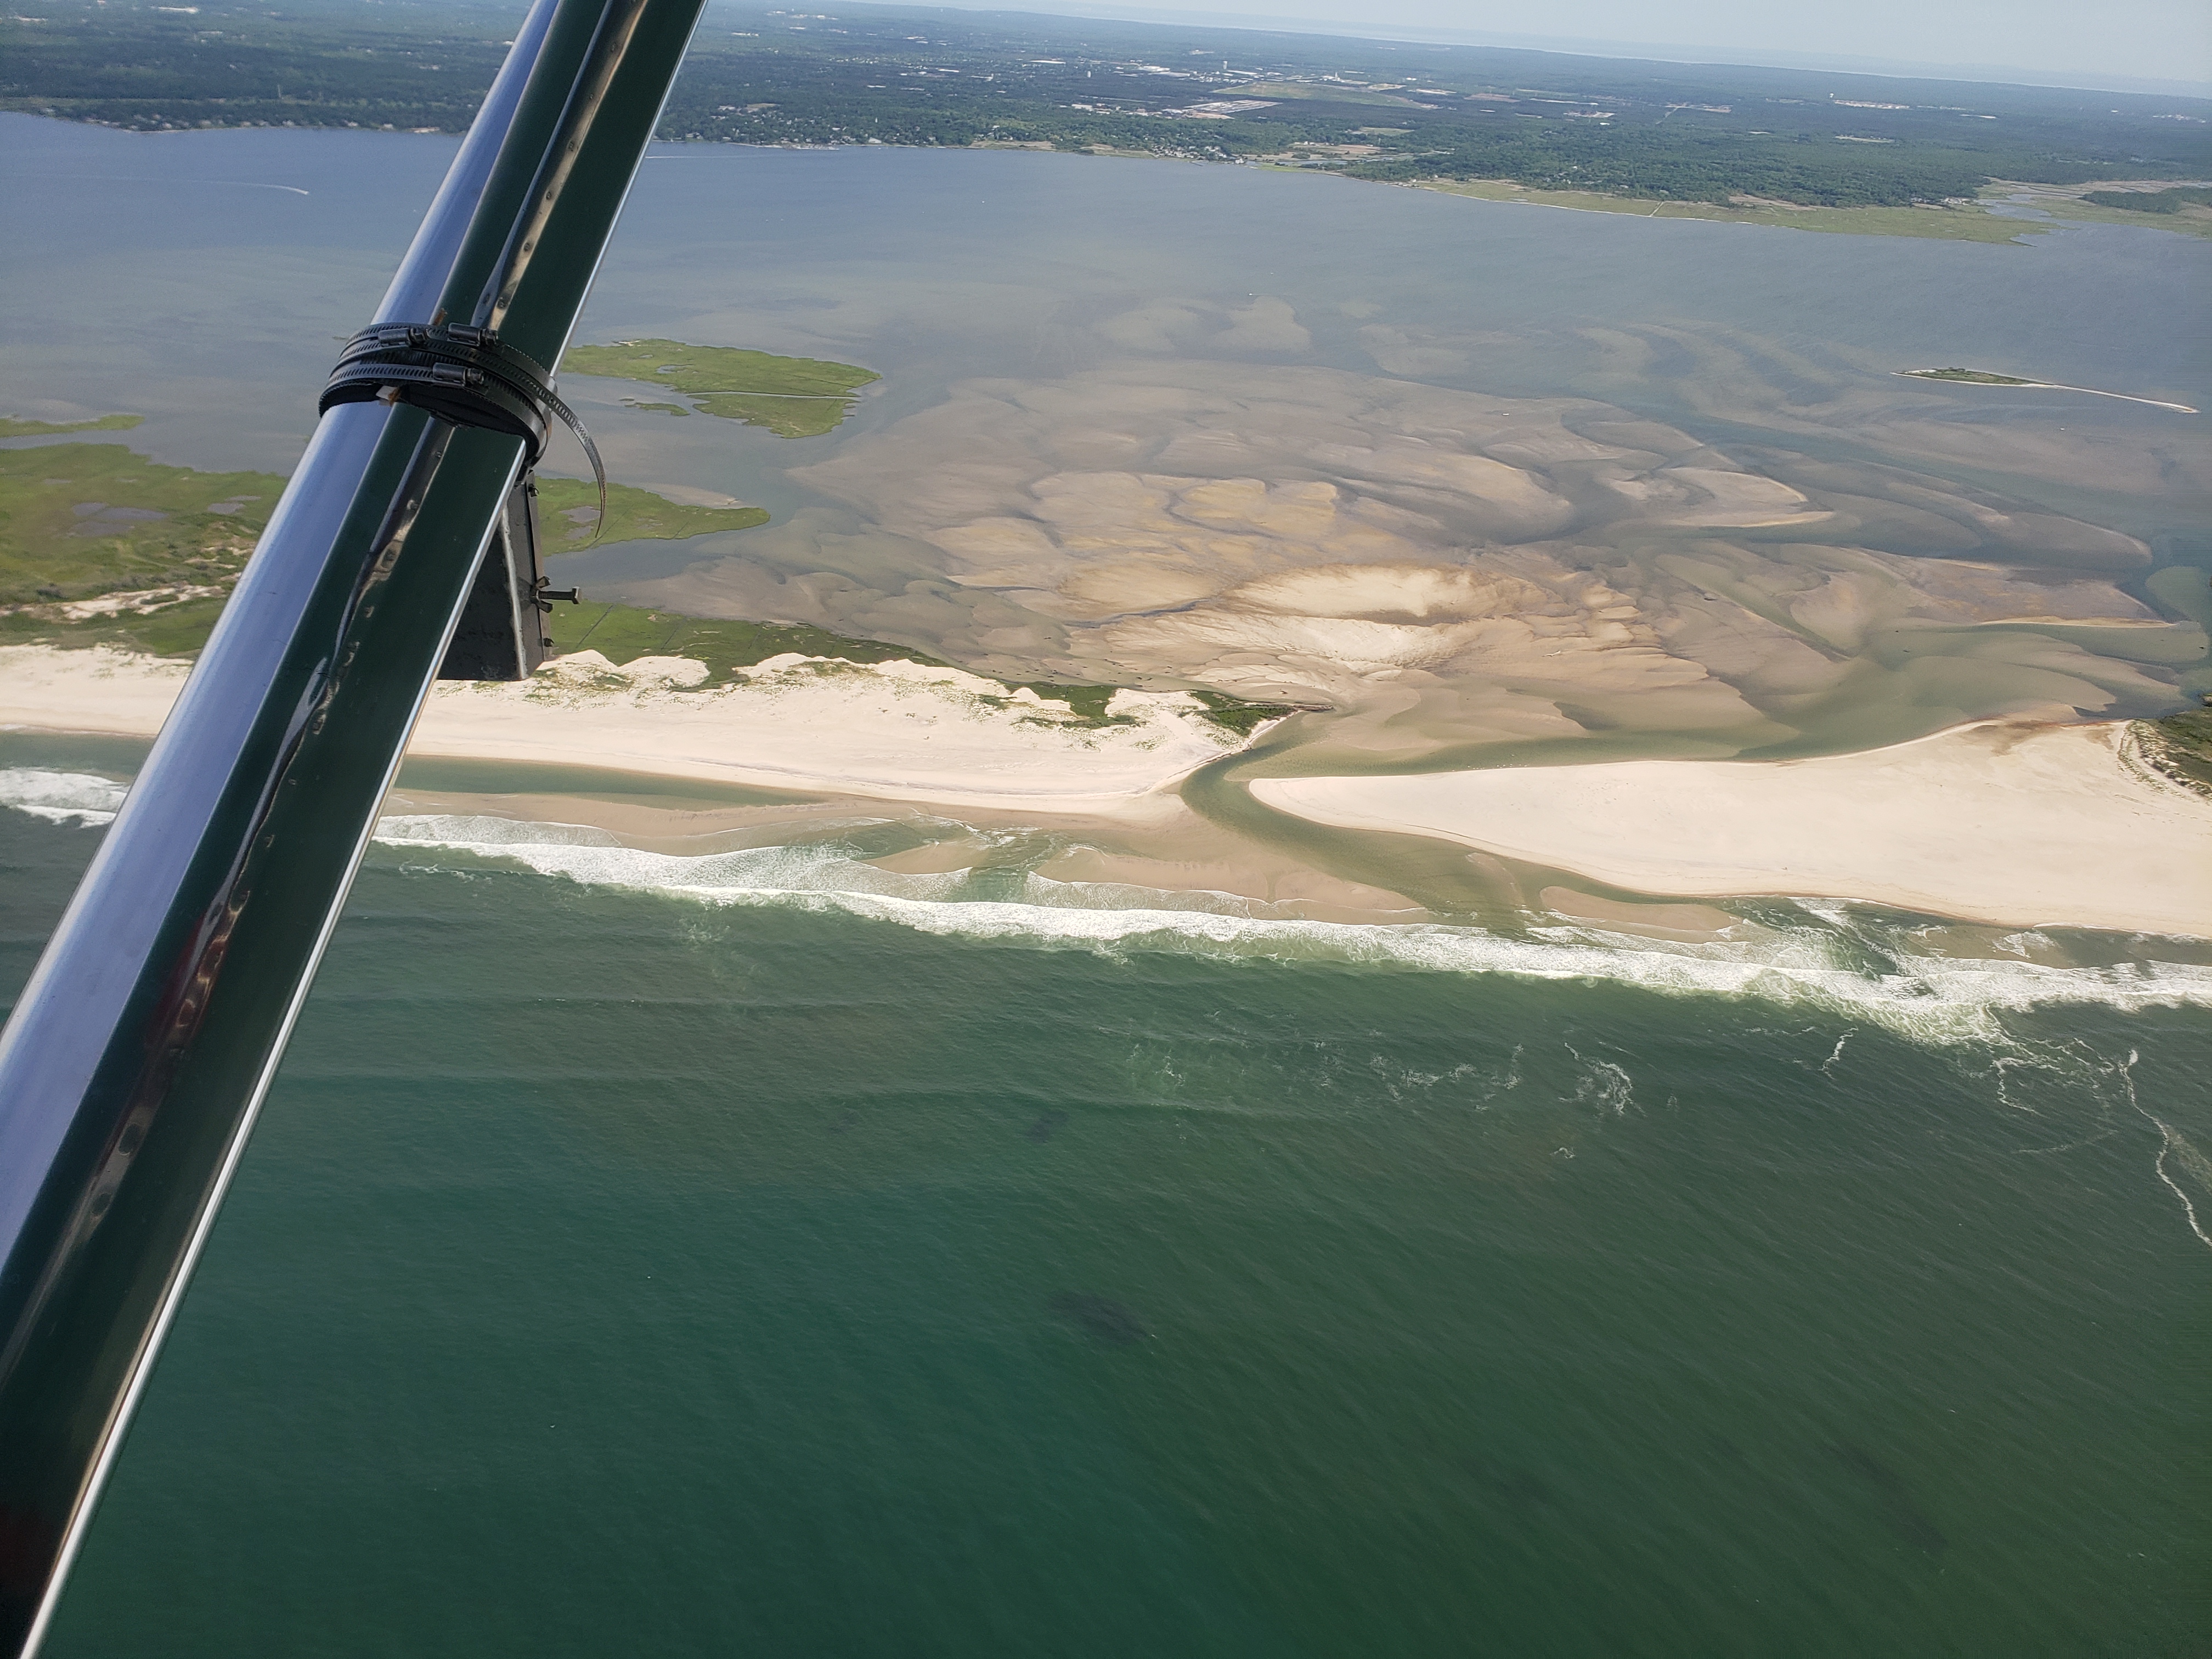 |
June 30, 202 (CF)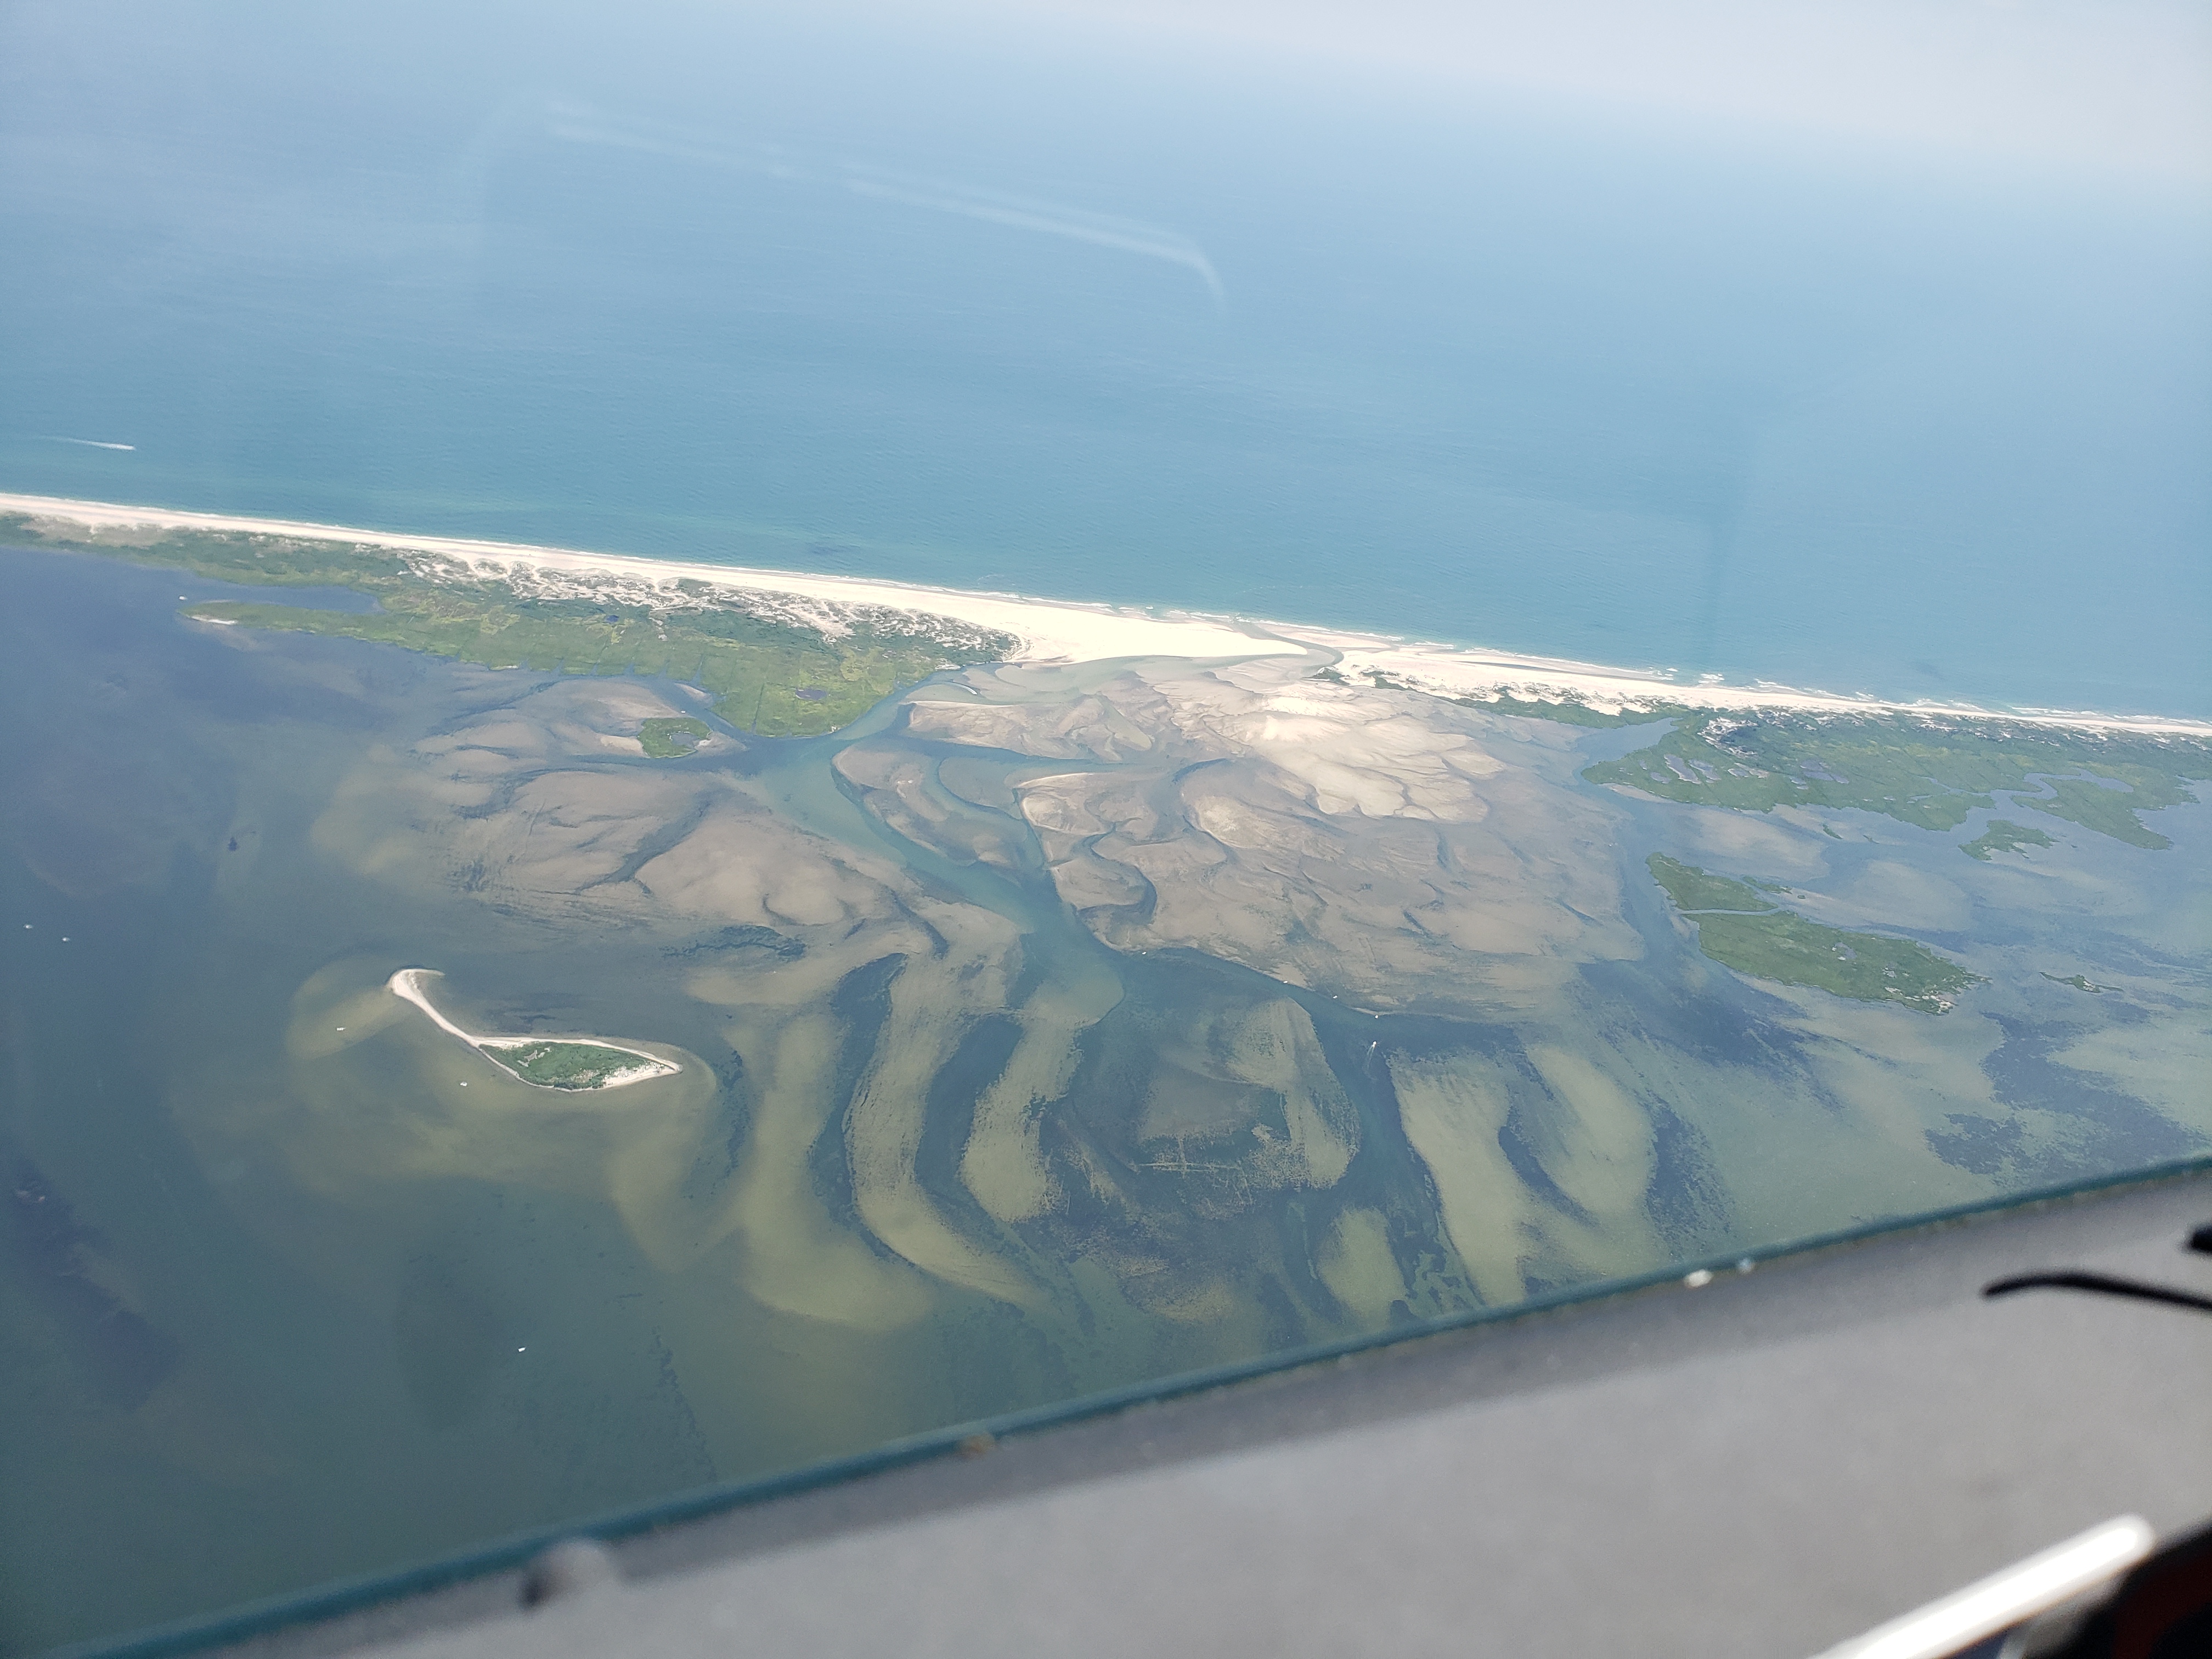 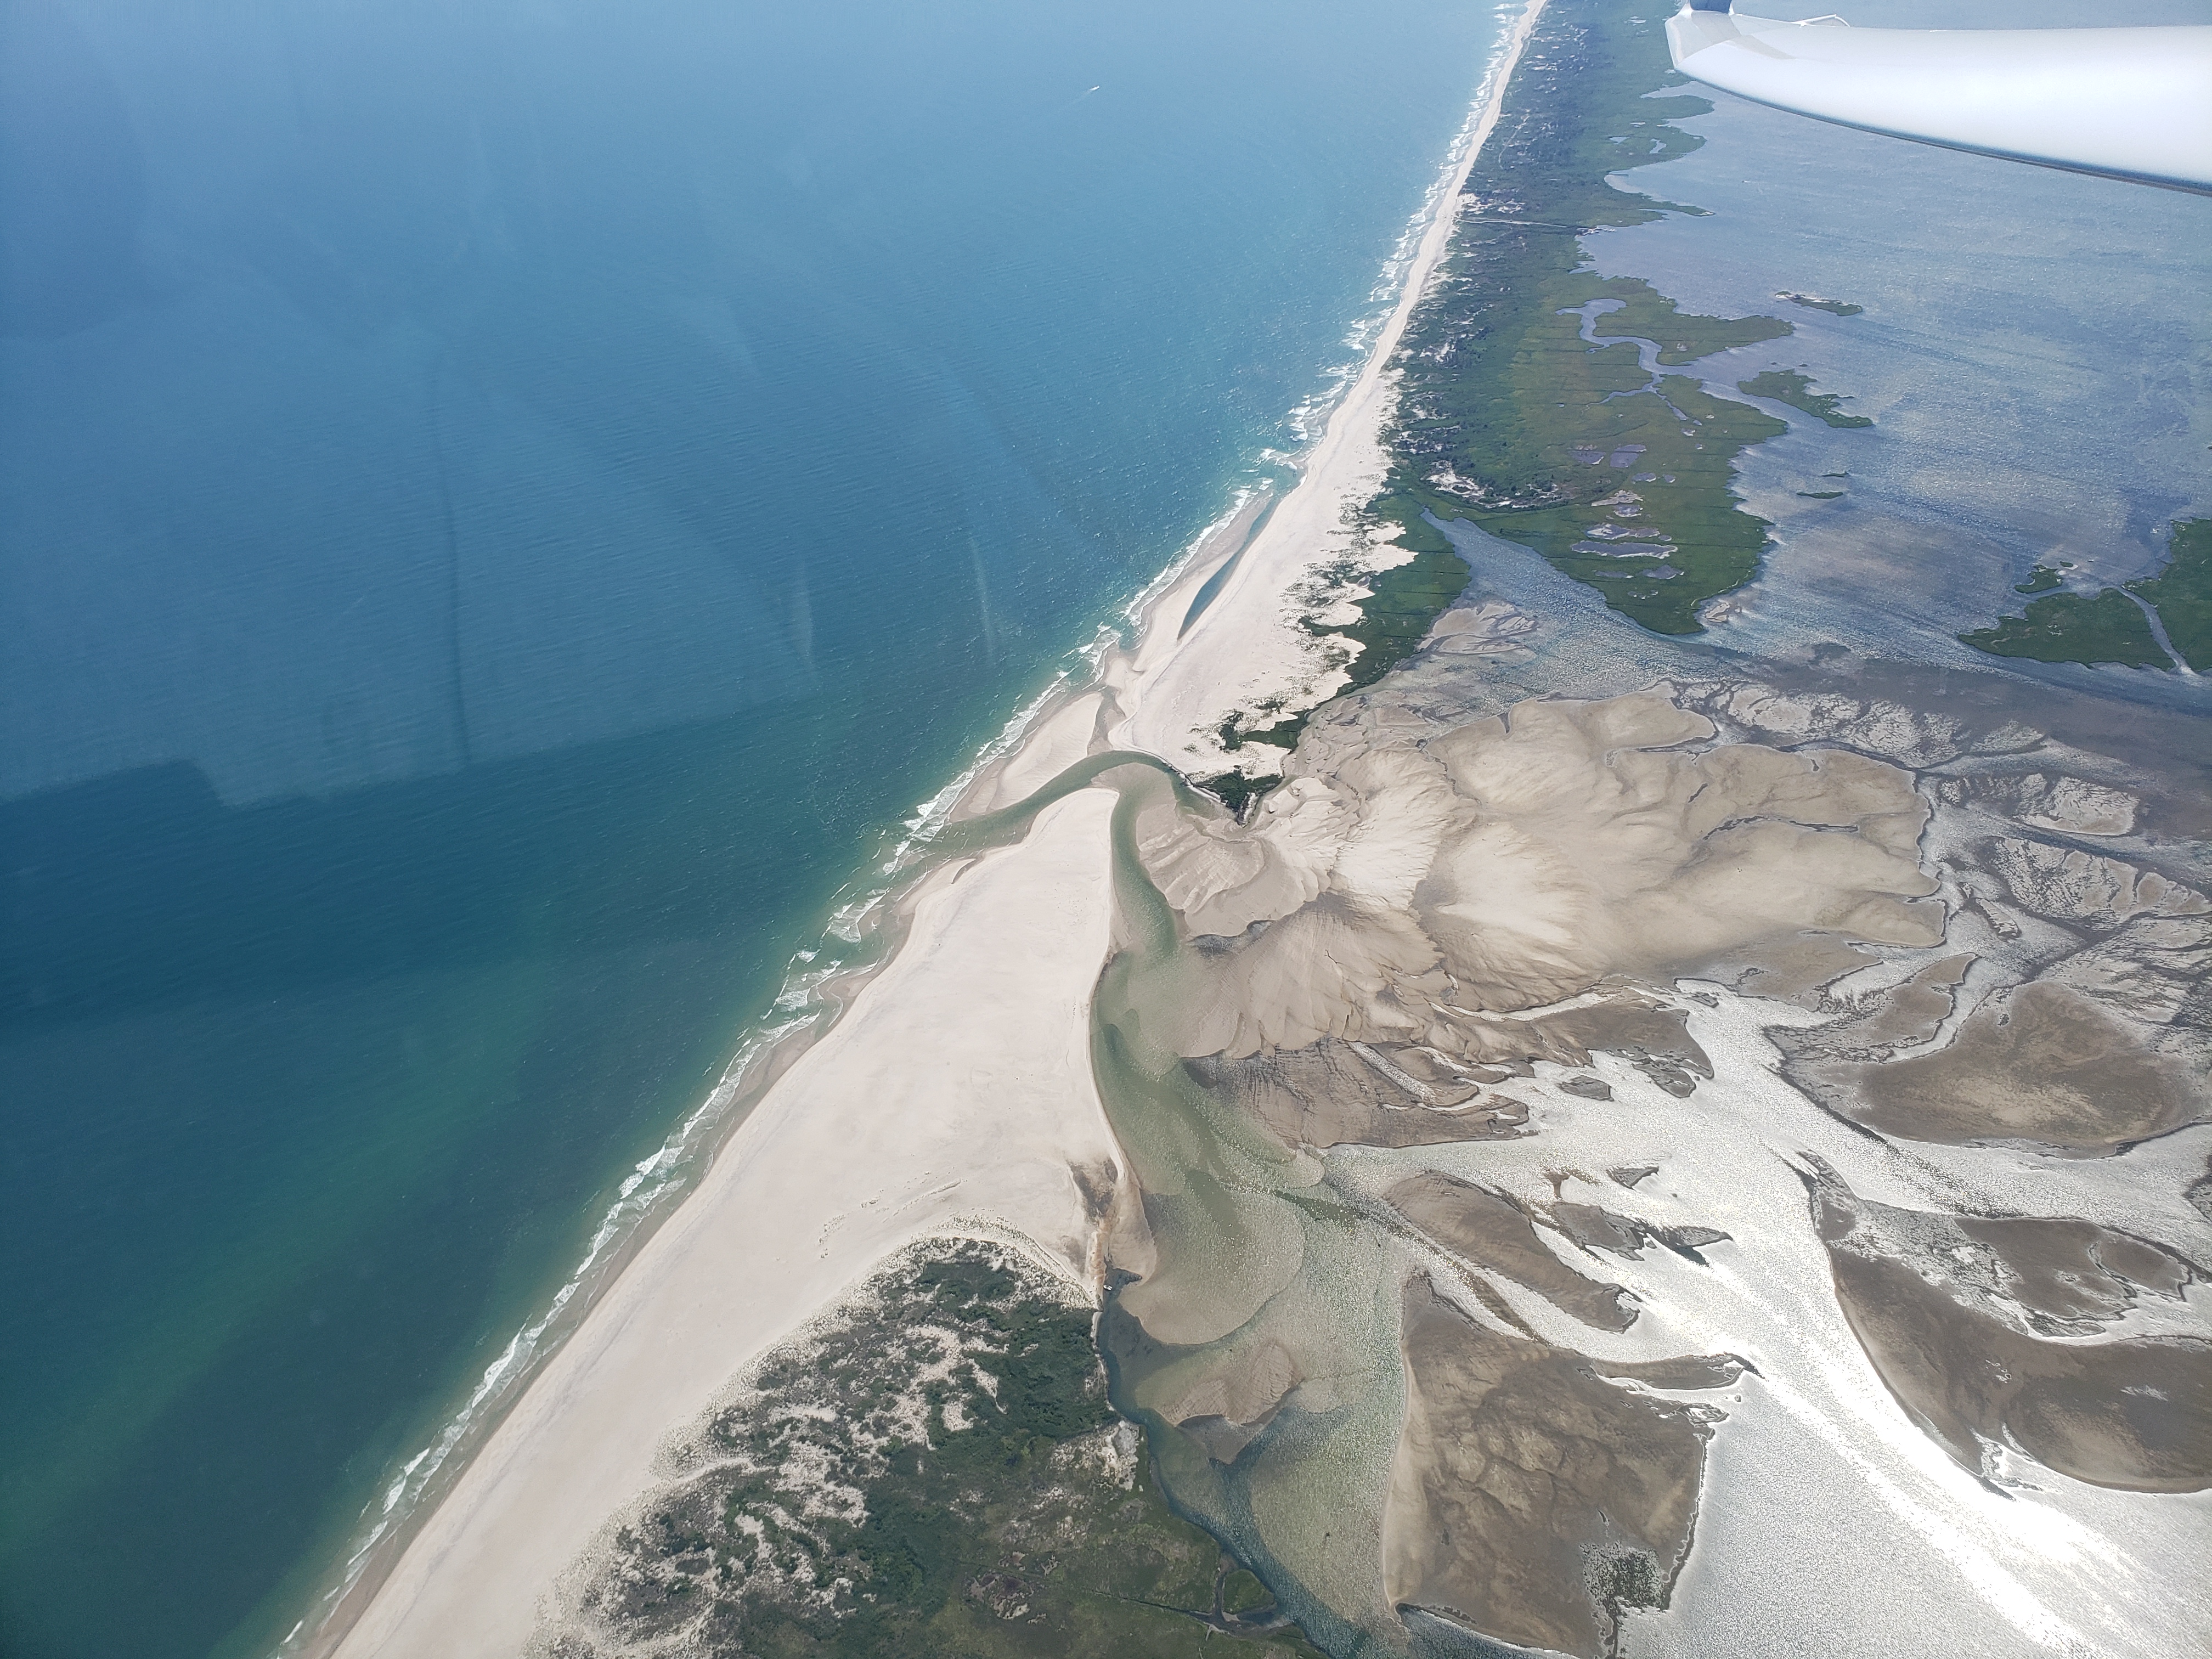 |
||||
July_10_2022 (CF)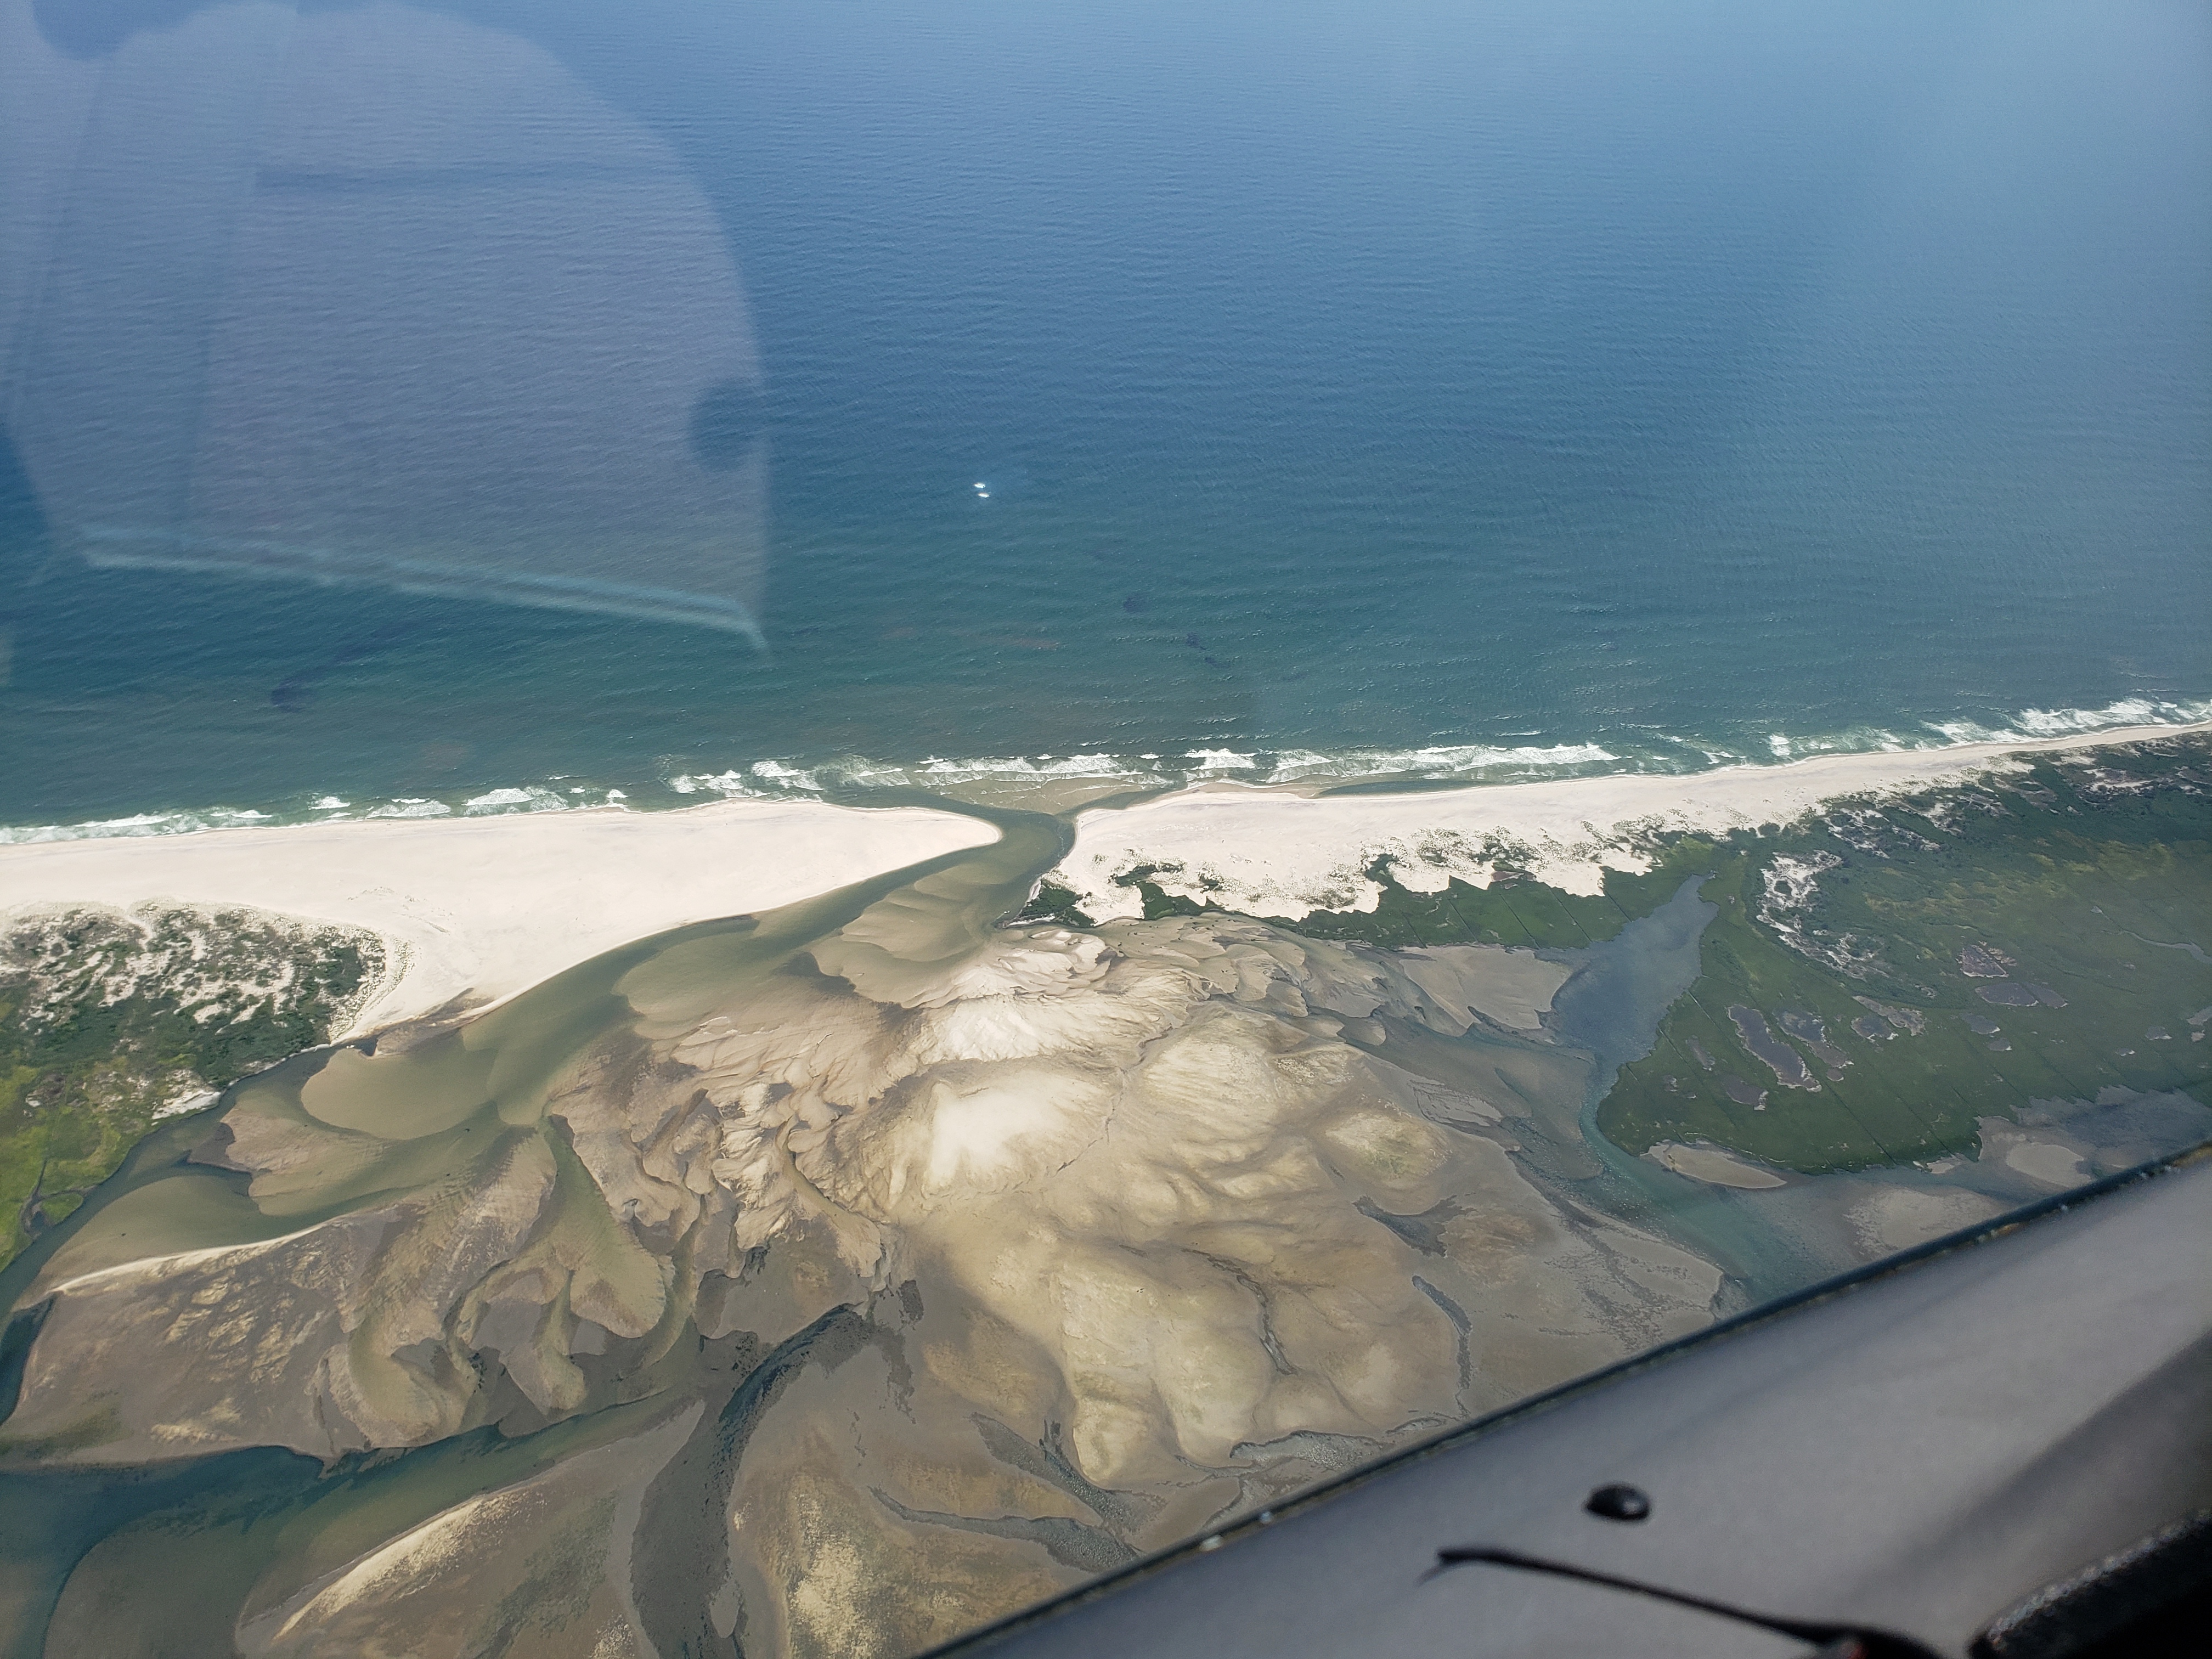 |
July_16_2022 (JV) 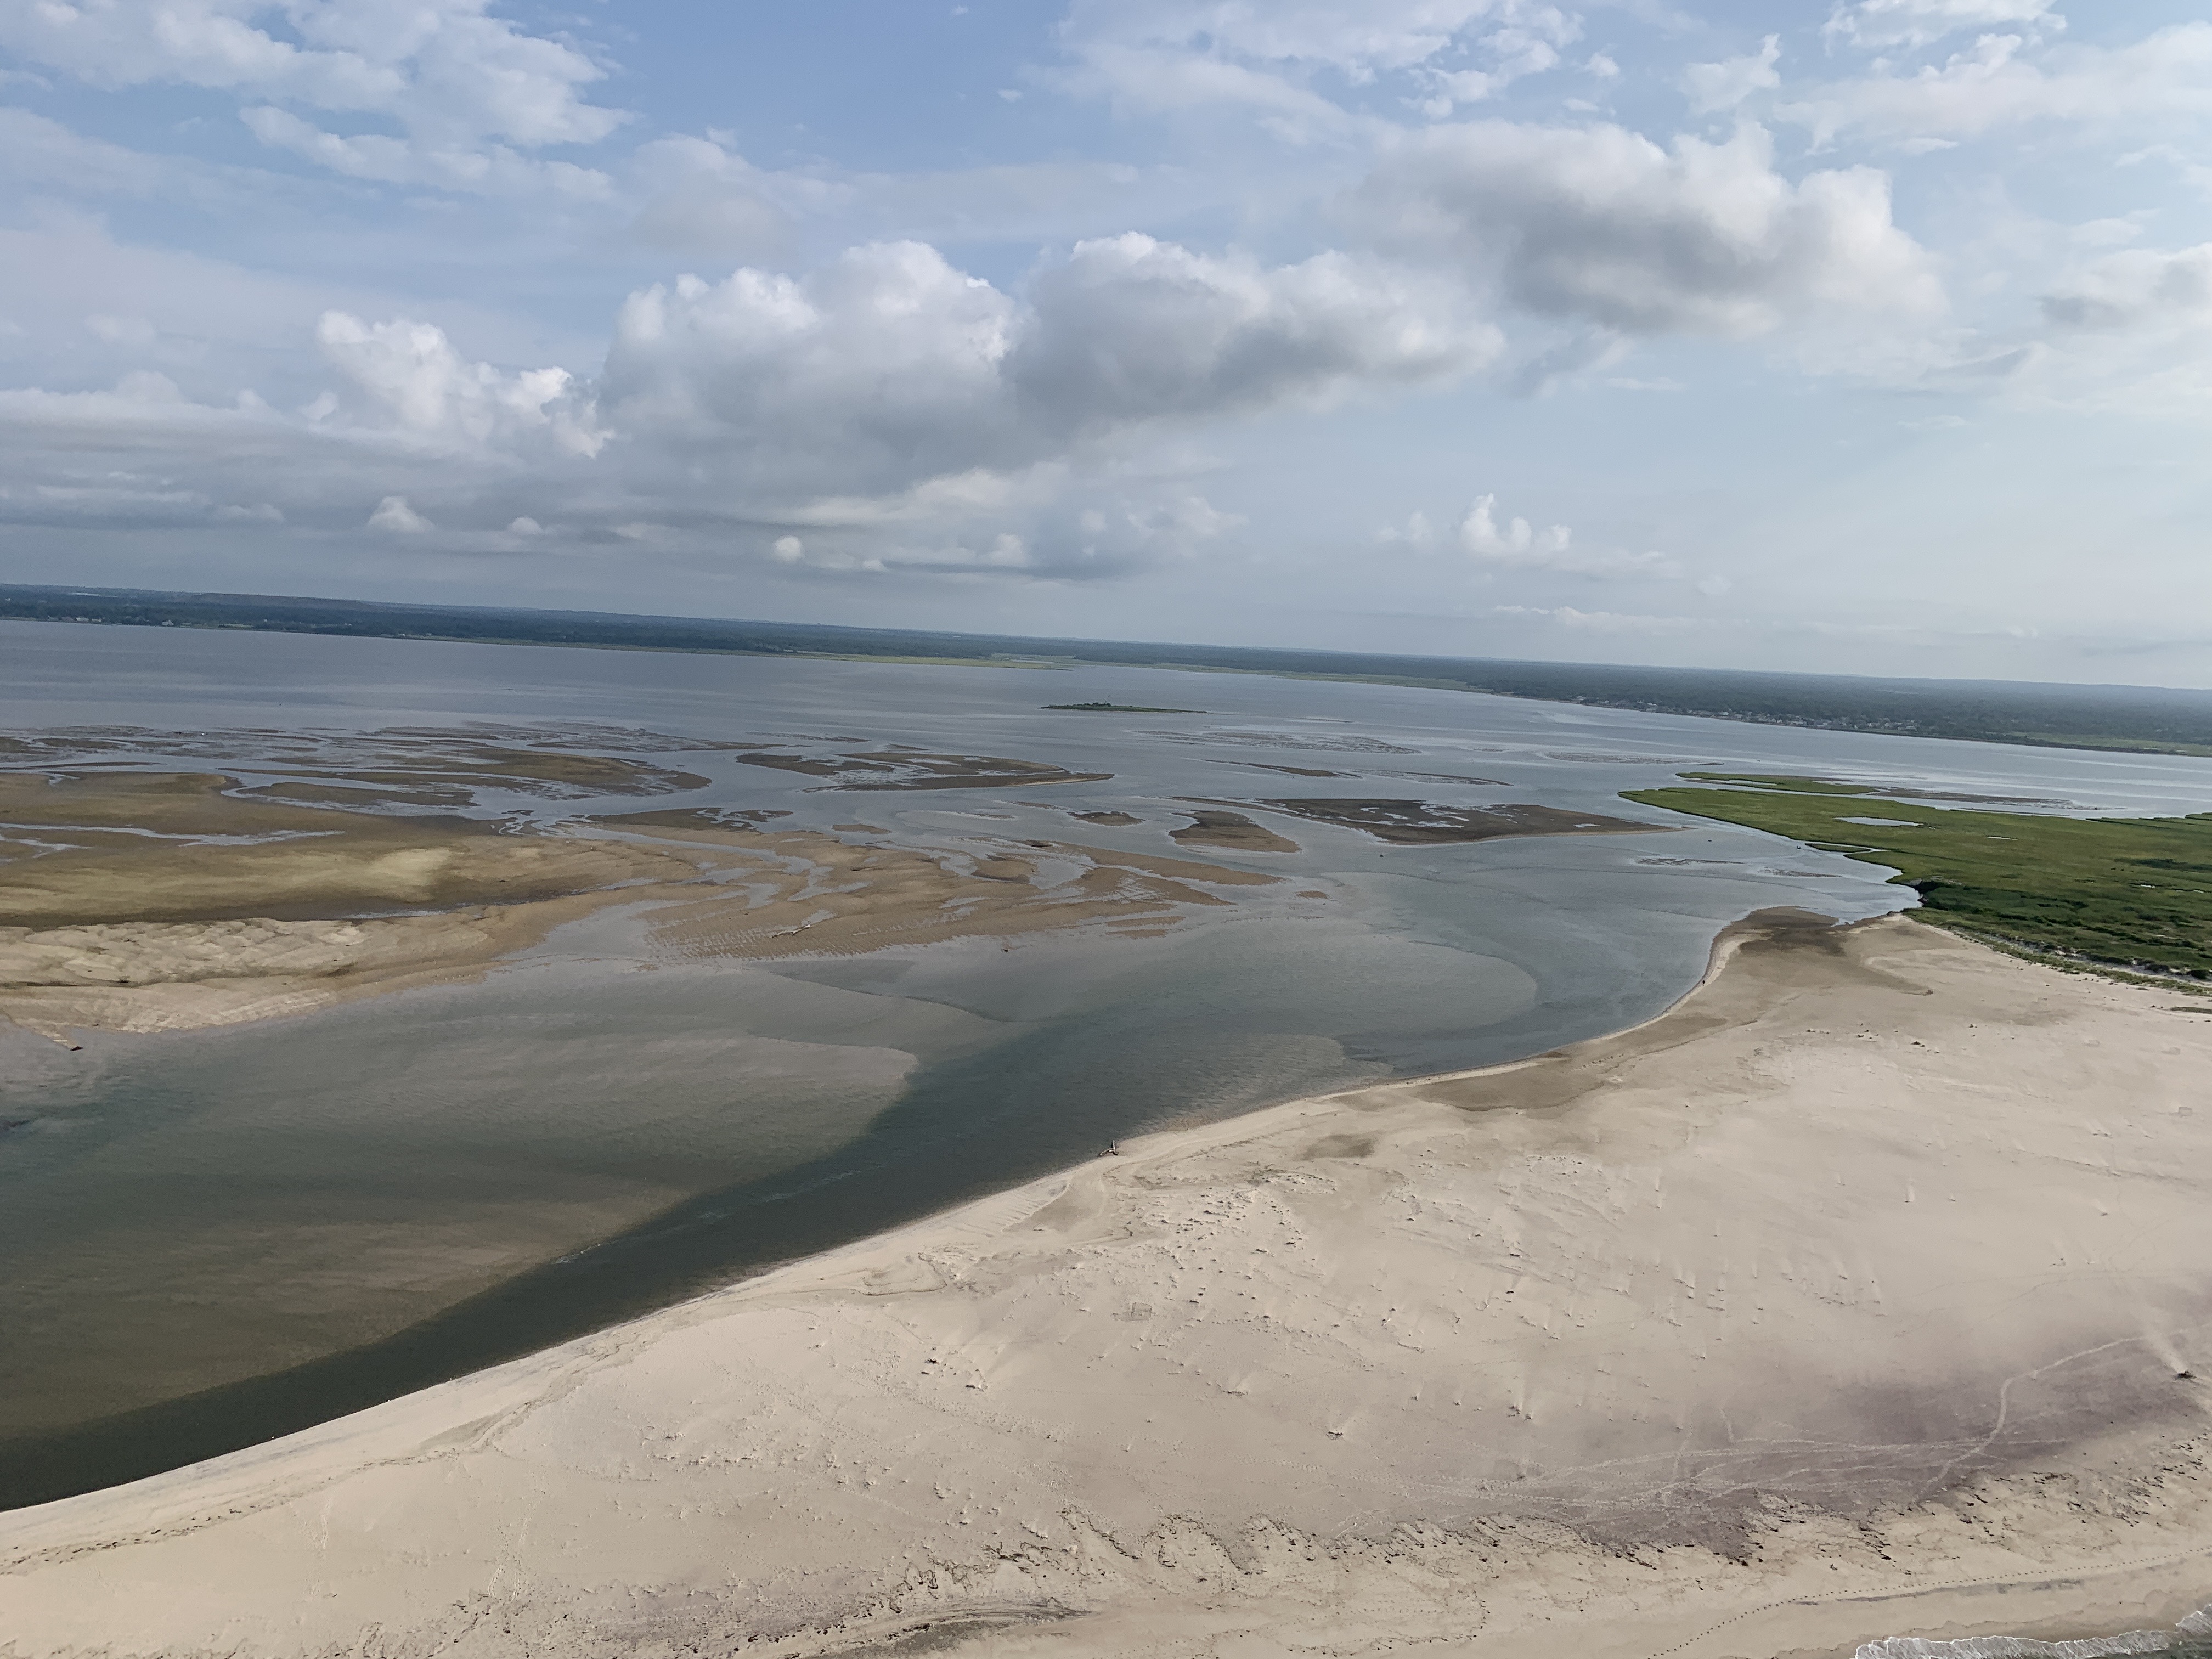 |
Aug 9, 2022 (JV)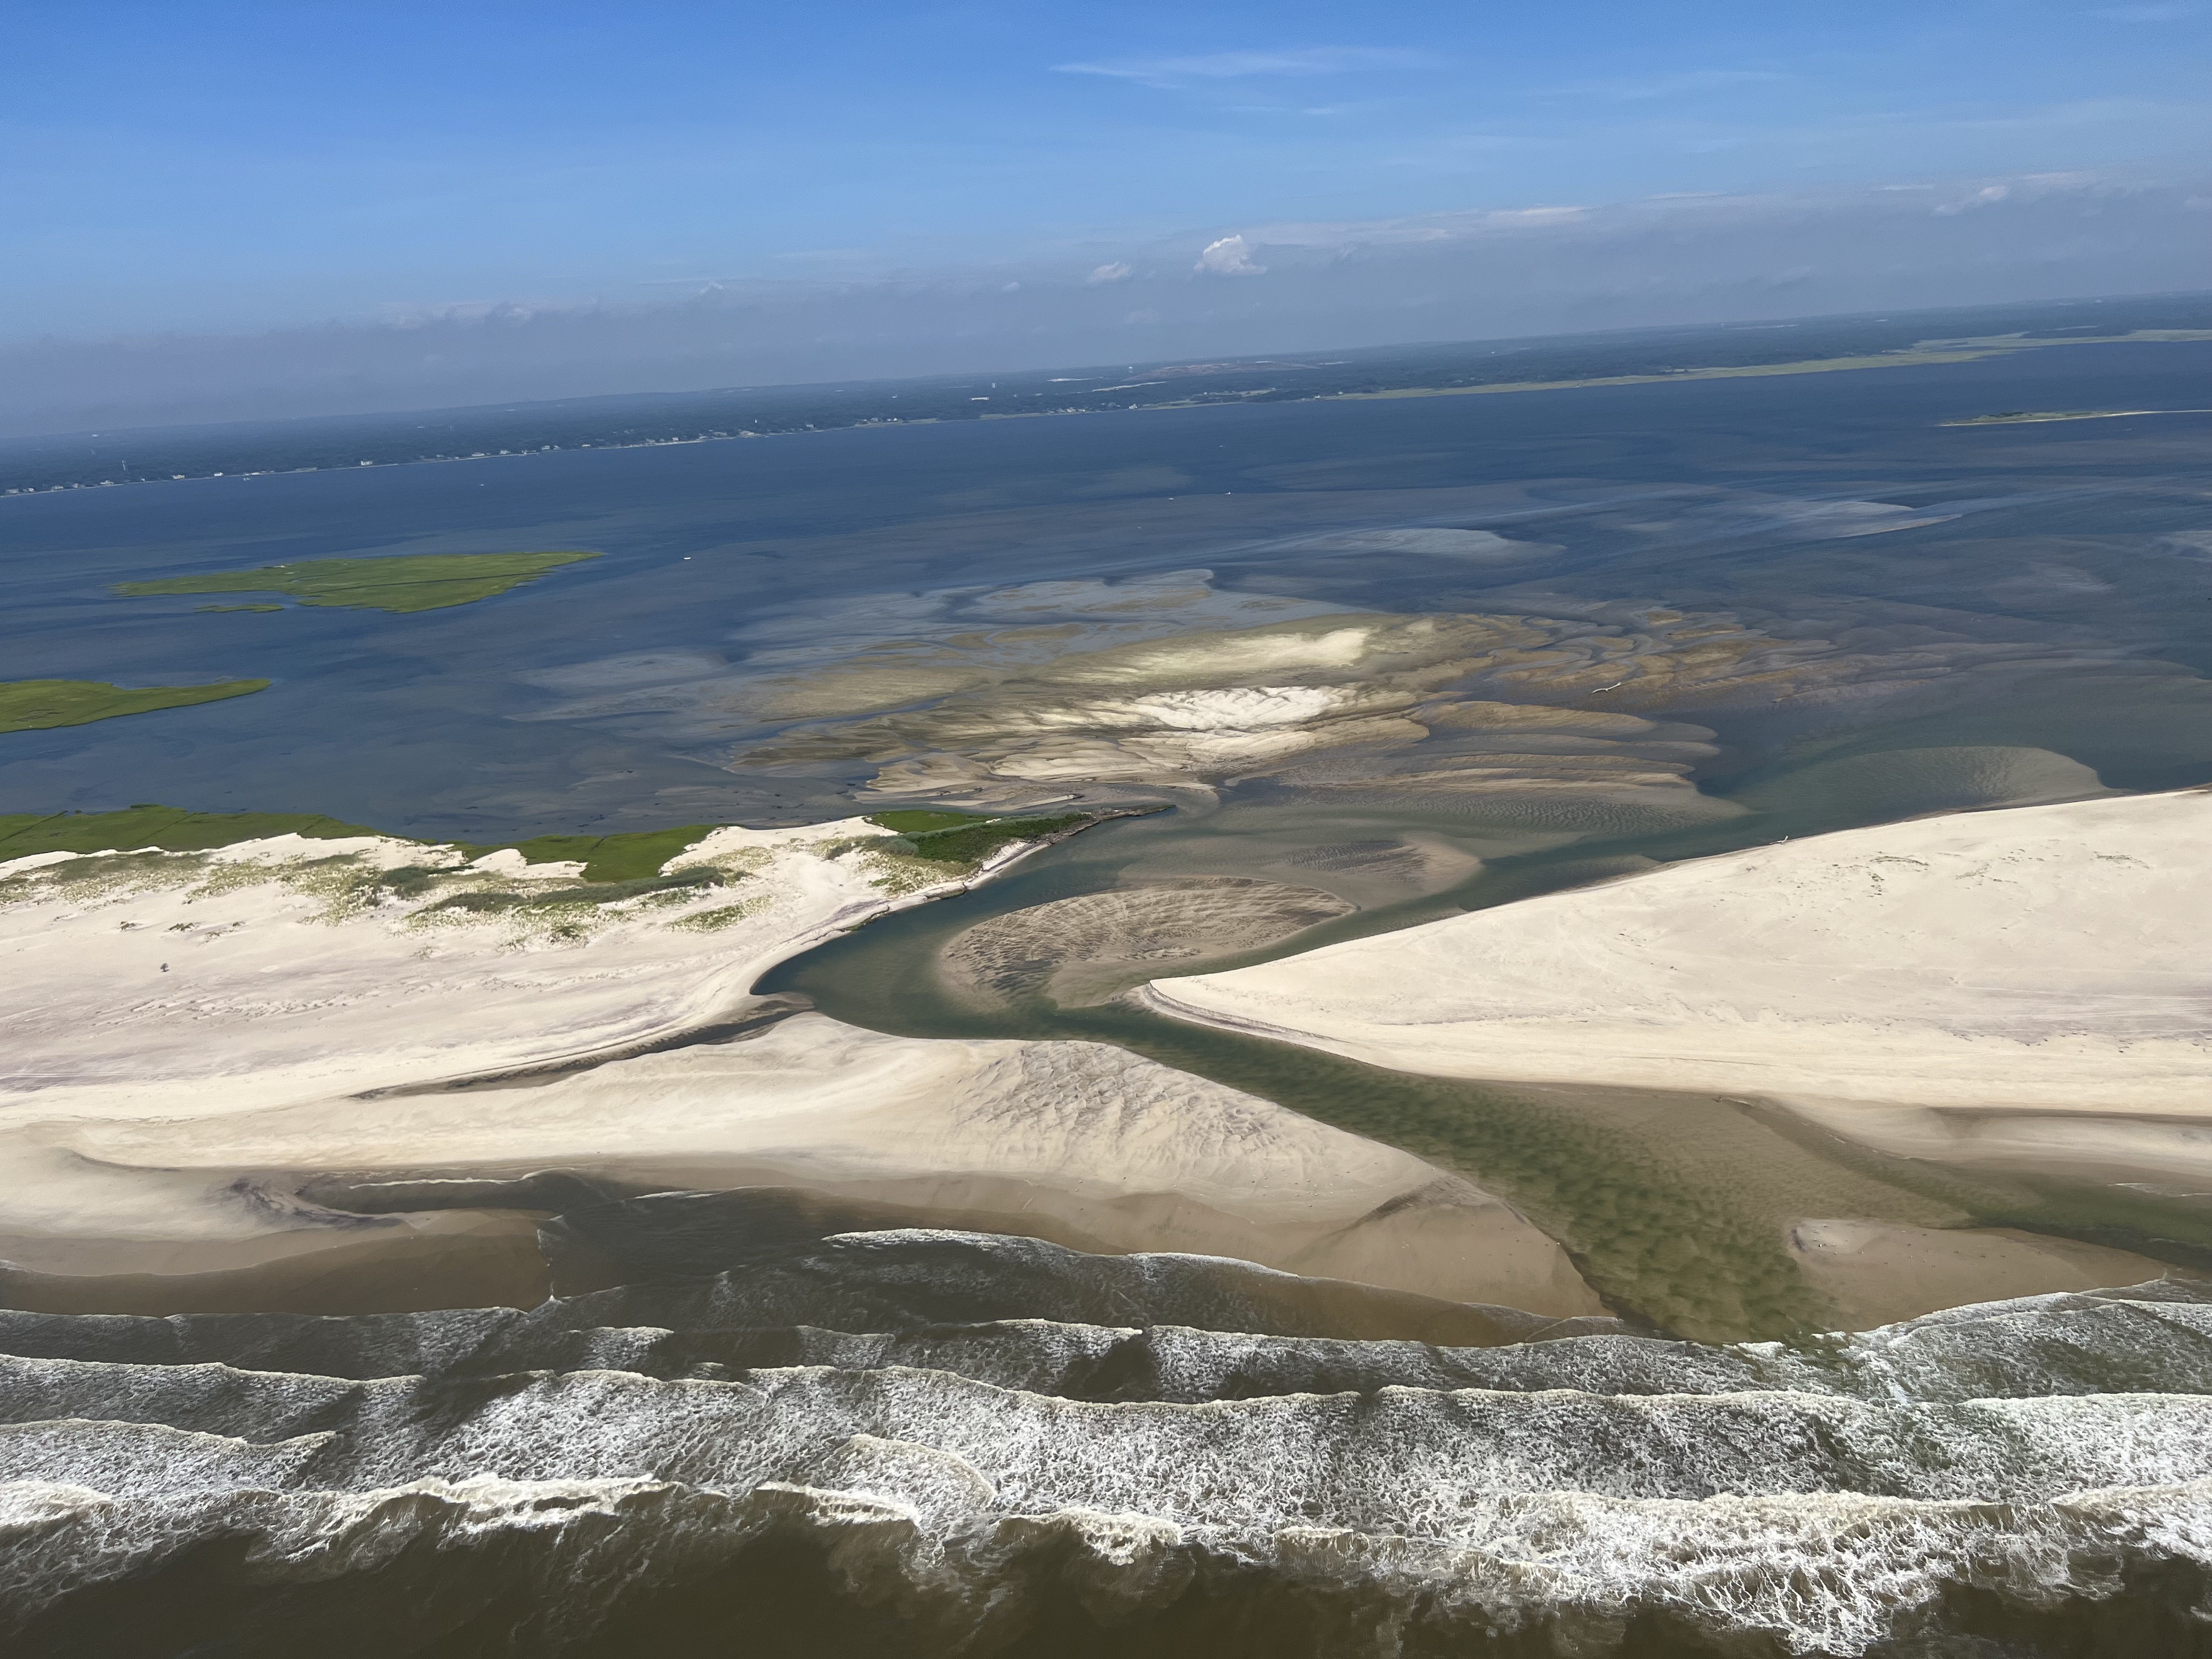 |
Aug 13, 2022 (CF)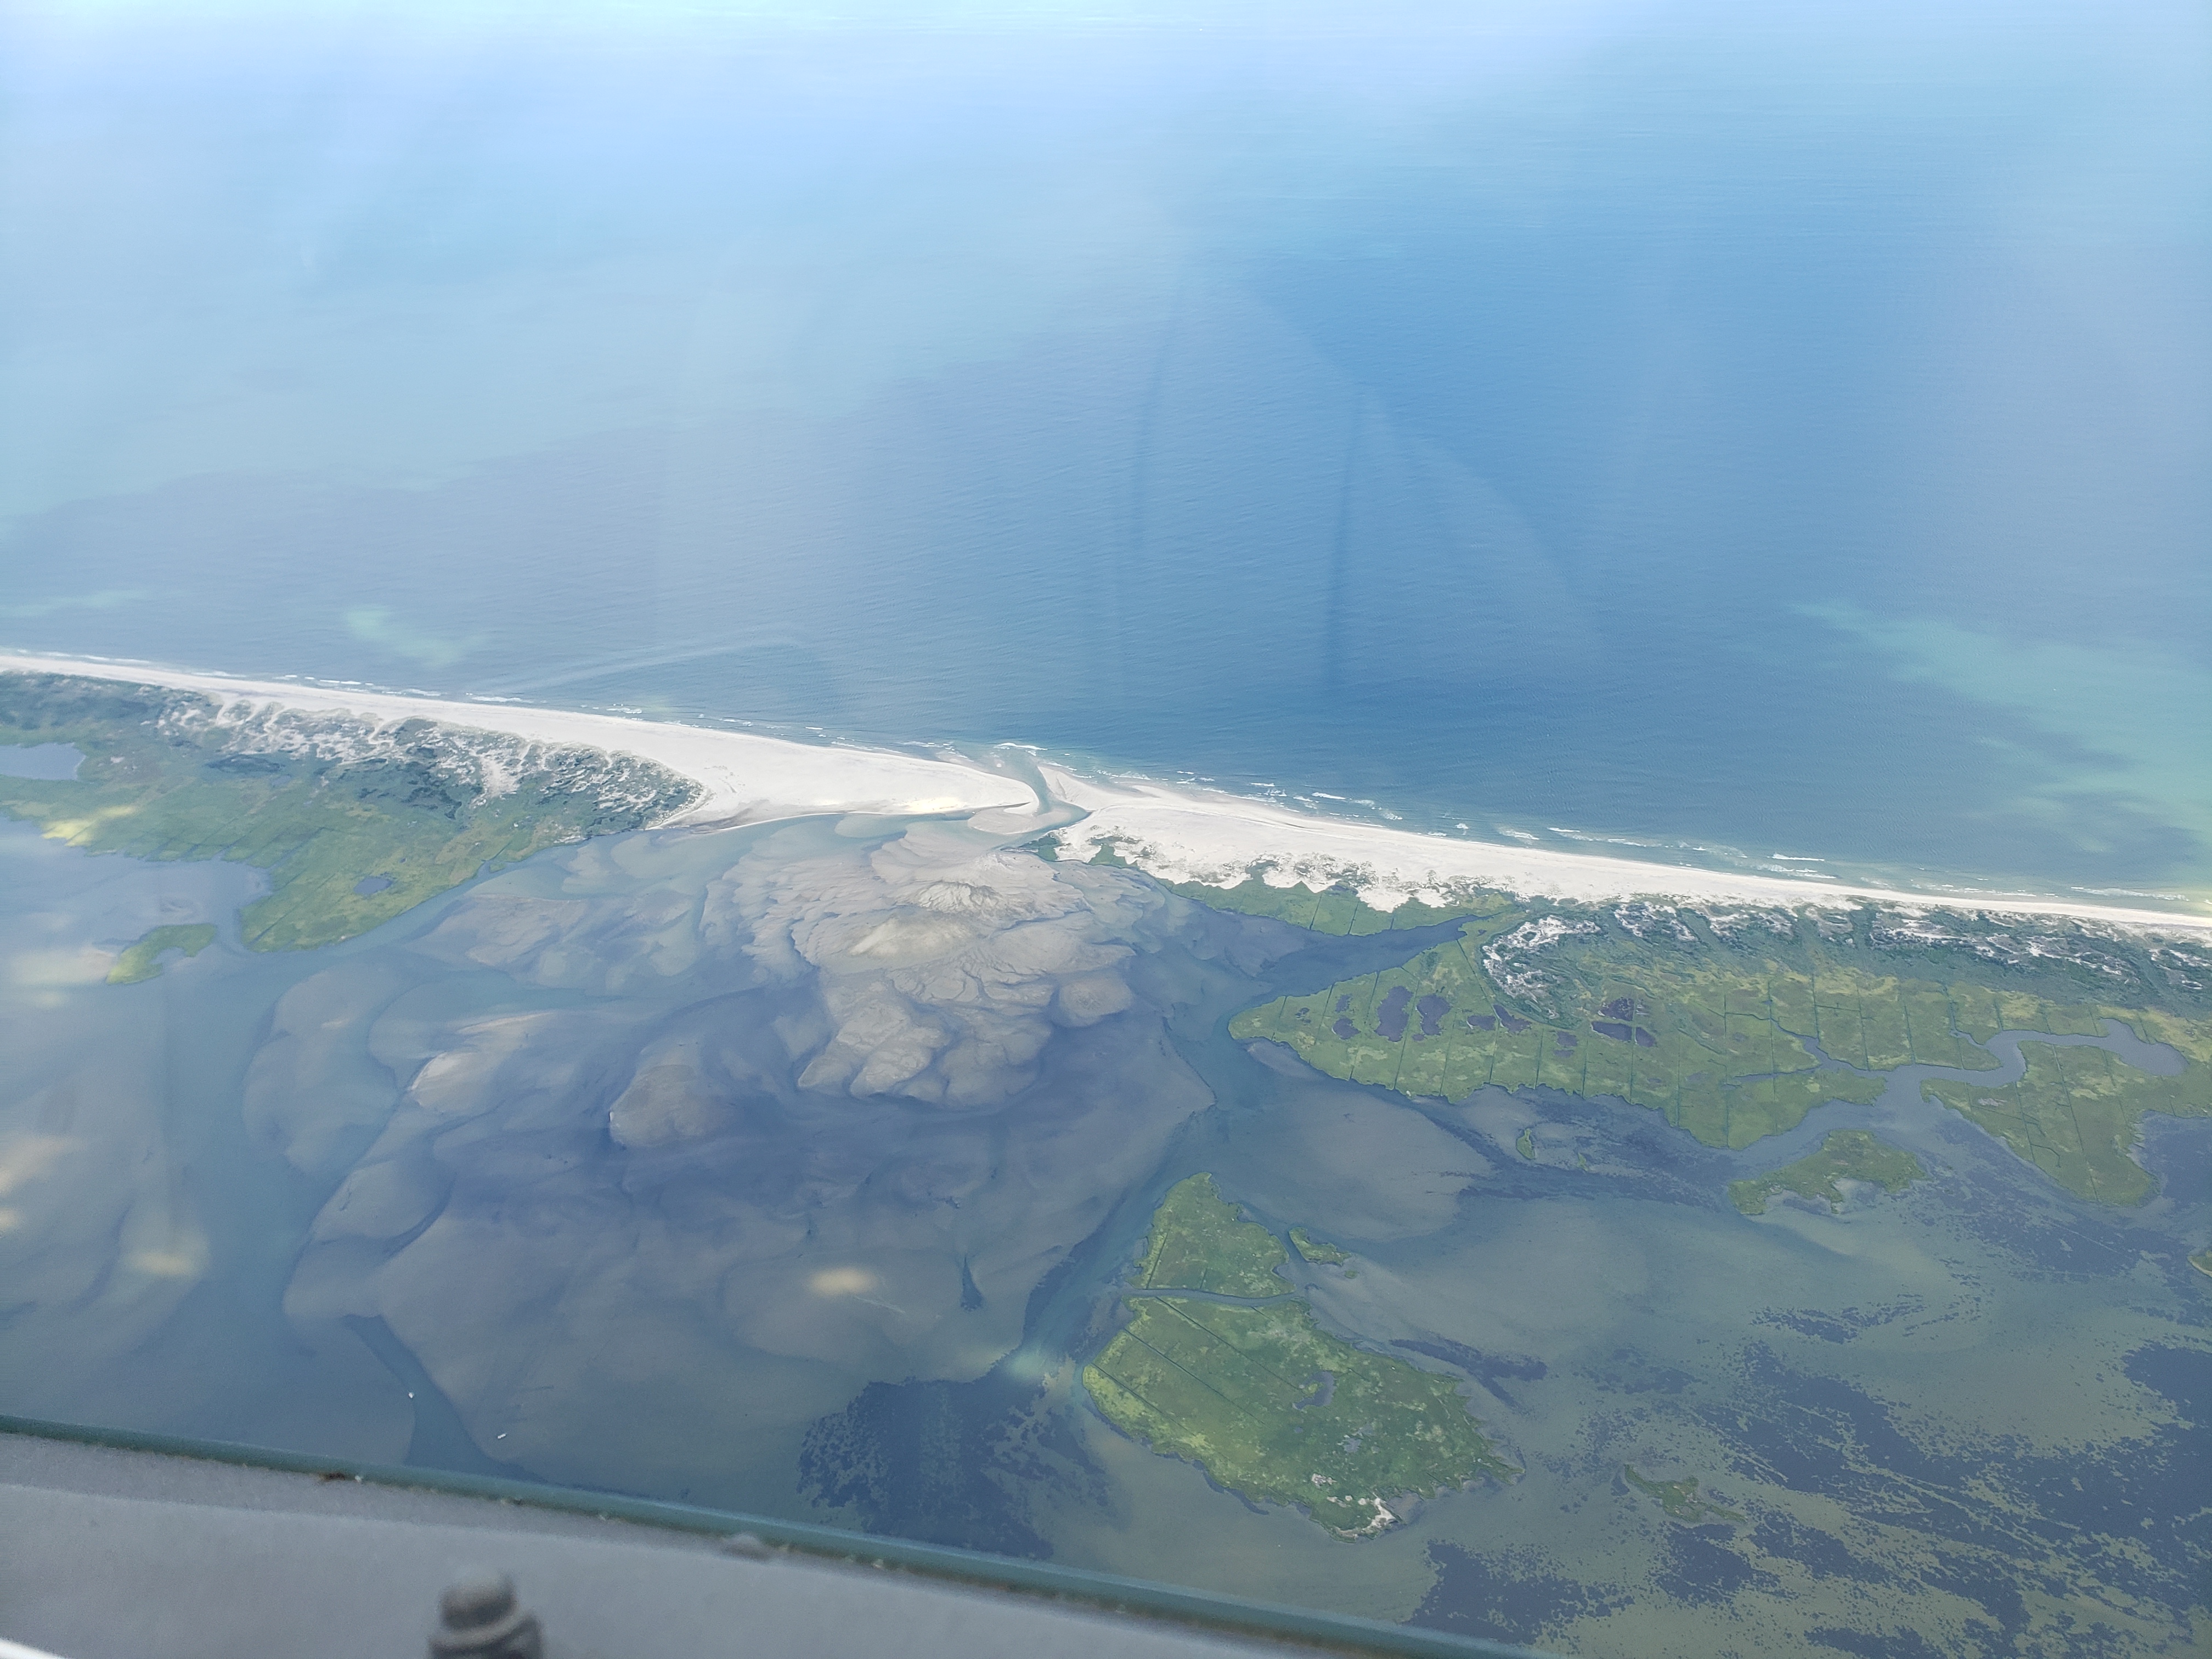 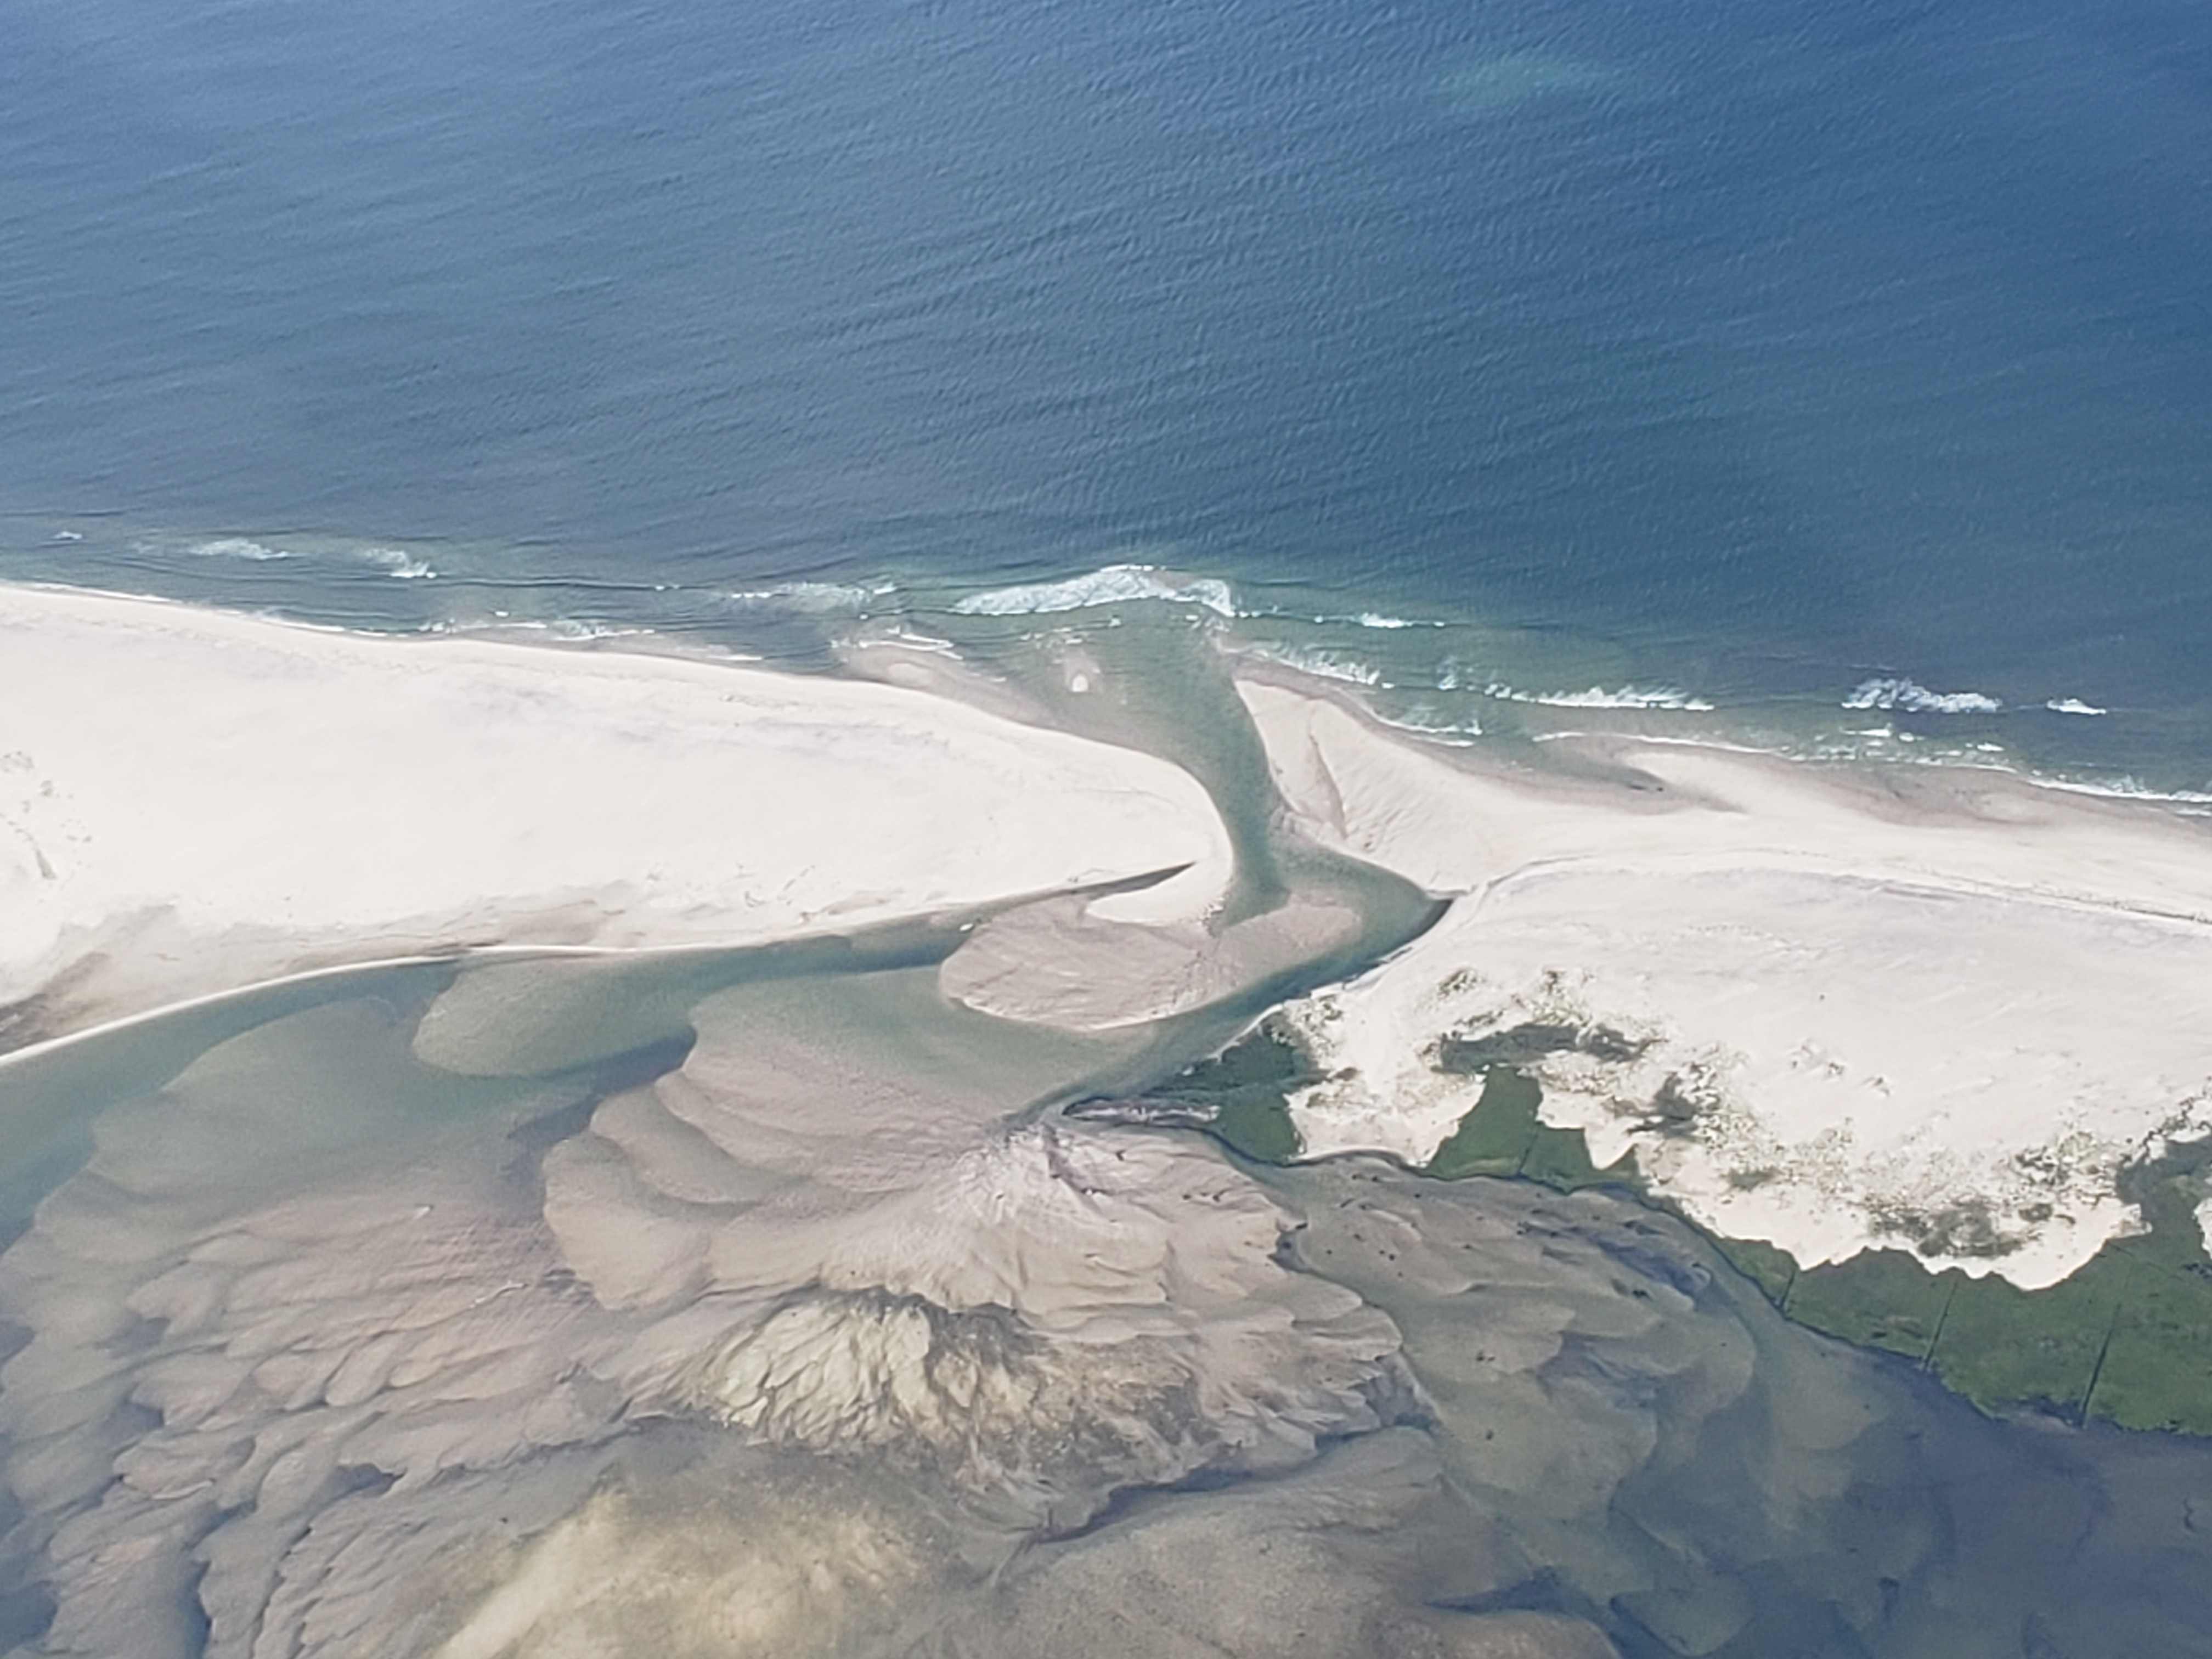 |
||||
Sept 10, 2022 (CF) 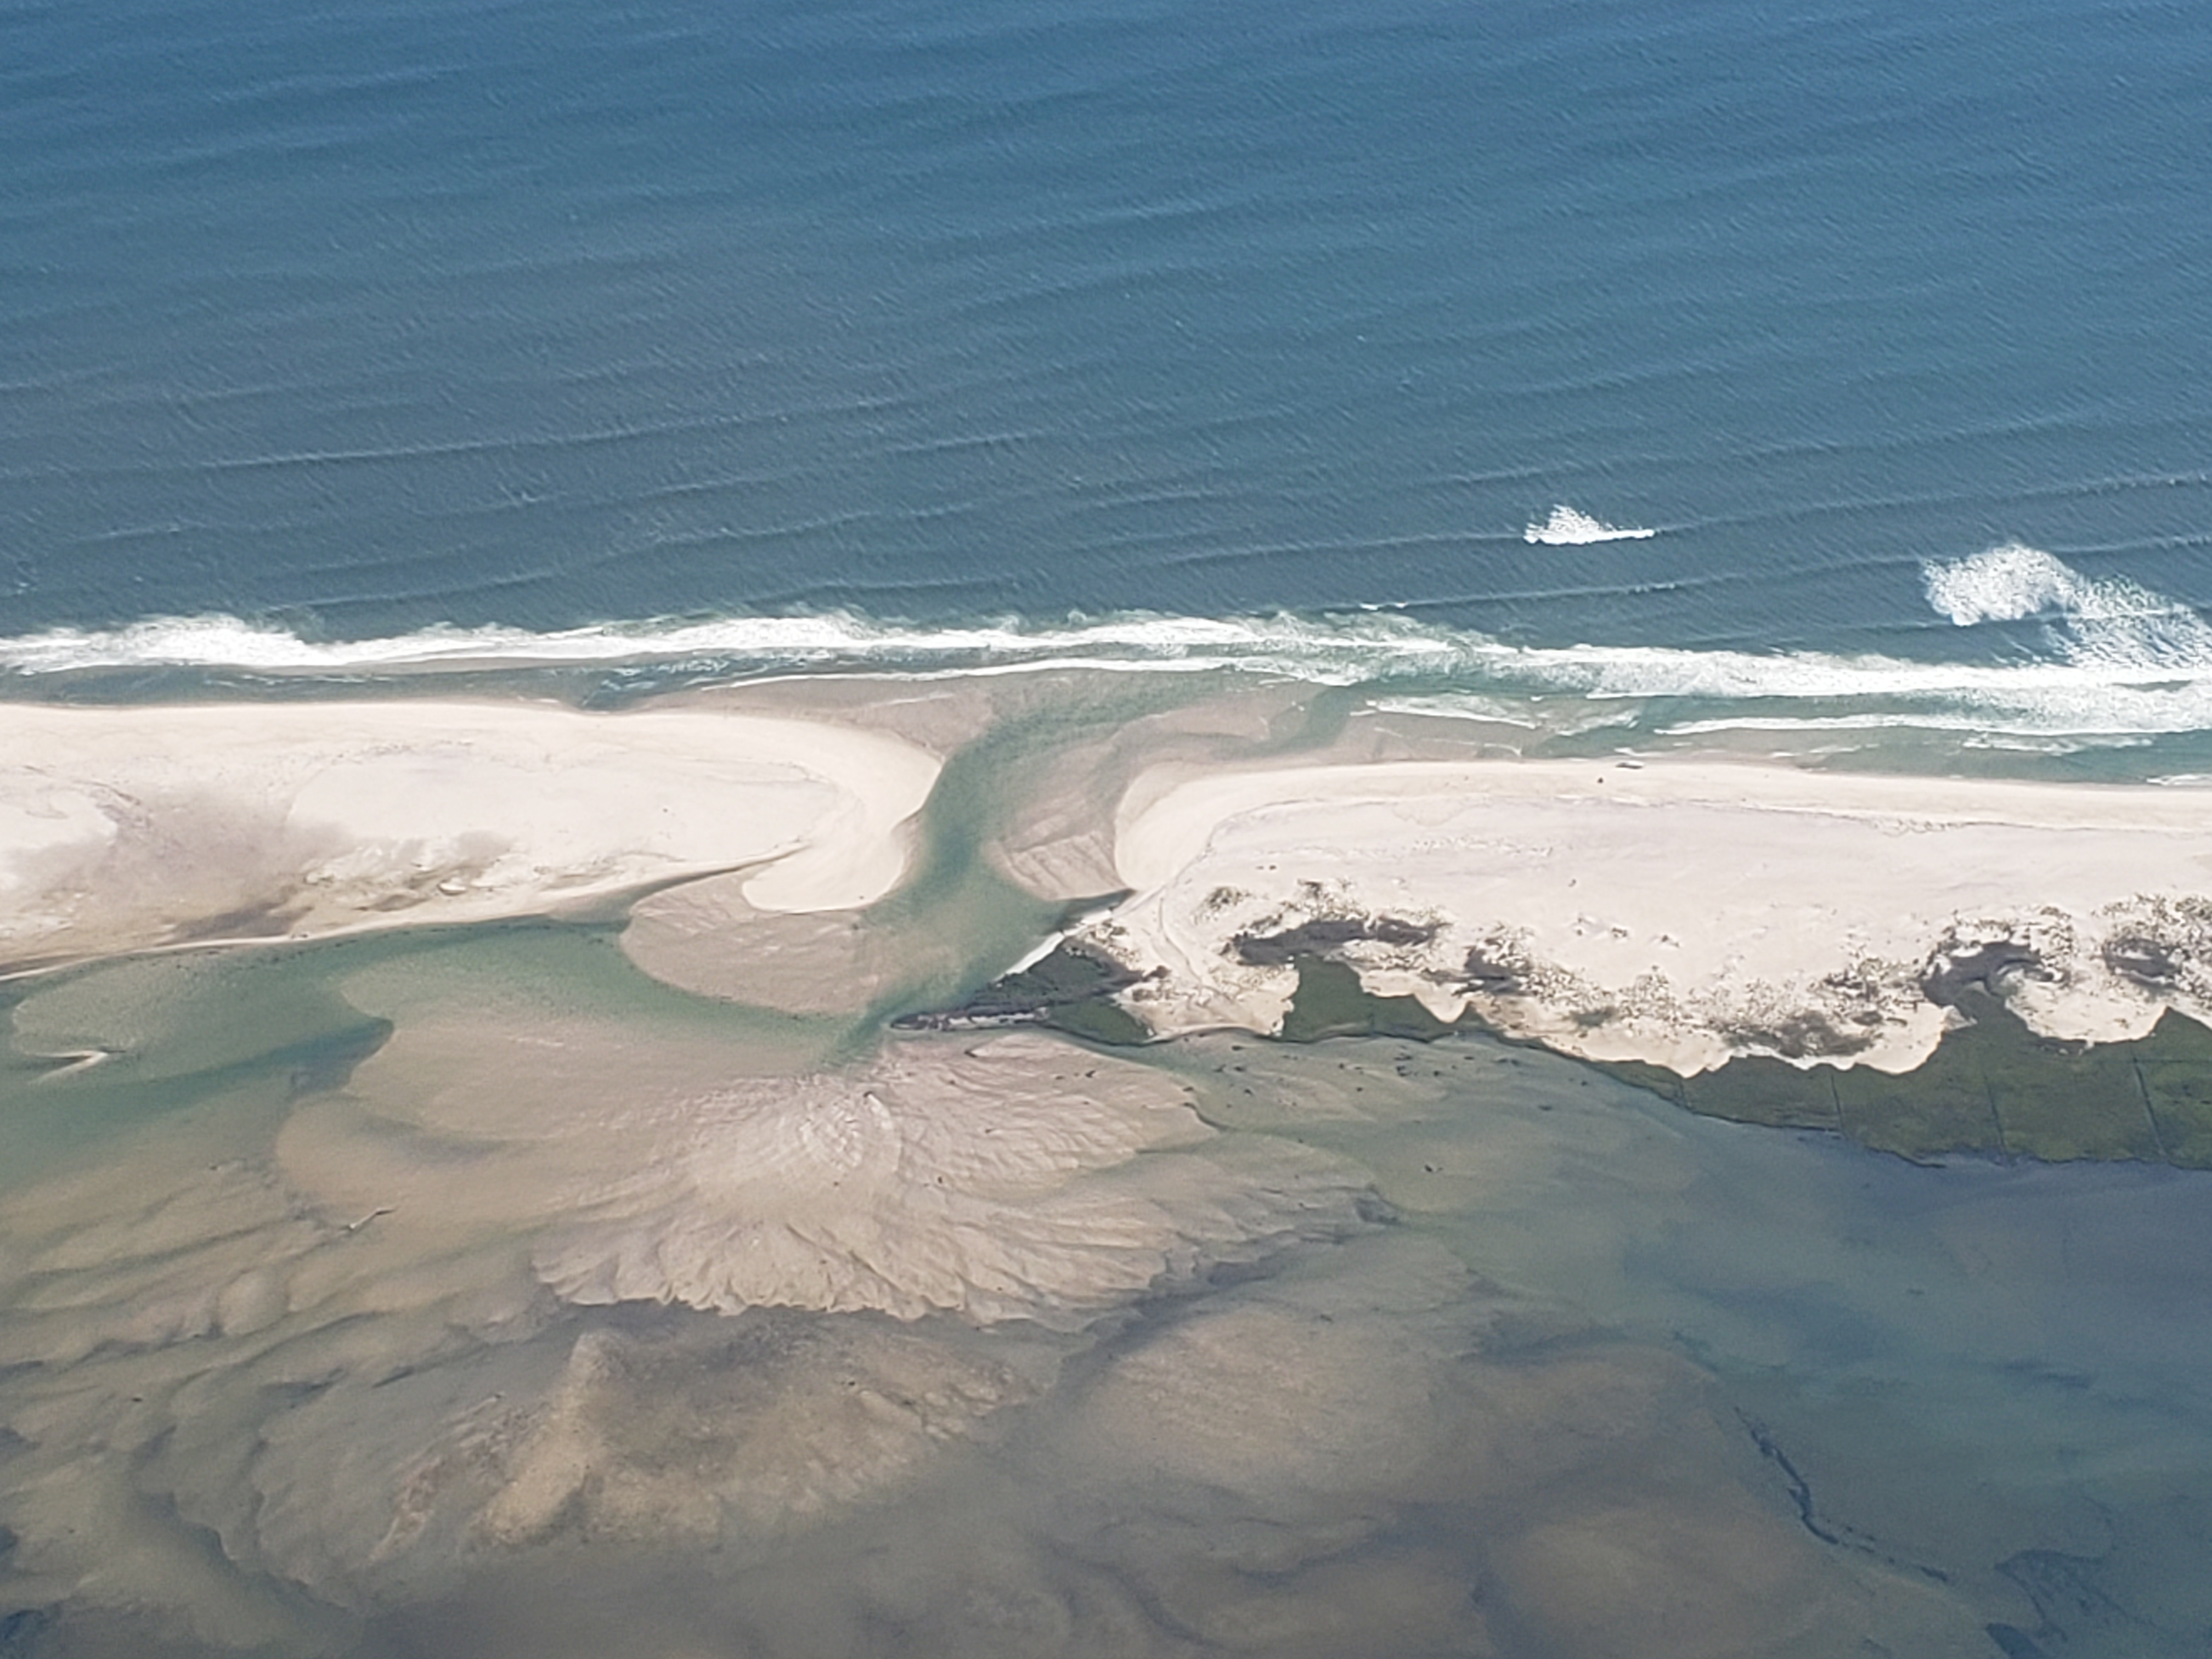 |
Oct 9, 2022 (JV)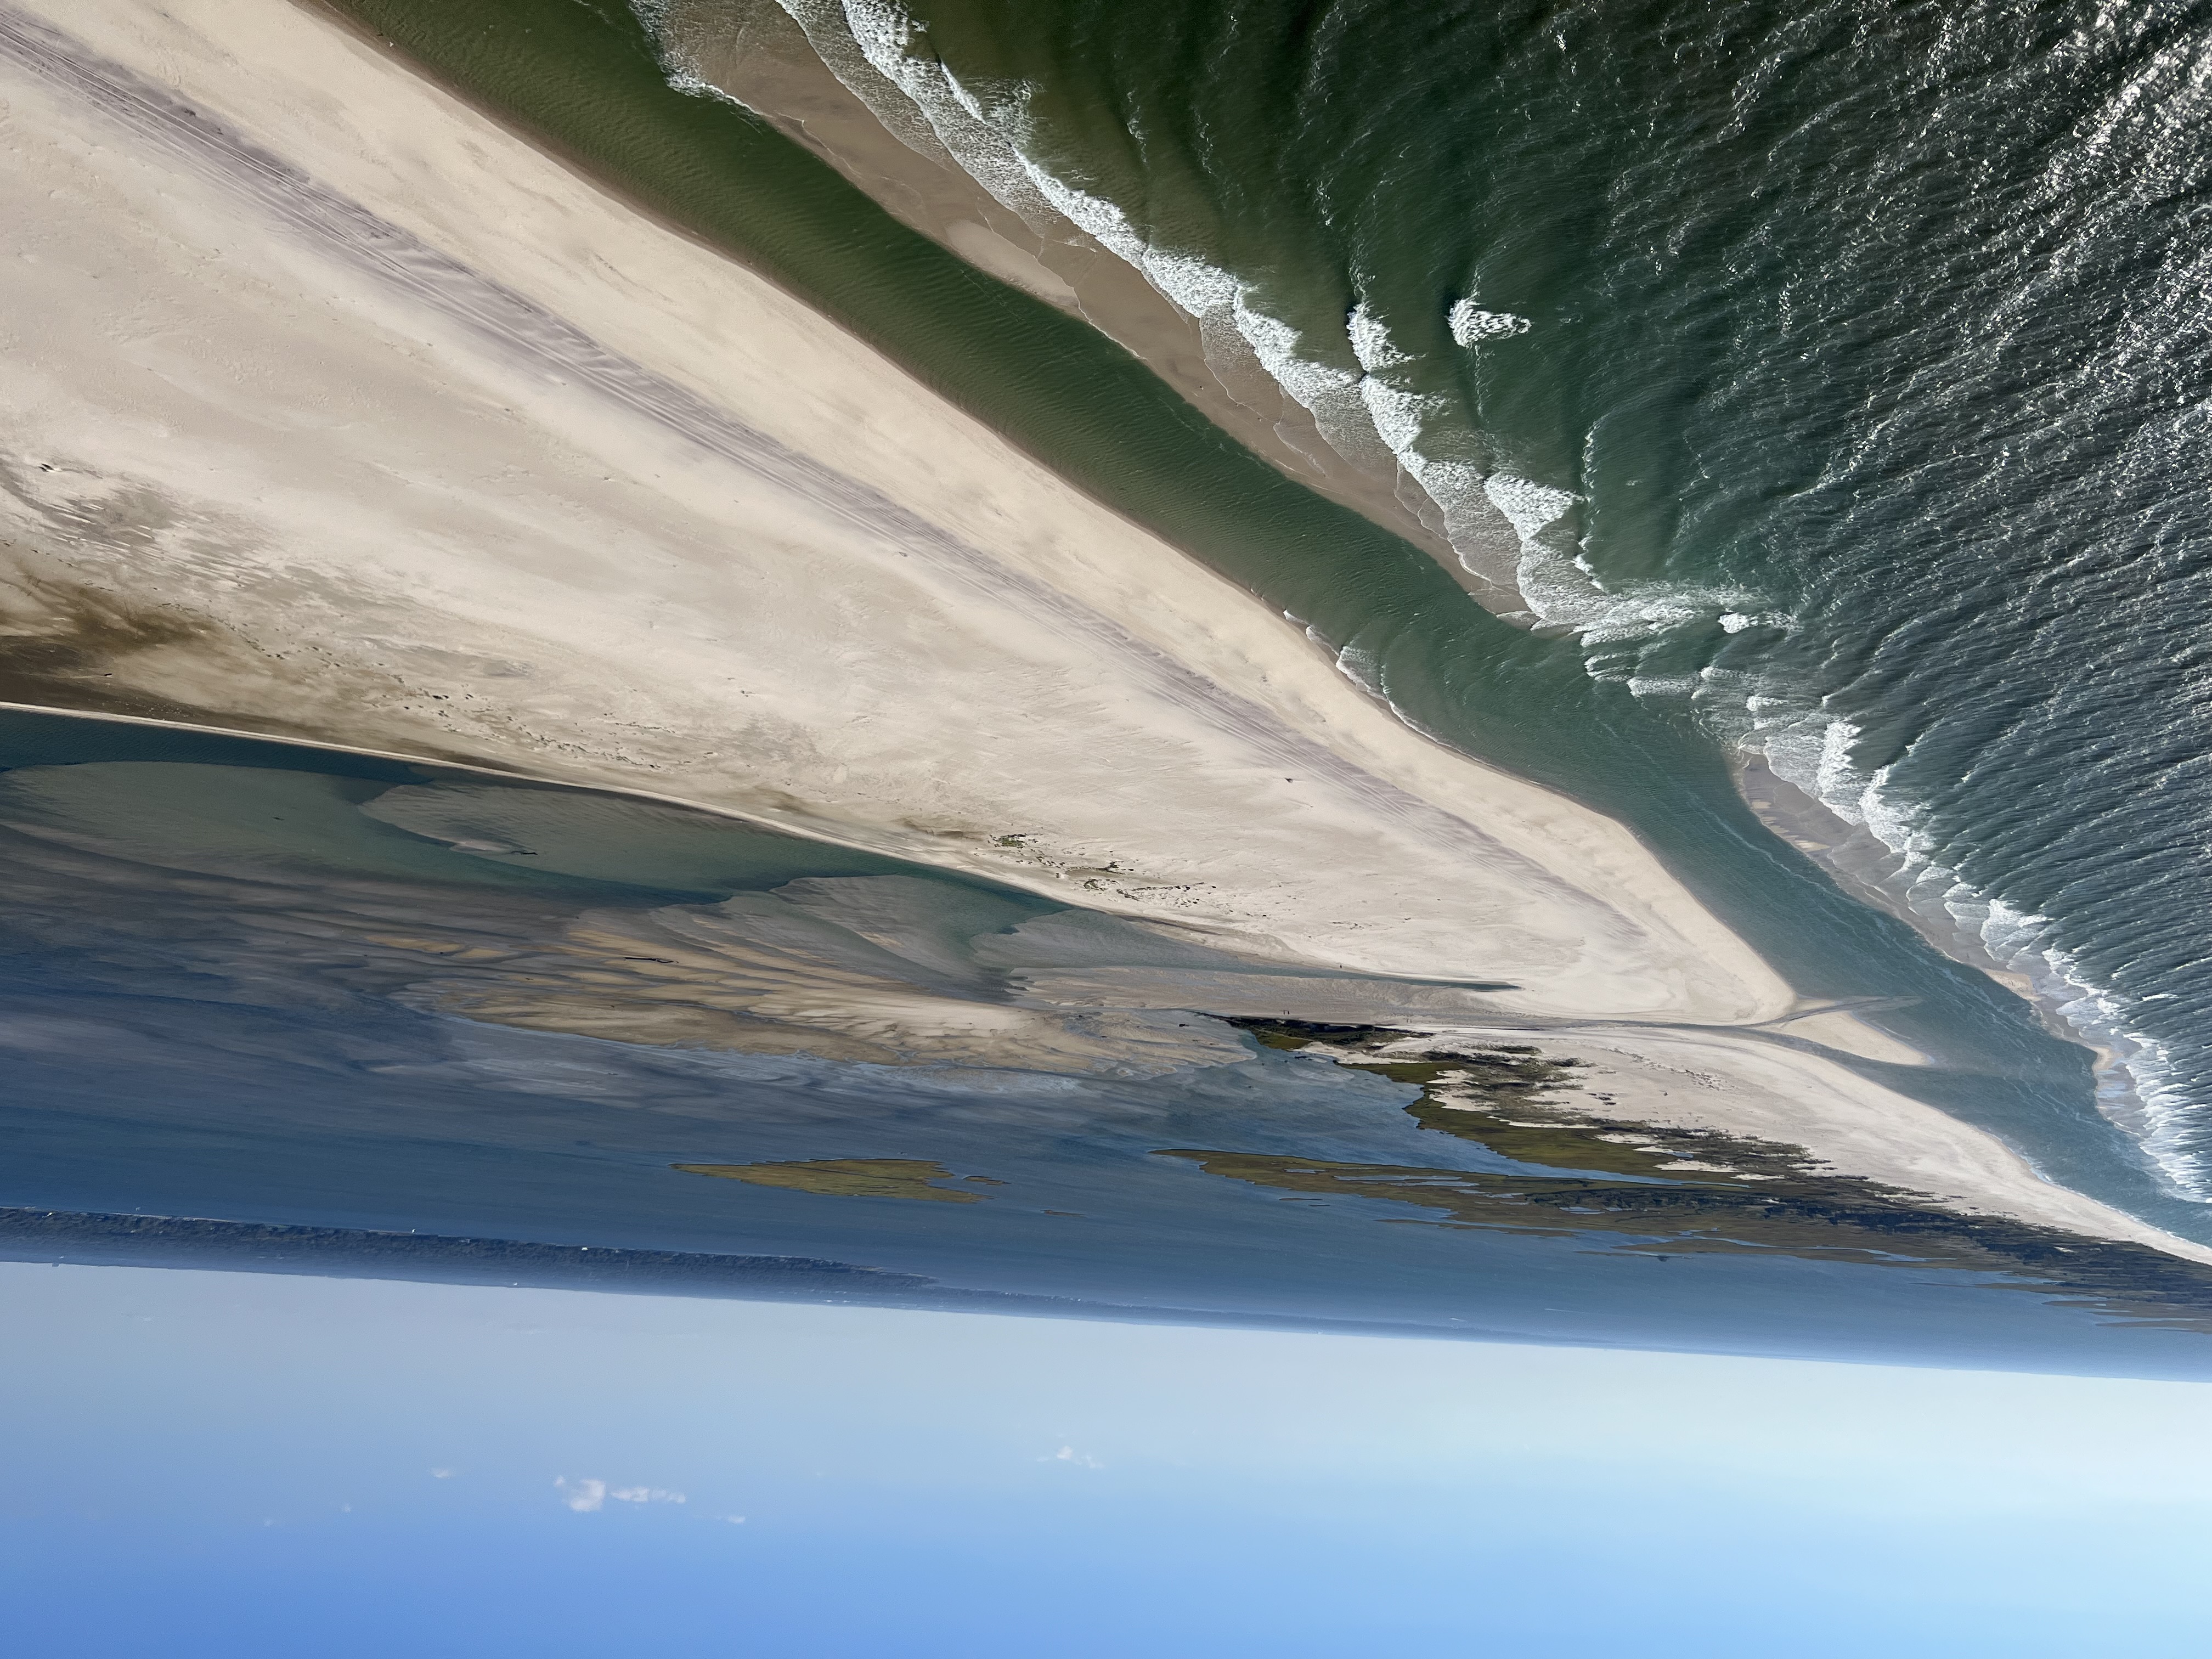  |
Oct 9,2022 (JV)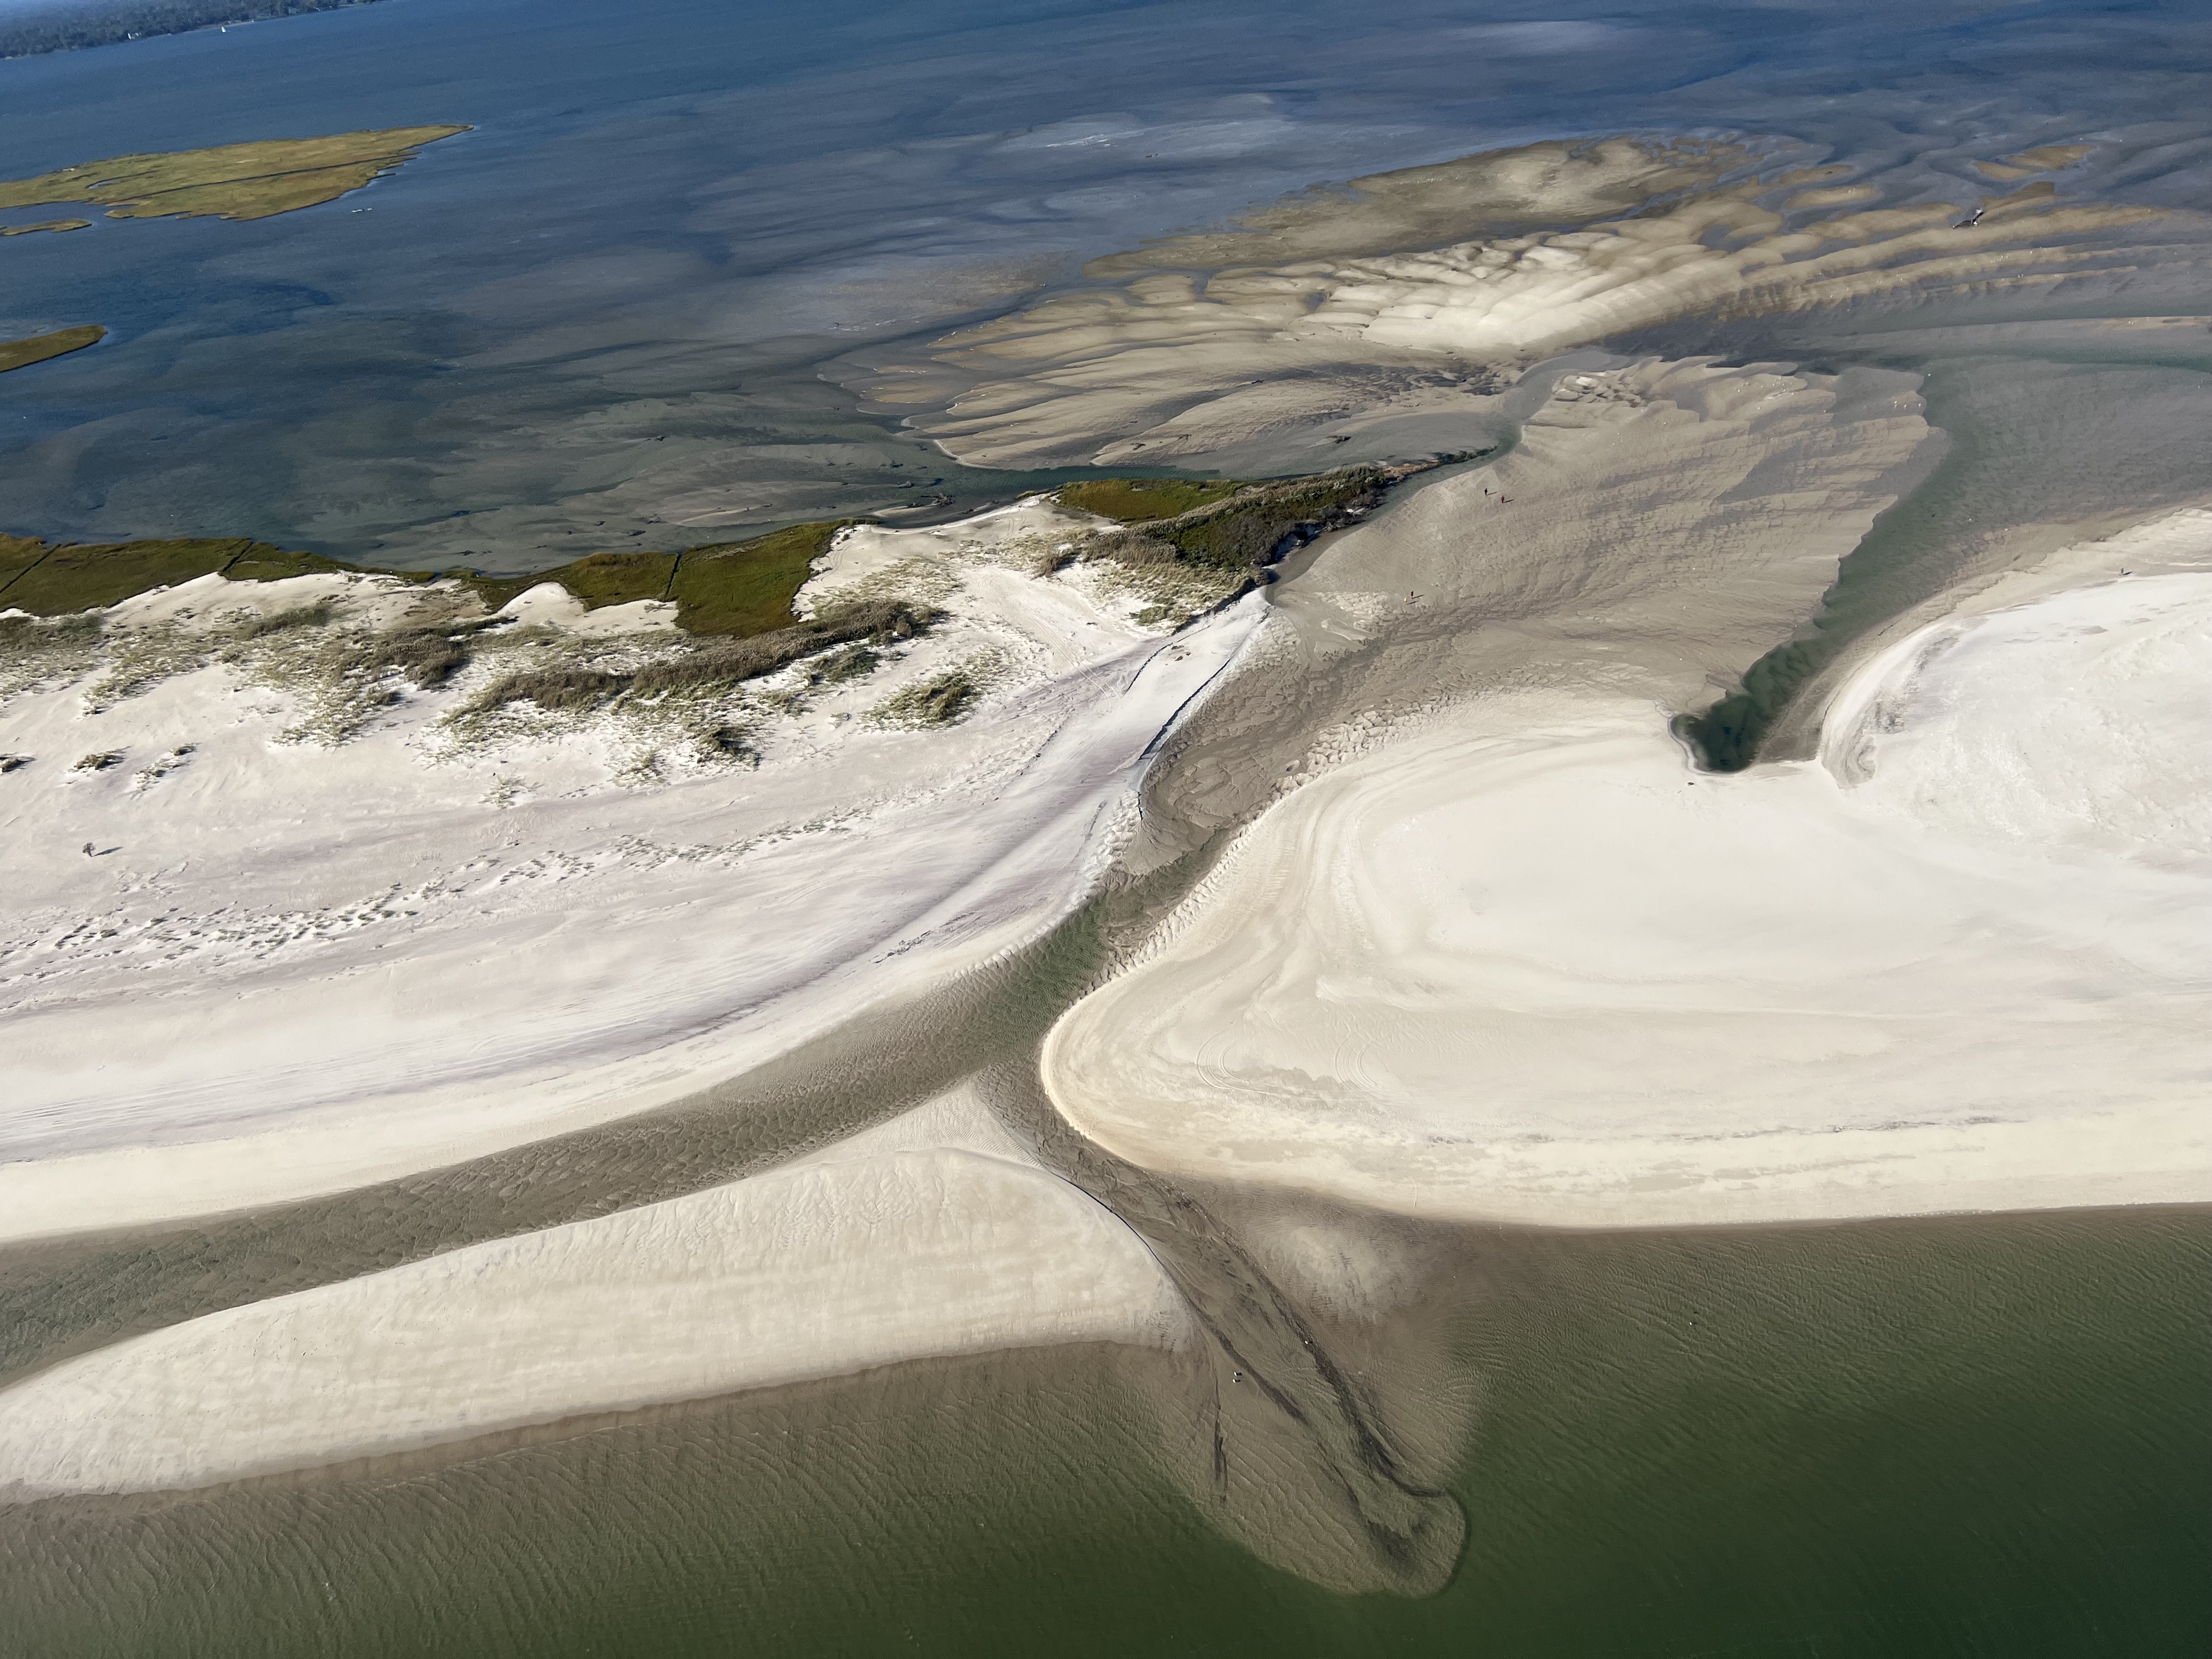 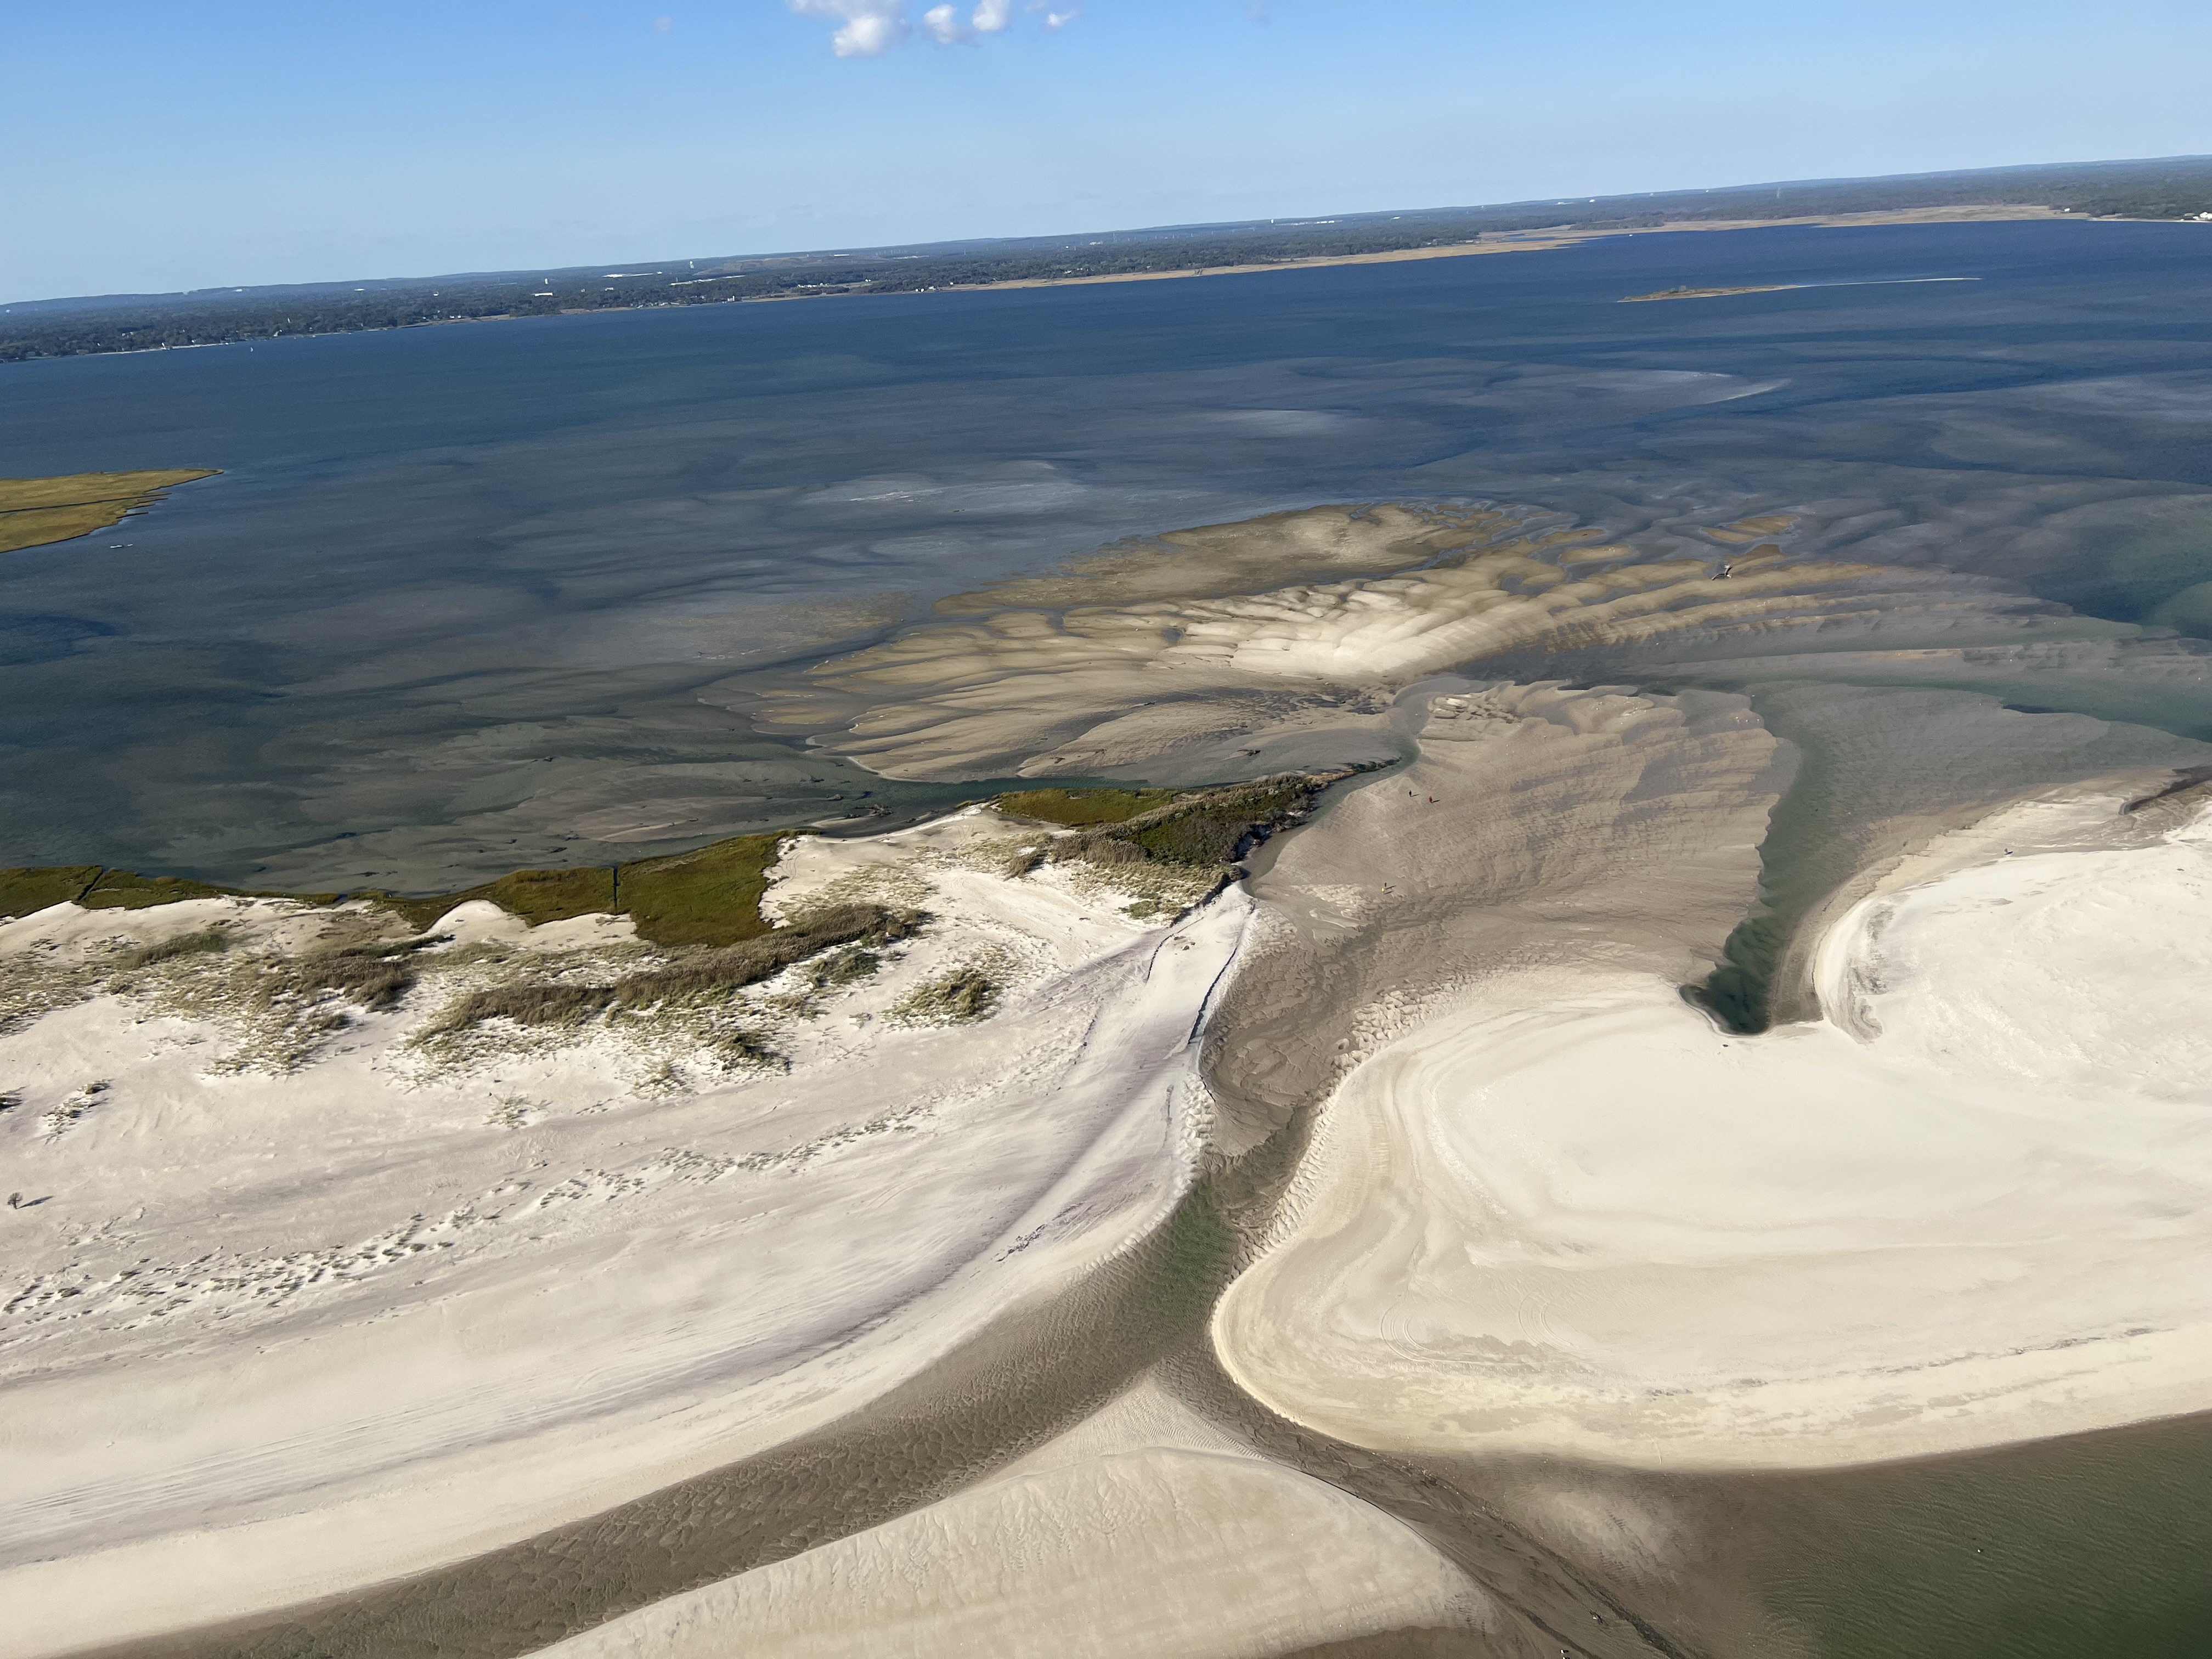 |
Oct 29, 2022 (RG)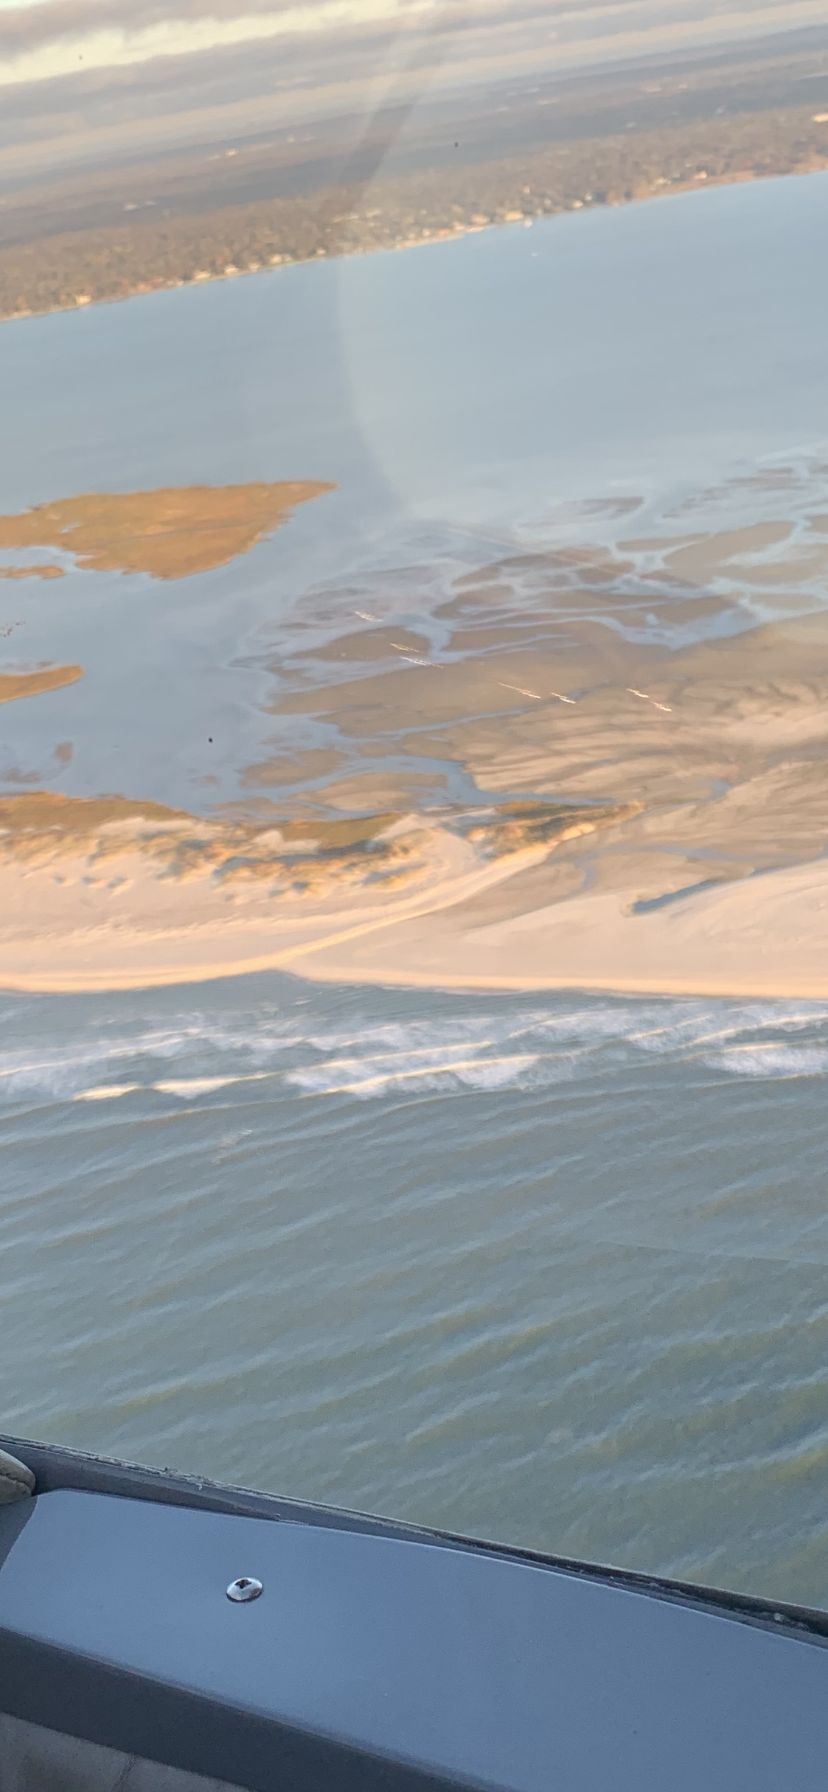 |
||||
Nov 21, 2022 (SB) |
Dec 26, 2022 (SB)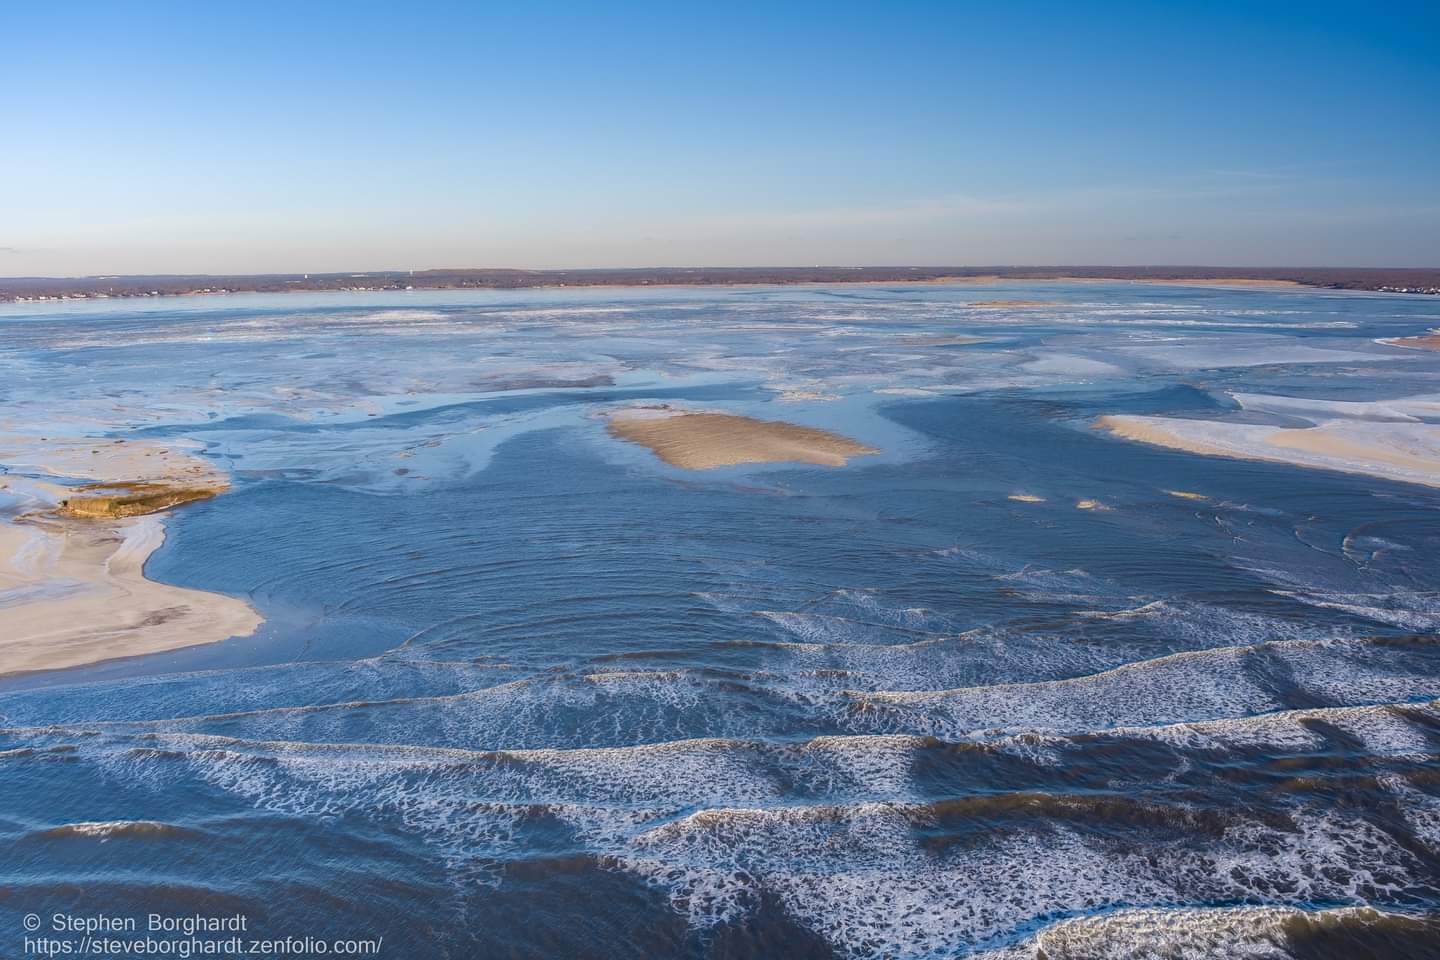 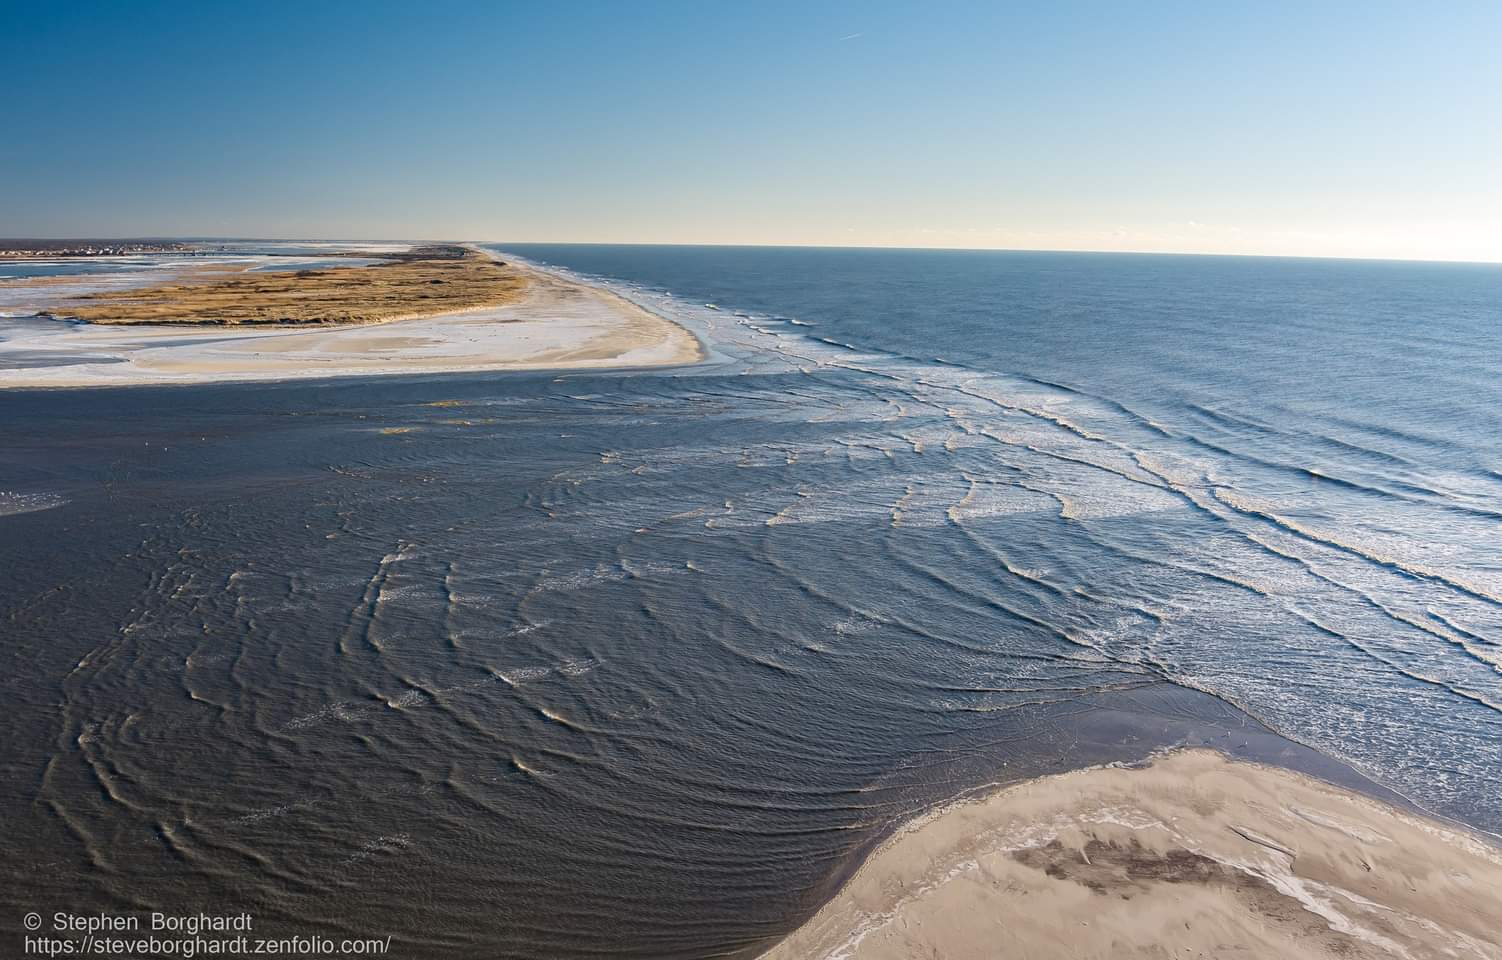 |
Jan 2, 2023 (SB)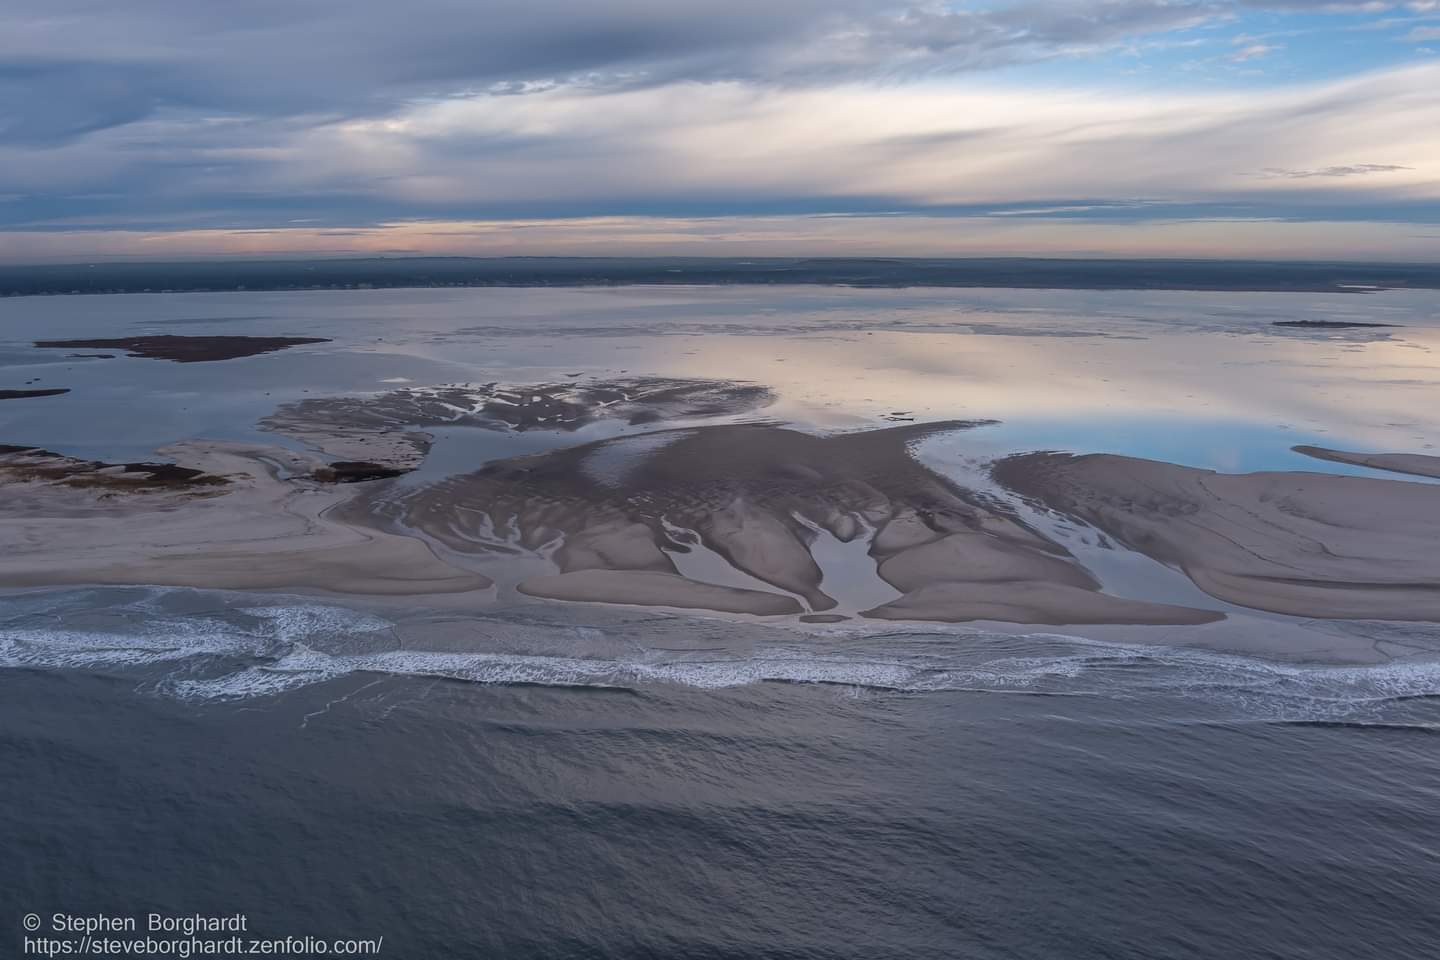 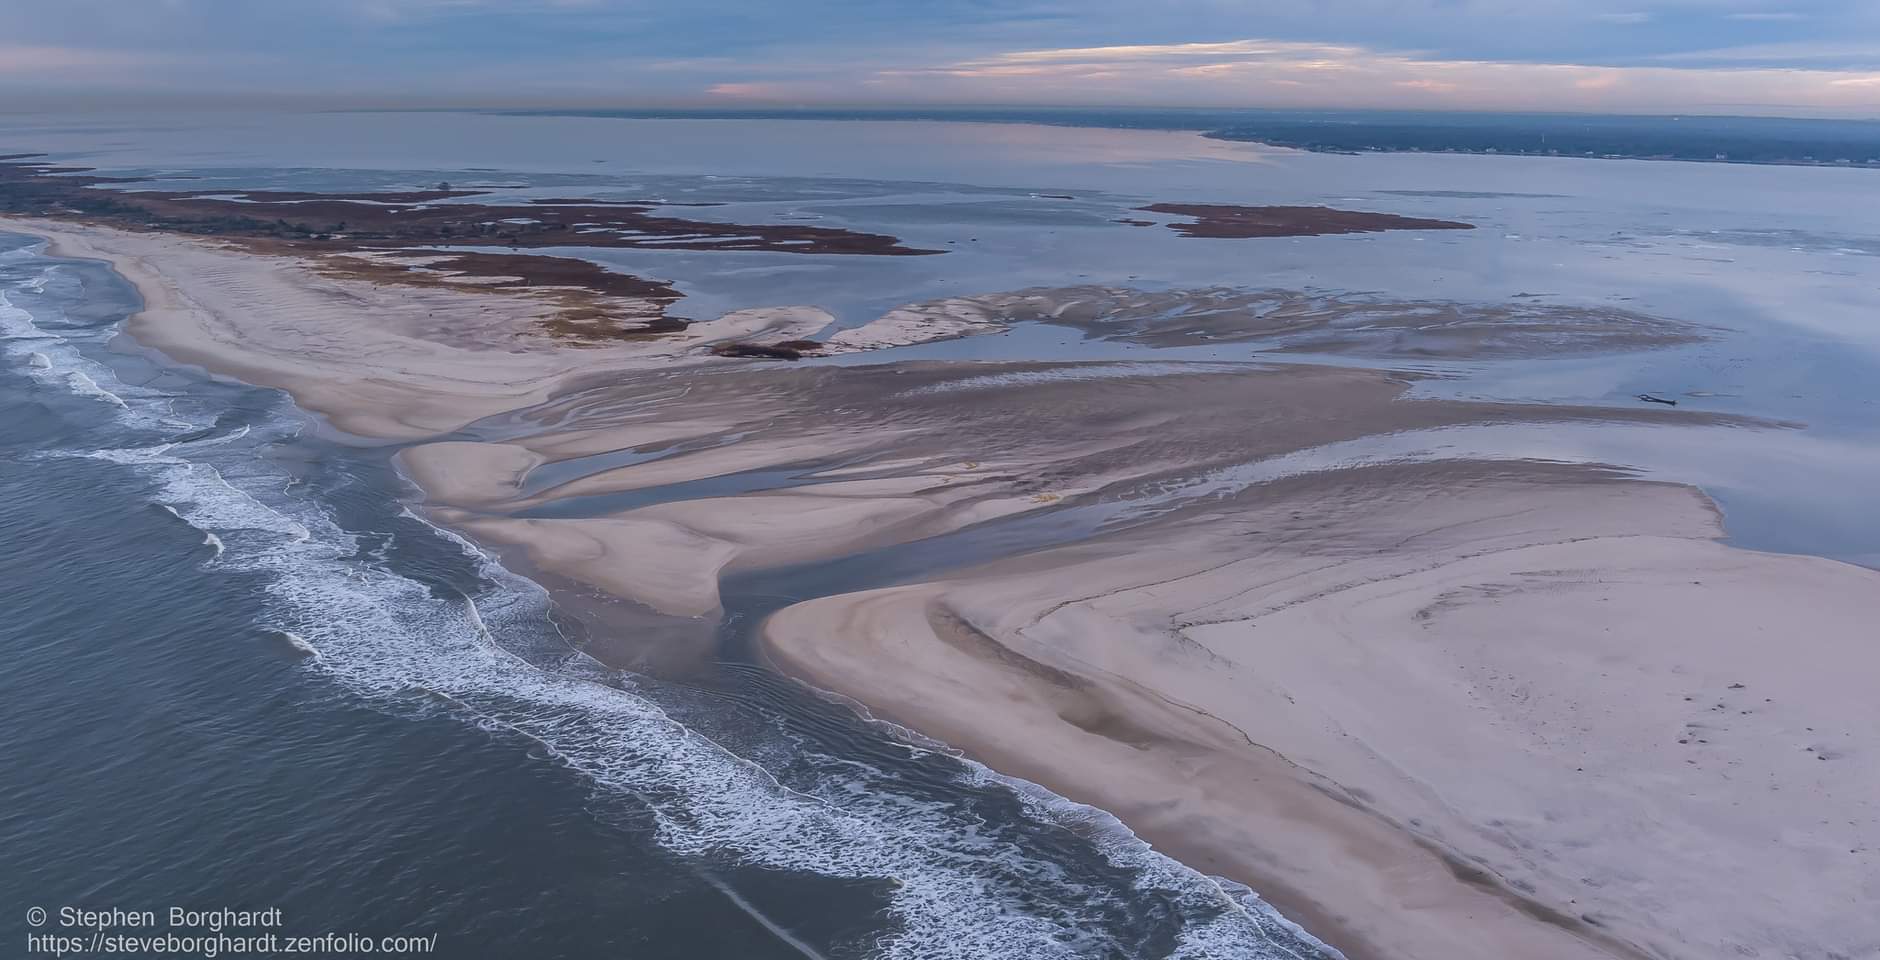 |
Mar 5, 2023 (SB)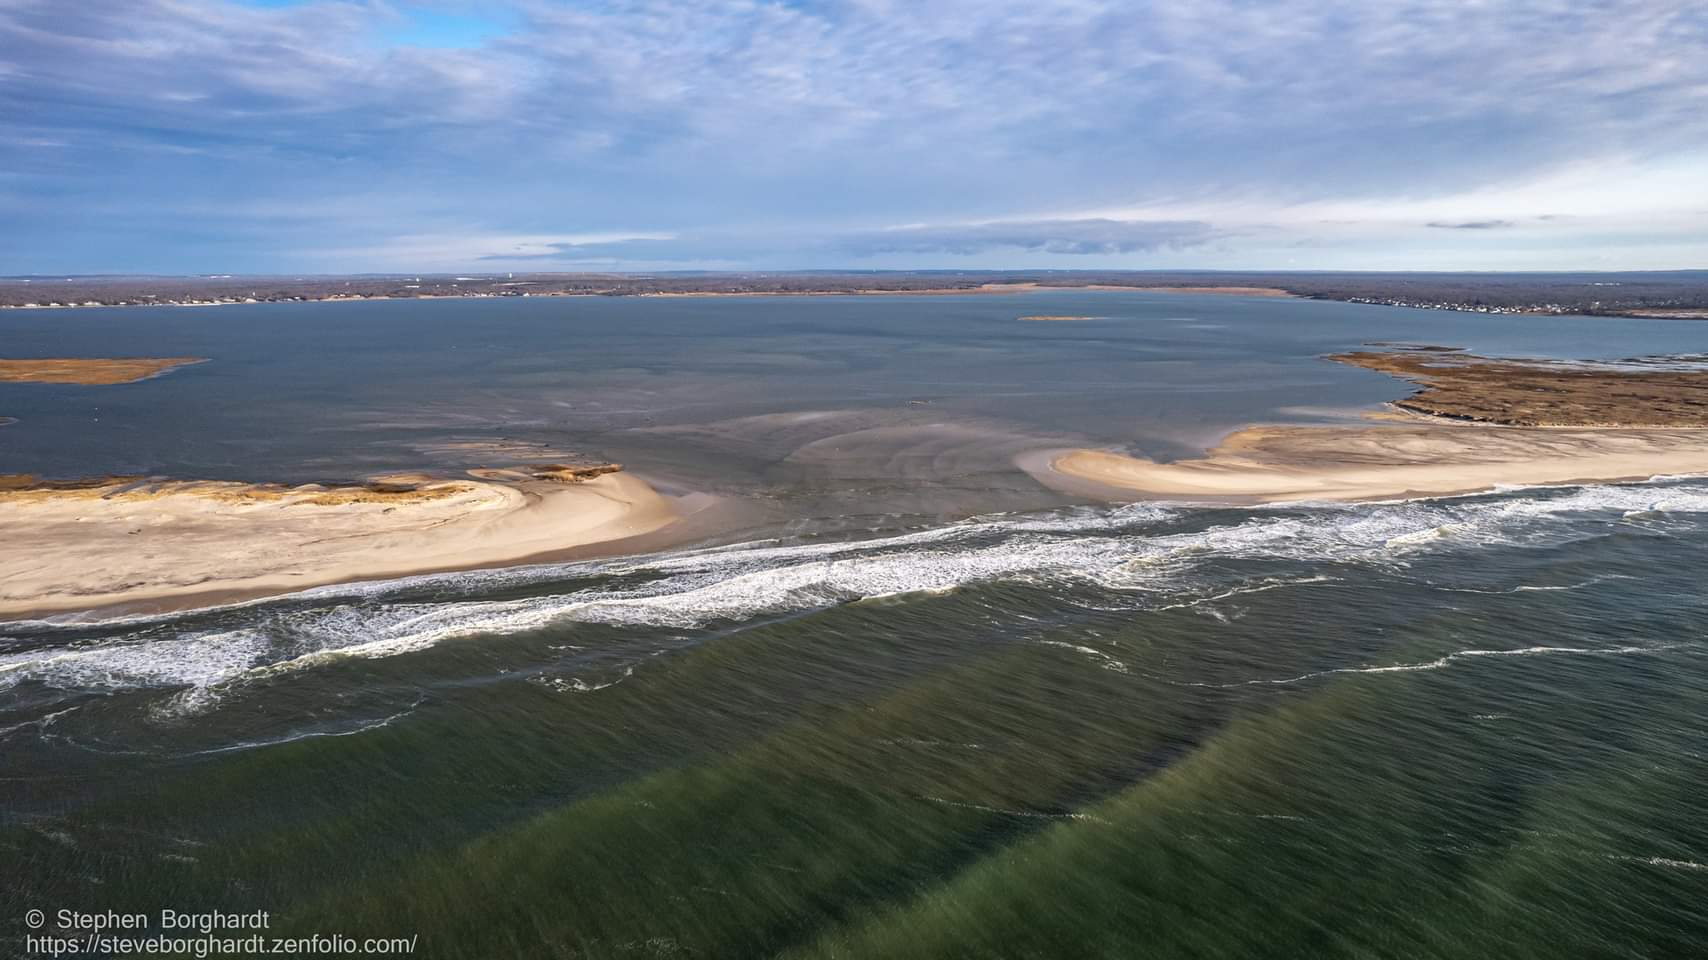 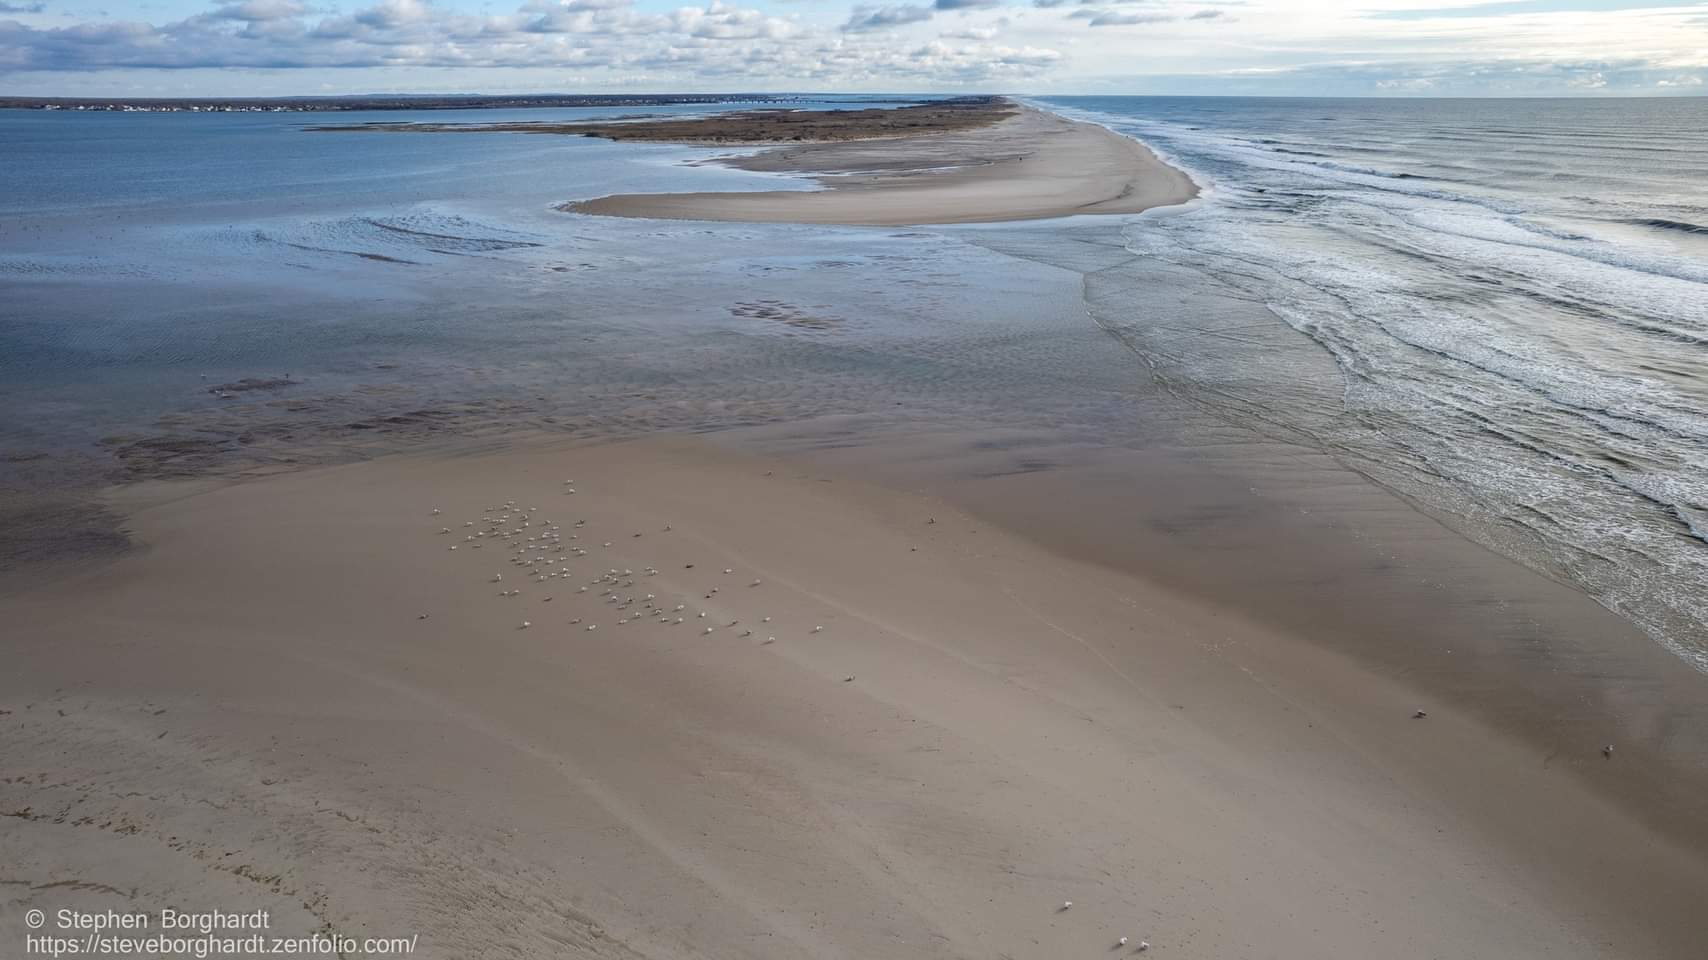 |
||||
May 13, 2023 (CF)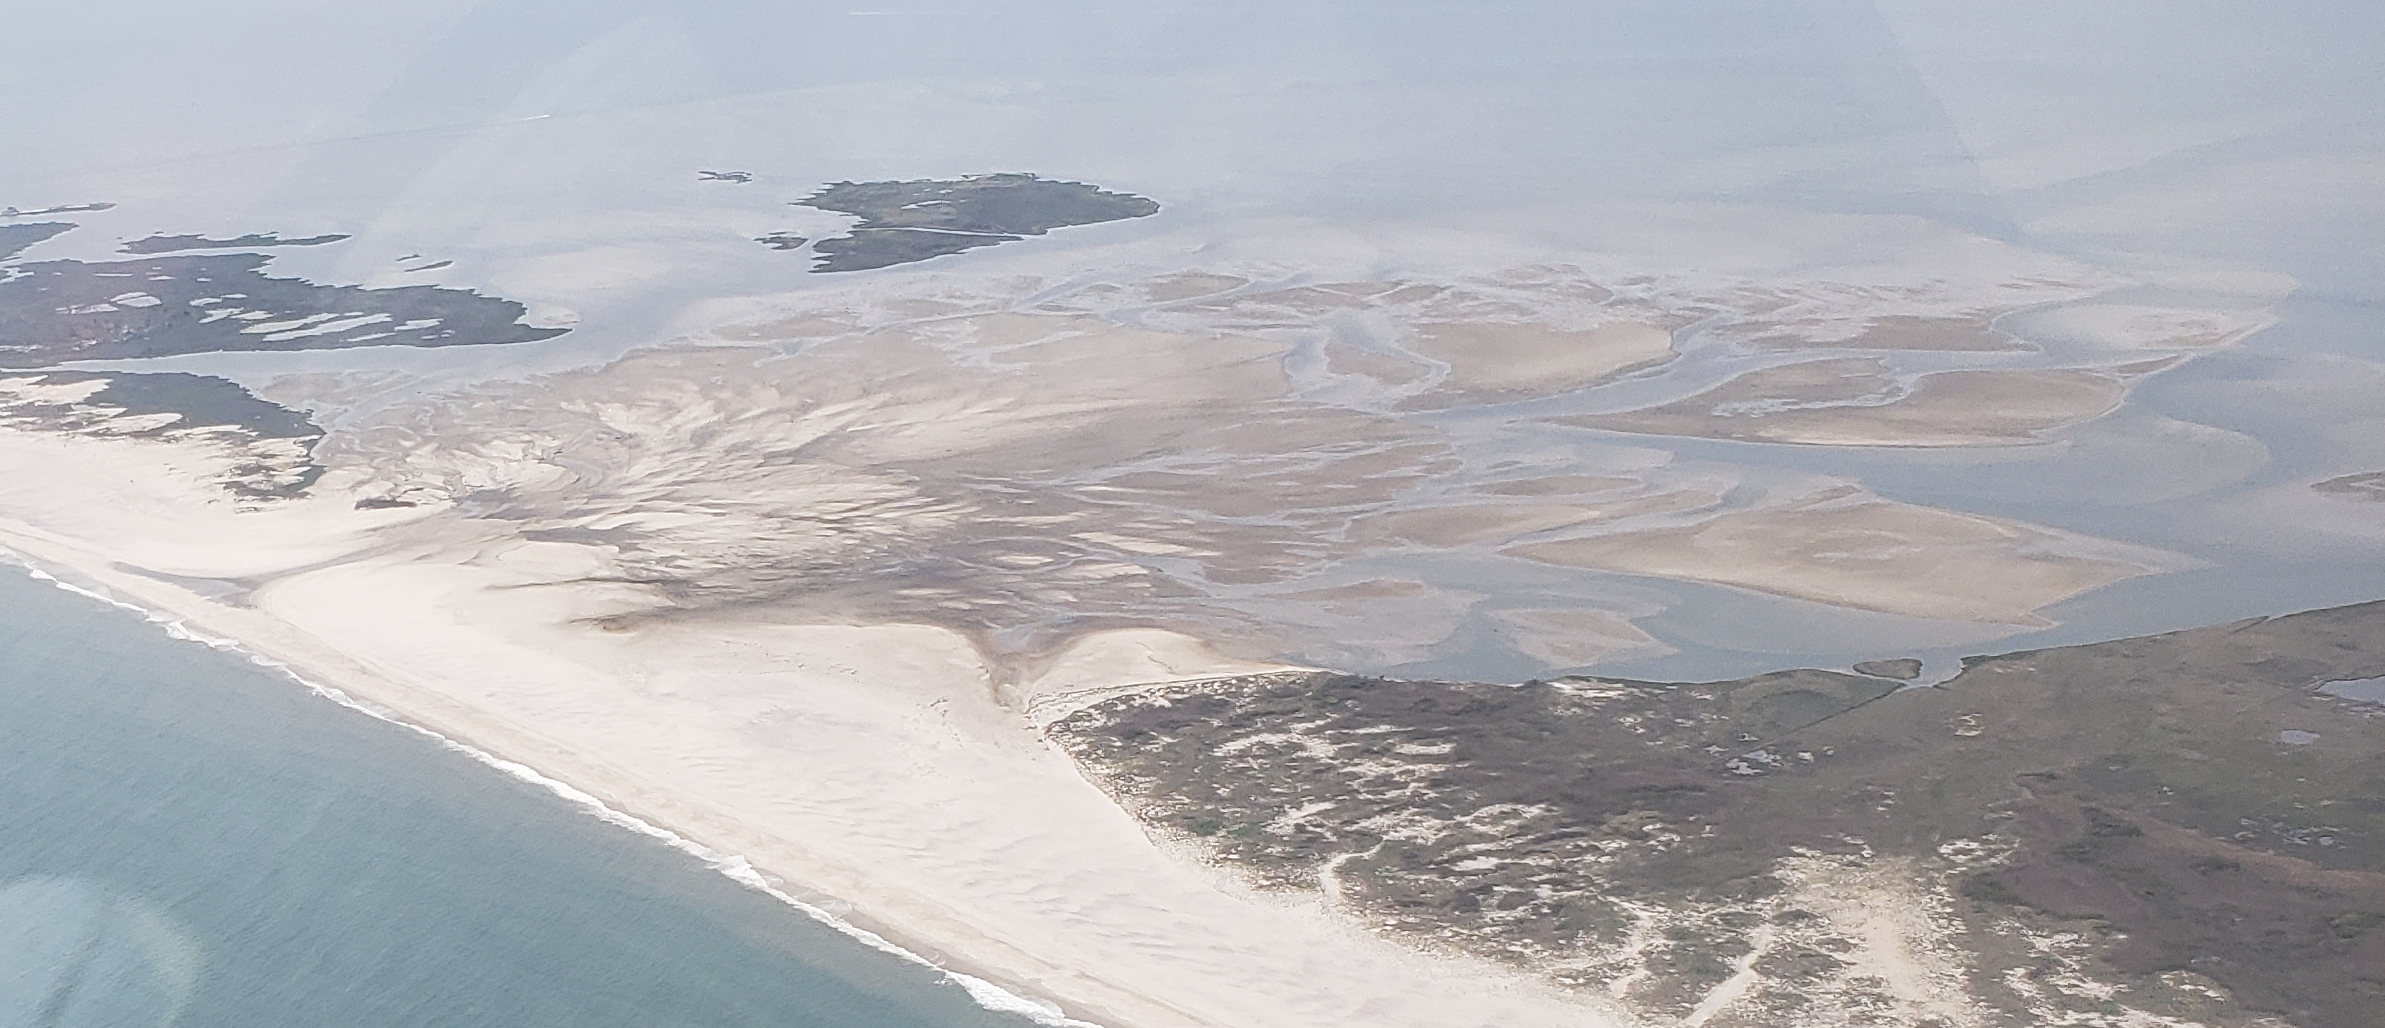 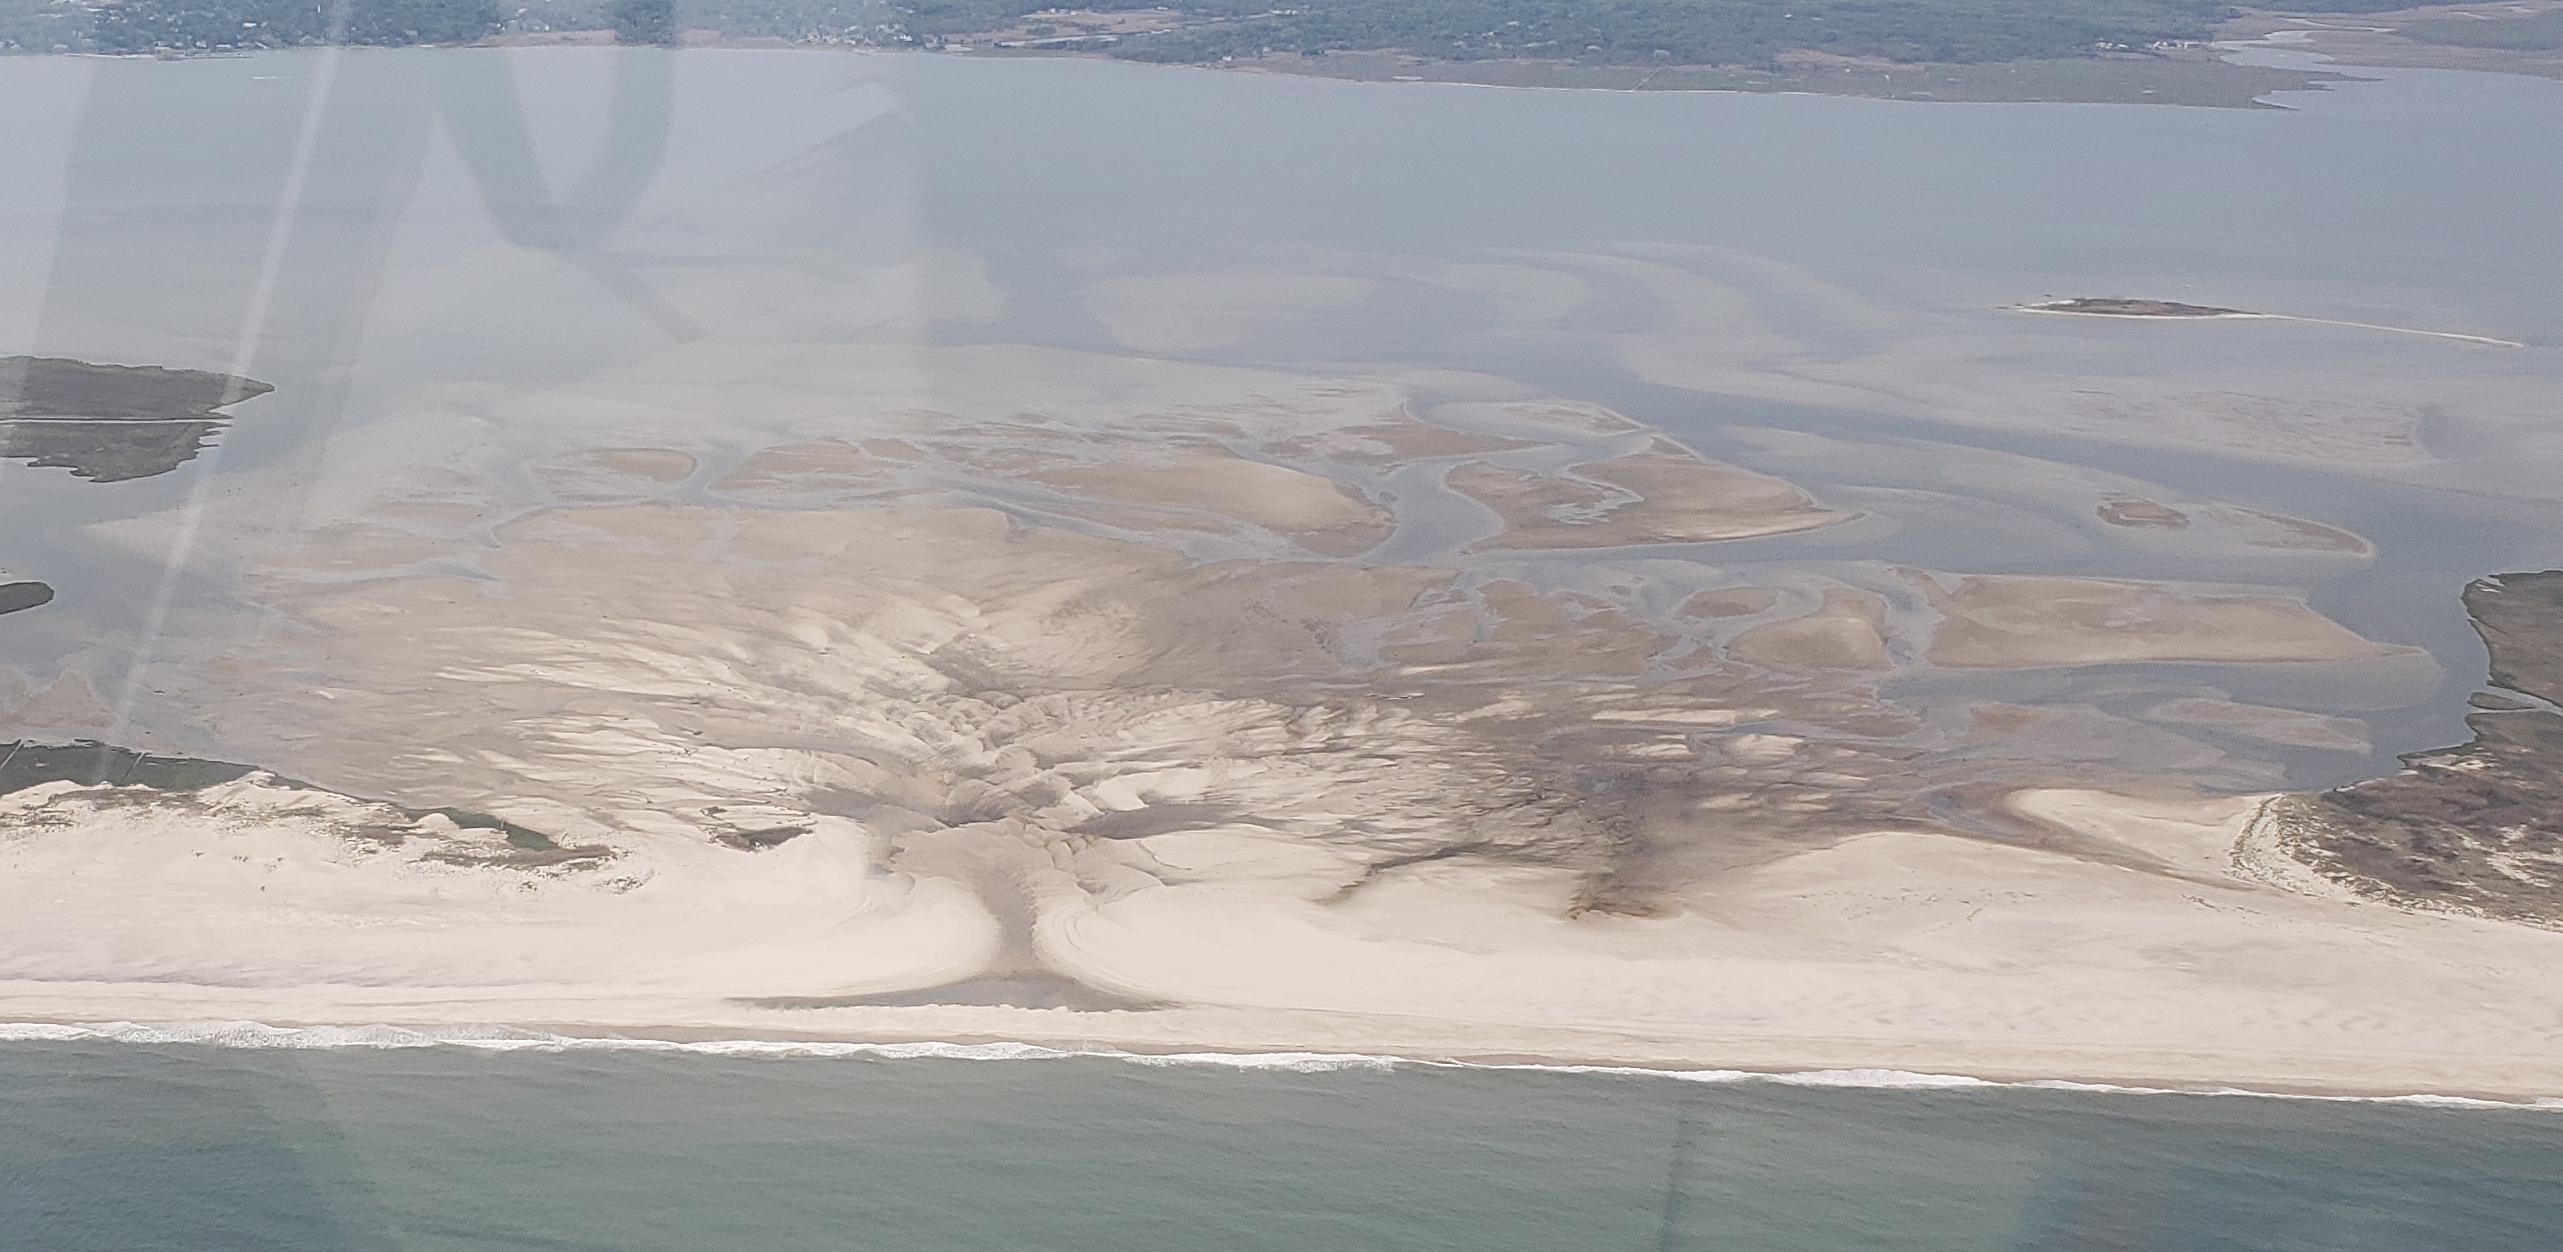 |
June 18, 2023 (CF)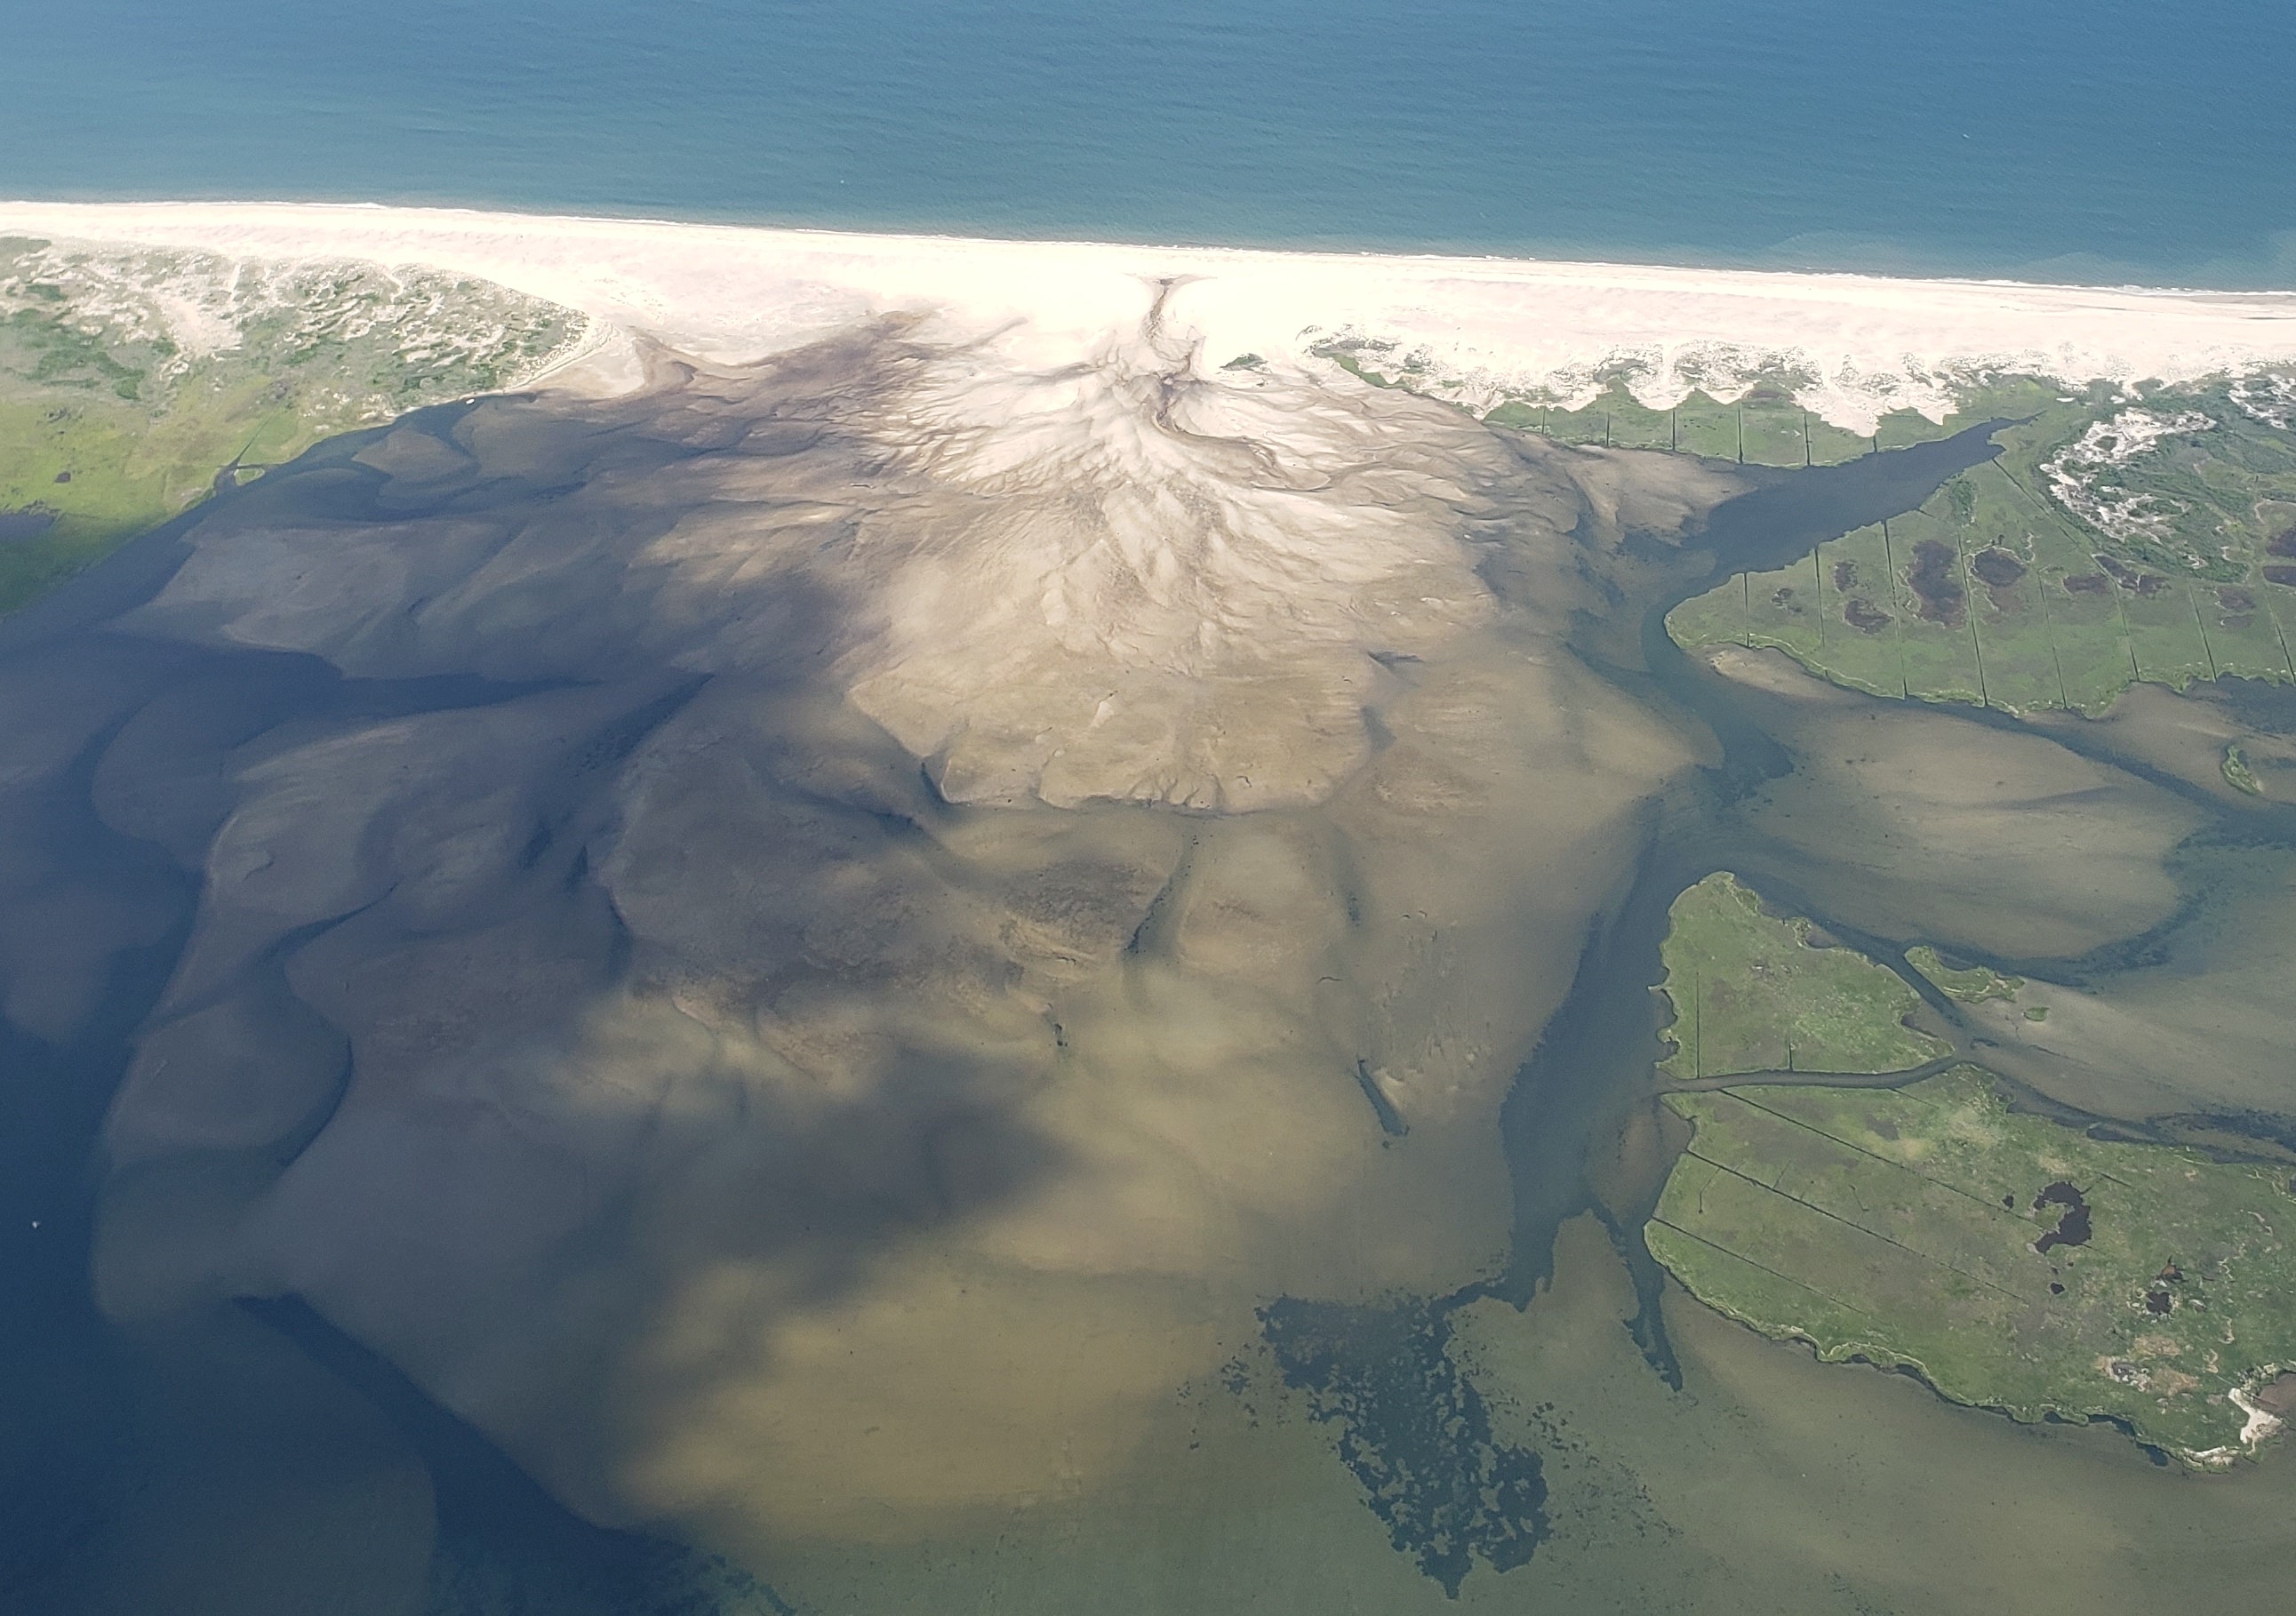 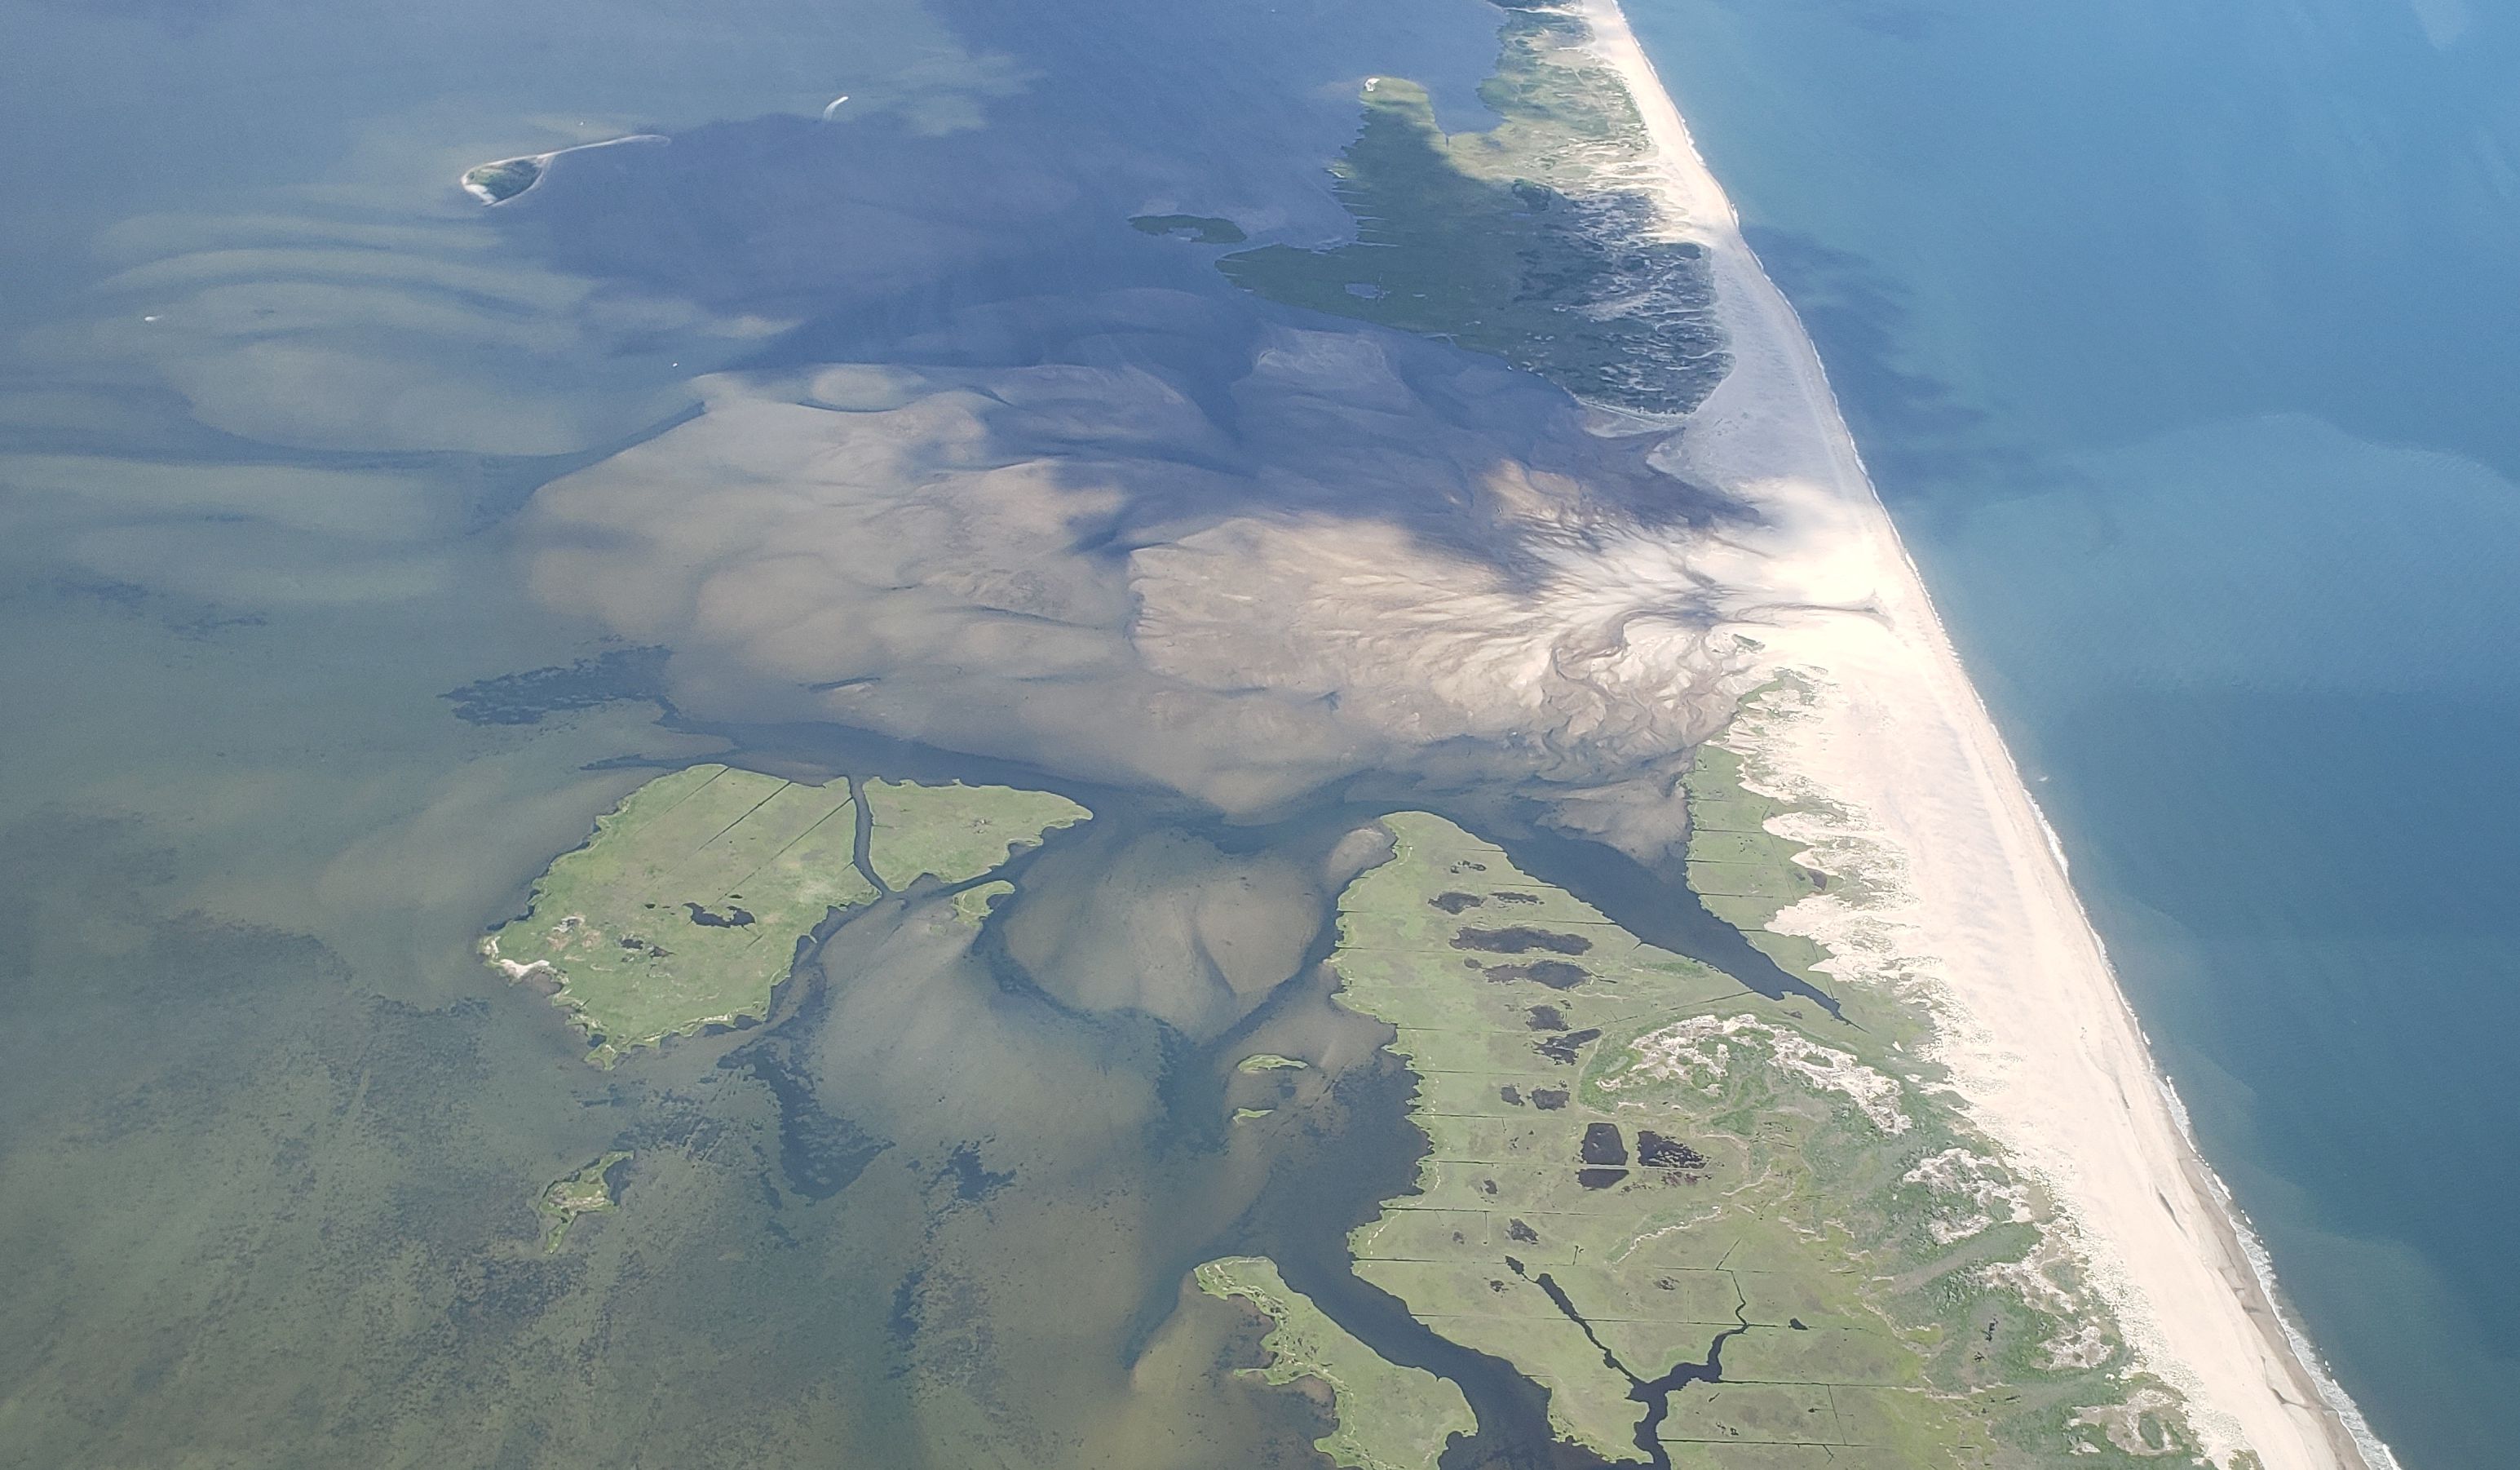 |
Dec 19, 2023 (JV)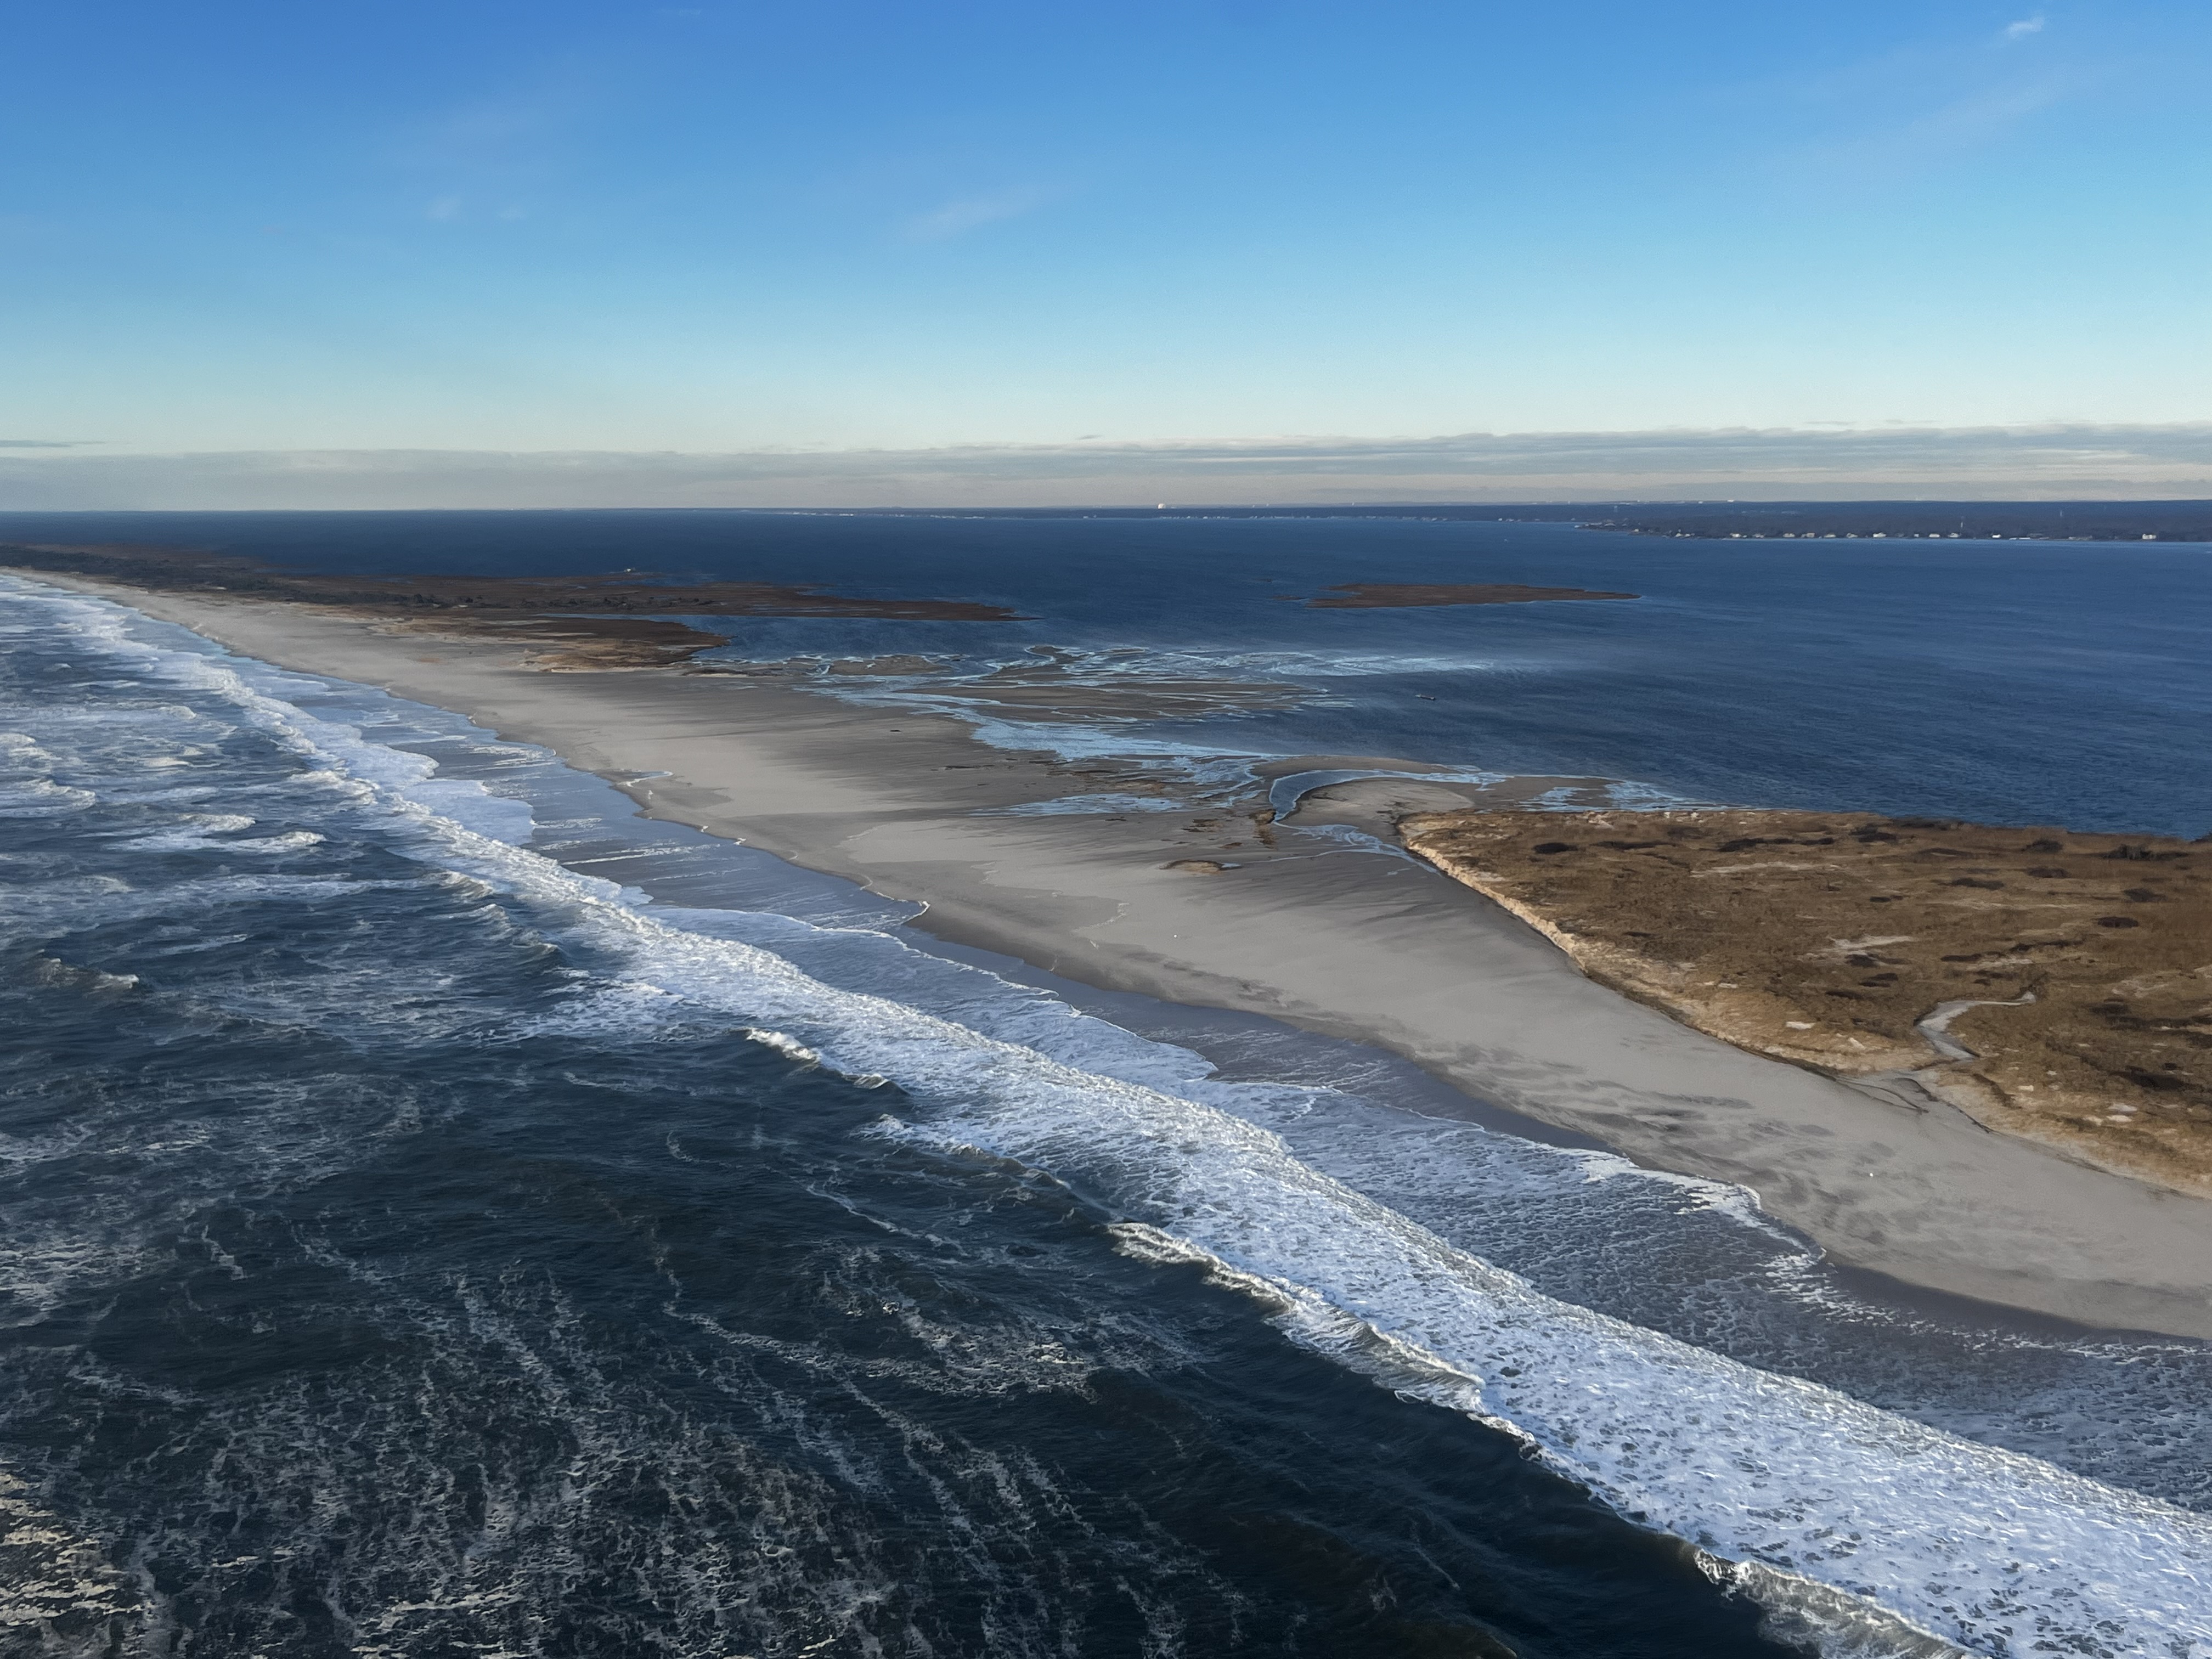 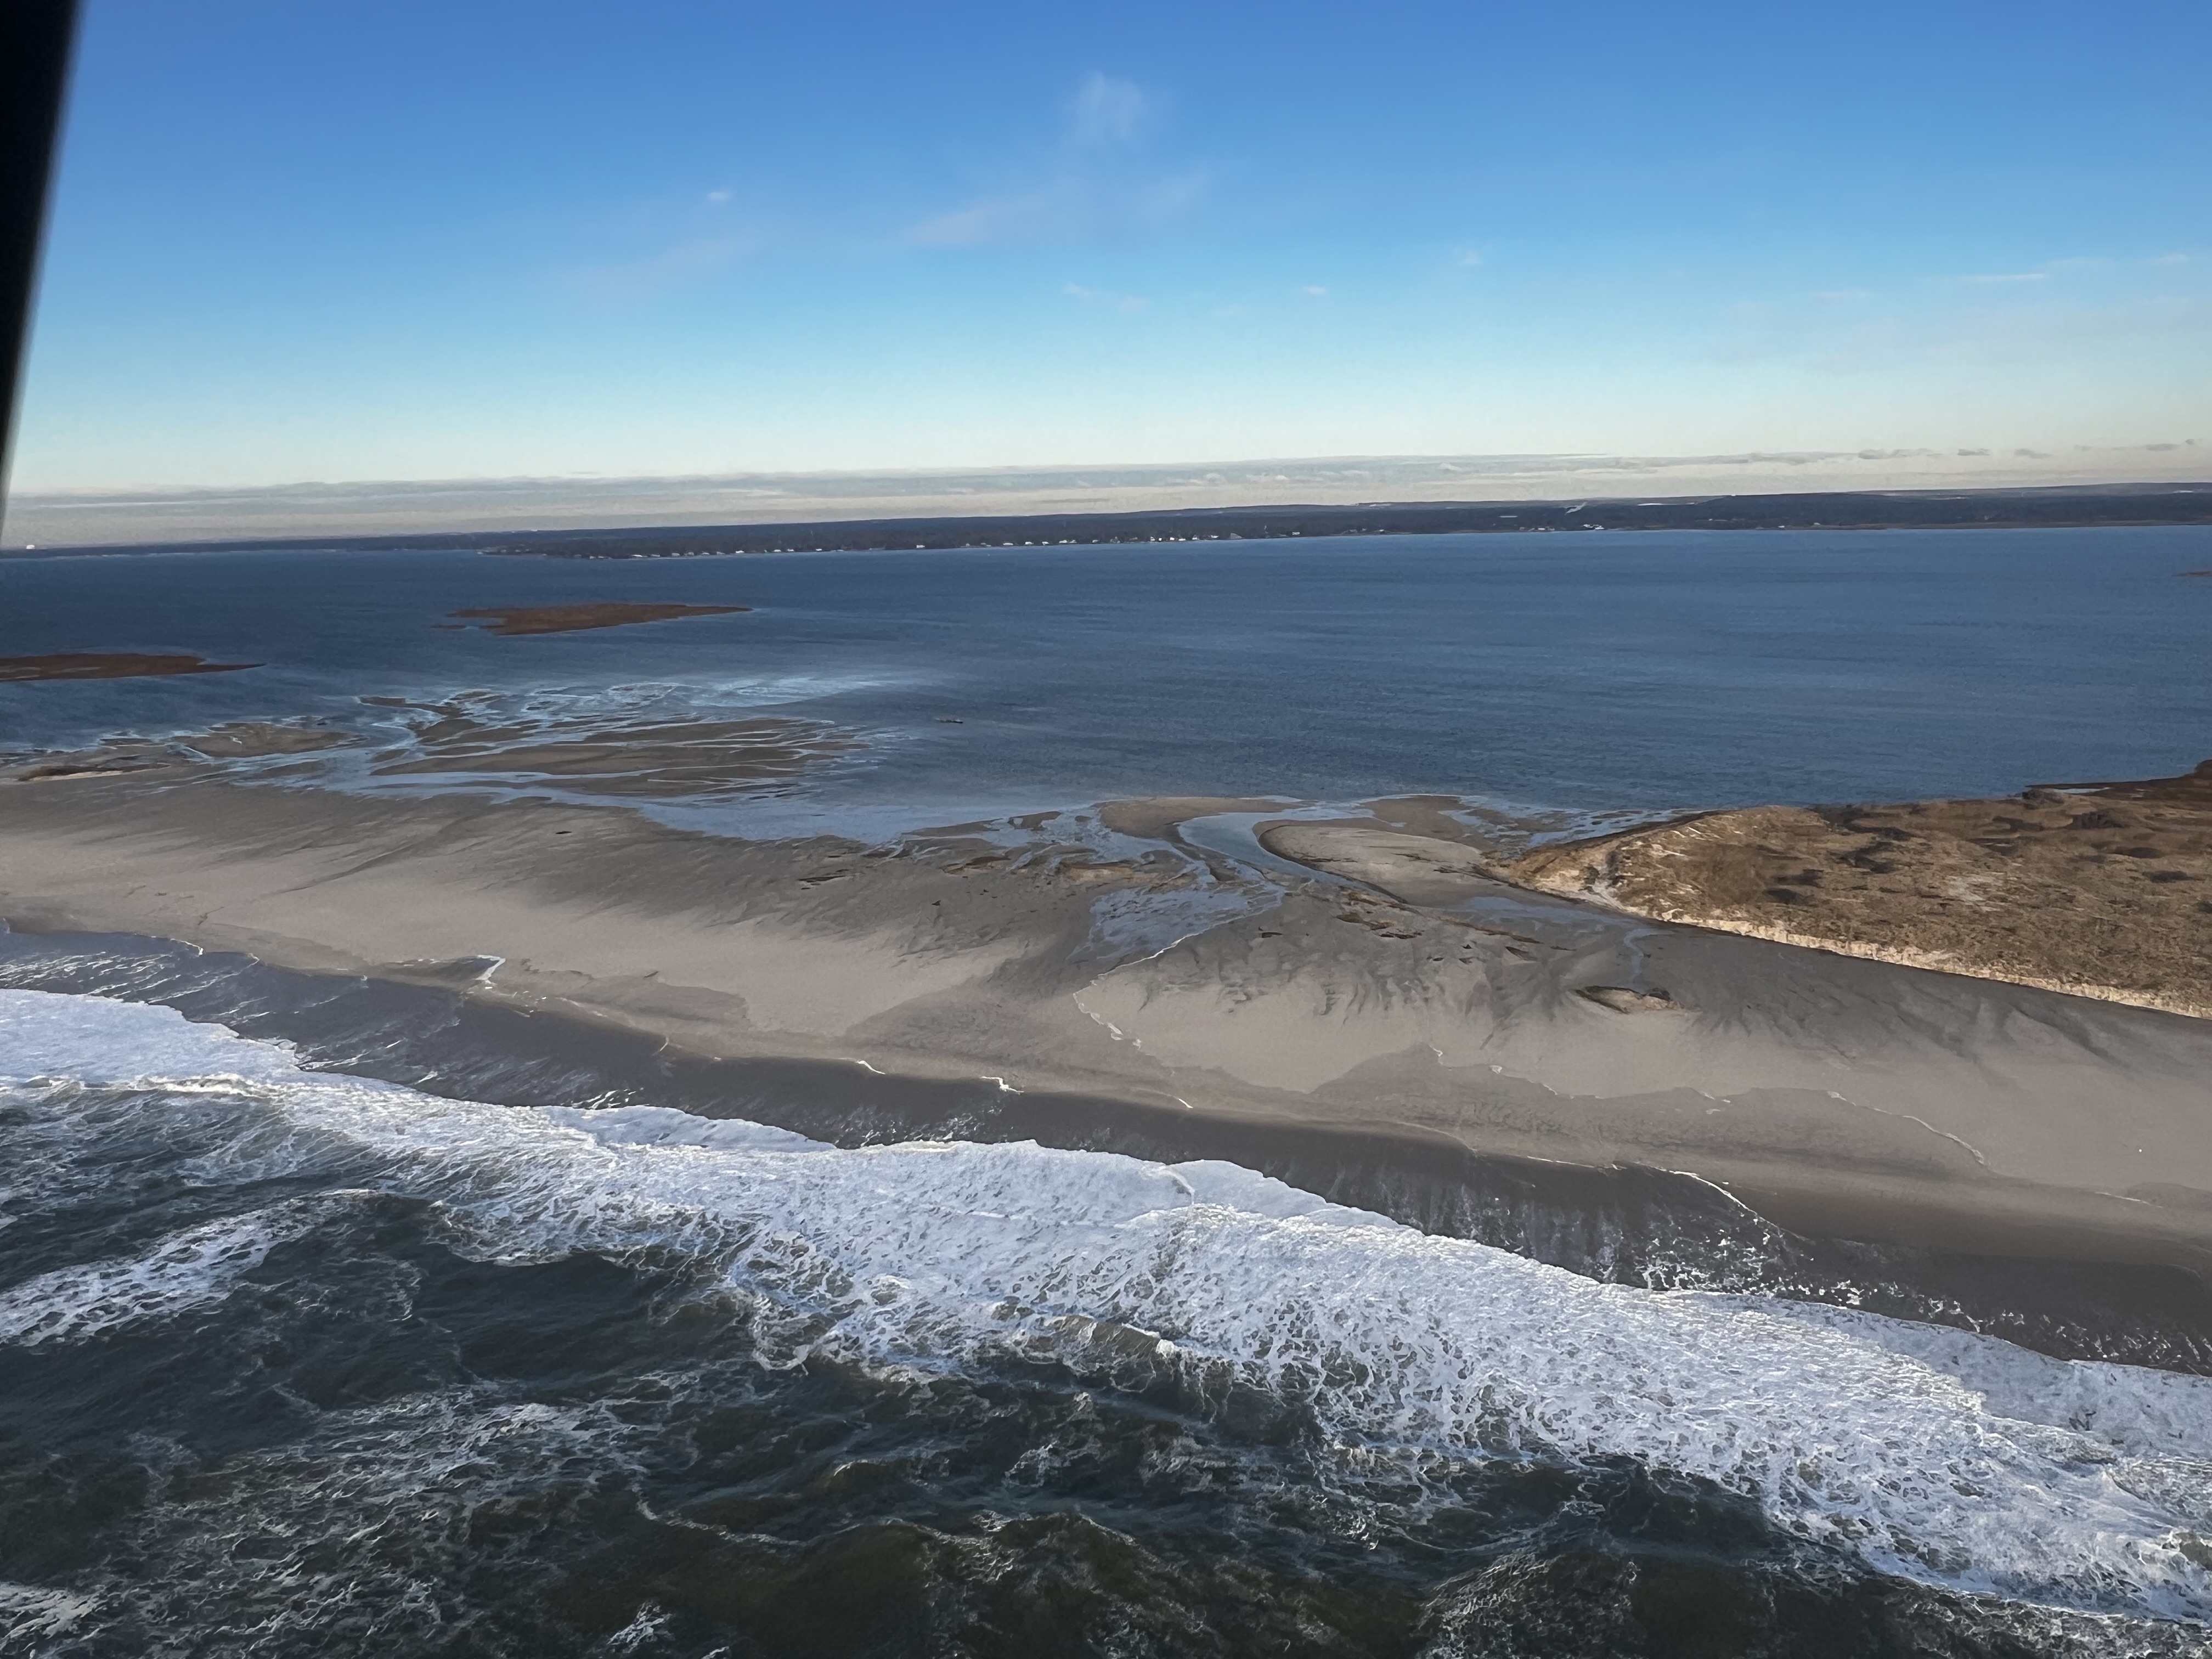 |
Mar 16, 2024 (CF)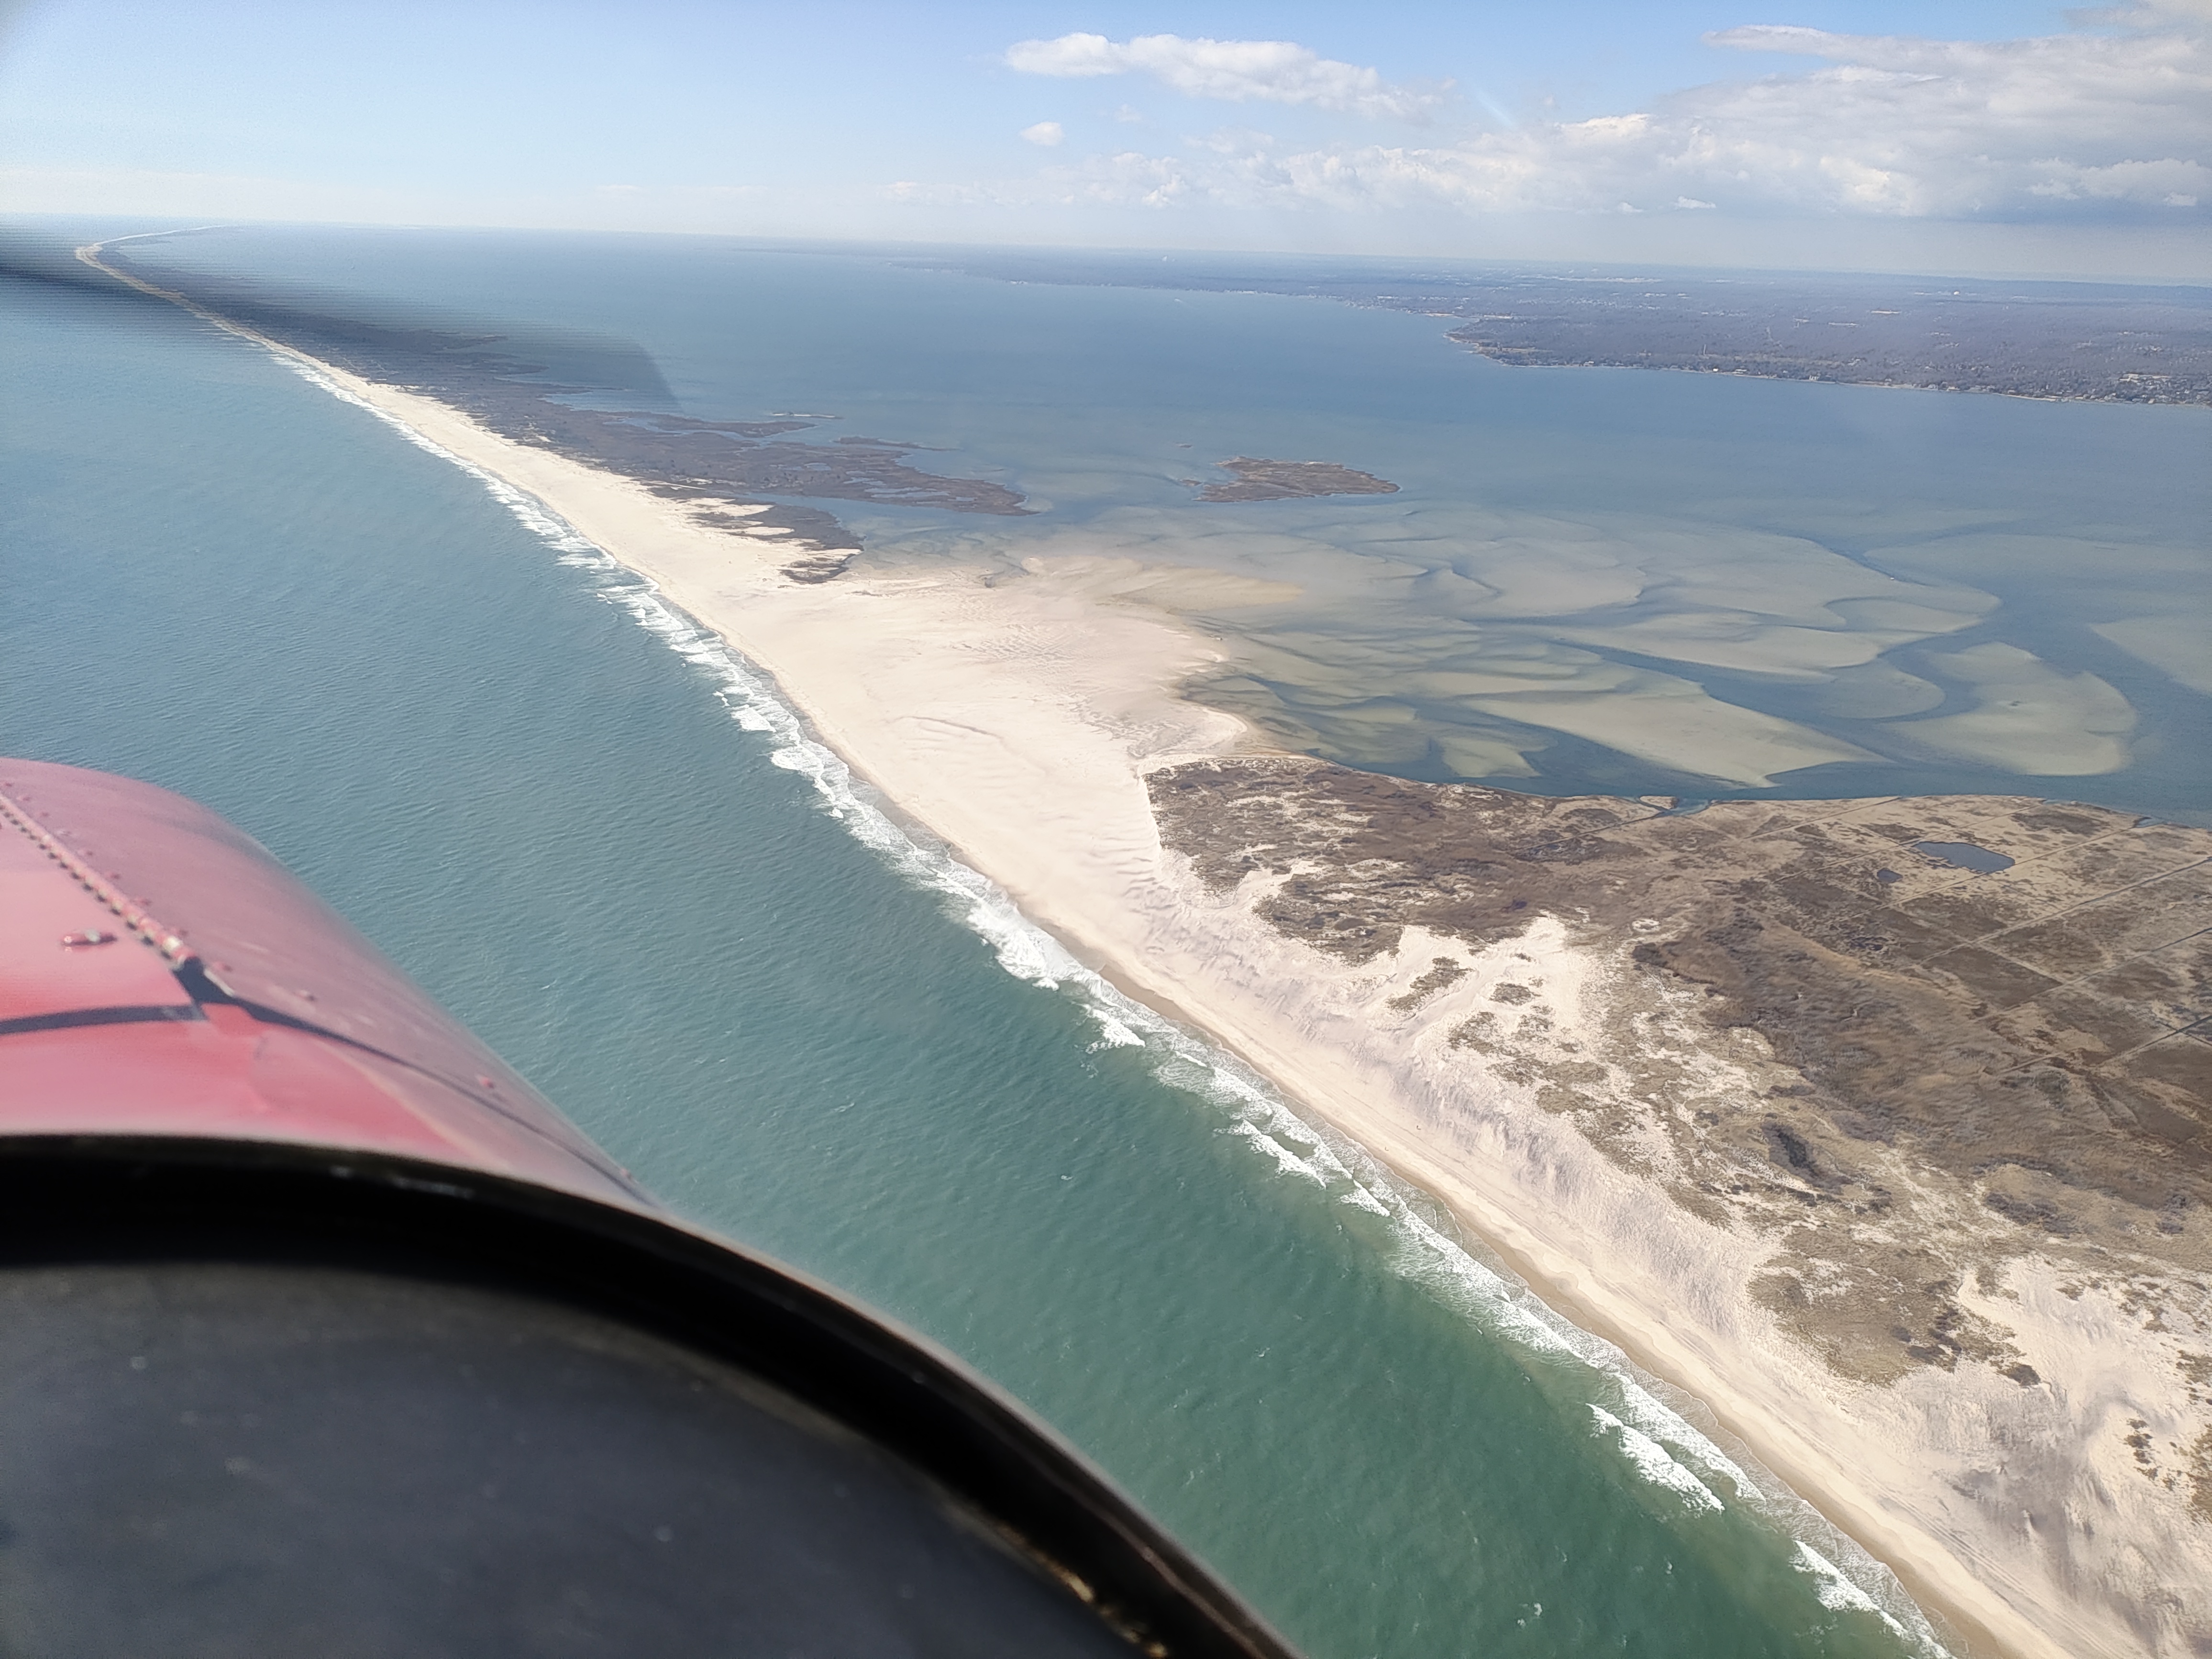 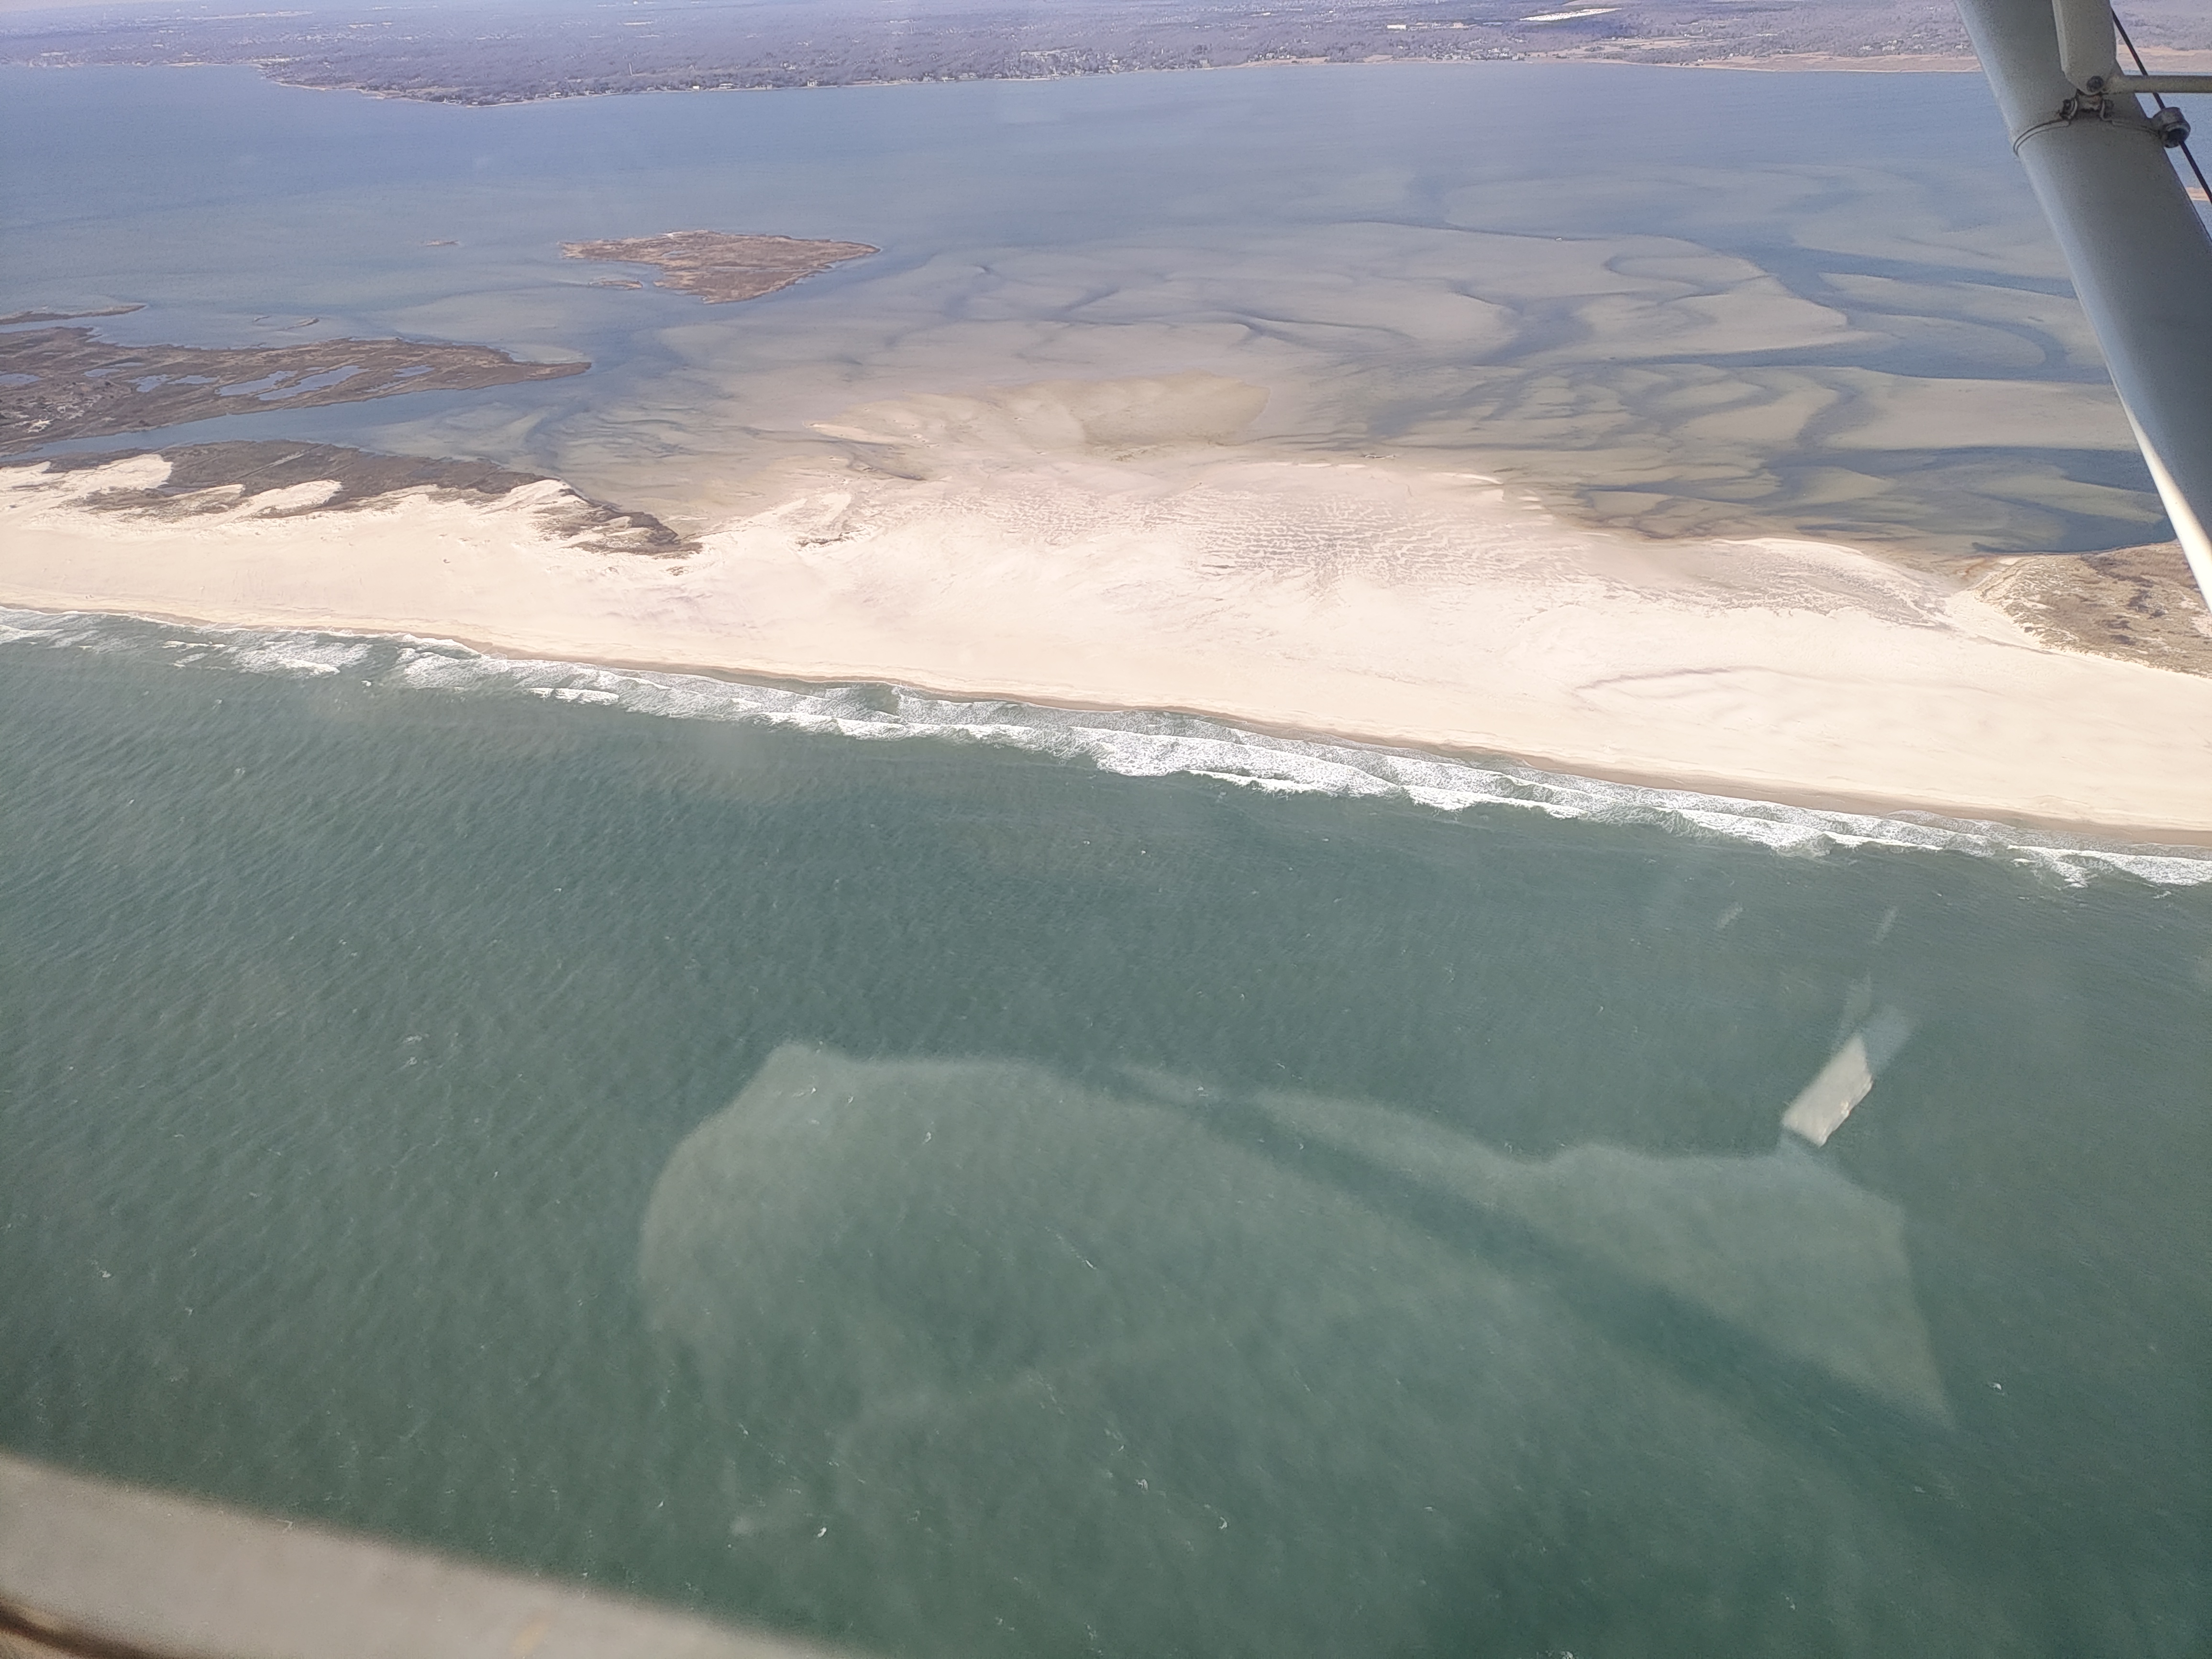 |
||||
Aug 26, 2025 (CF)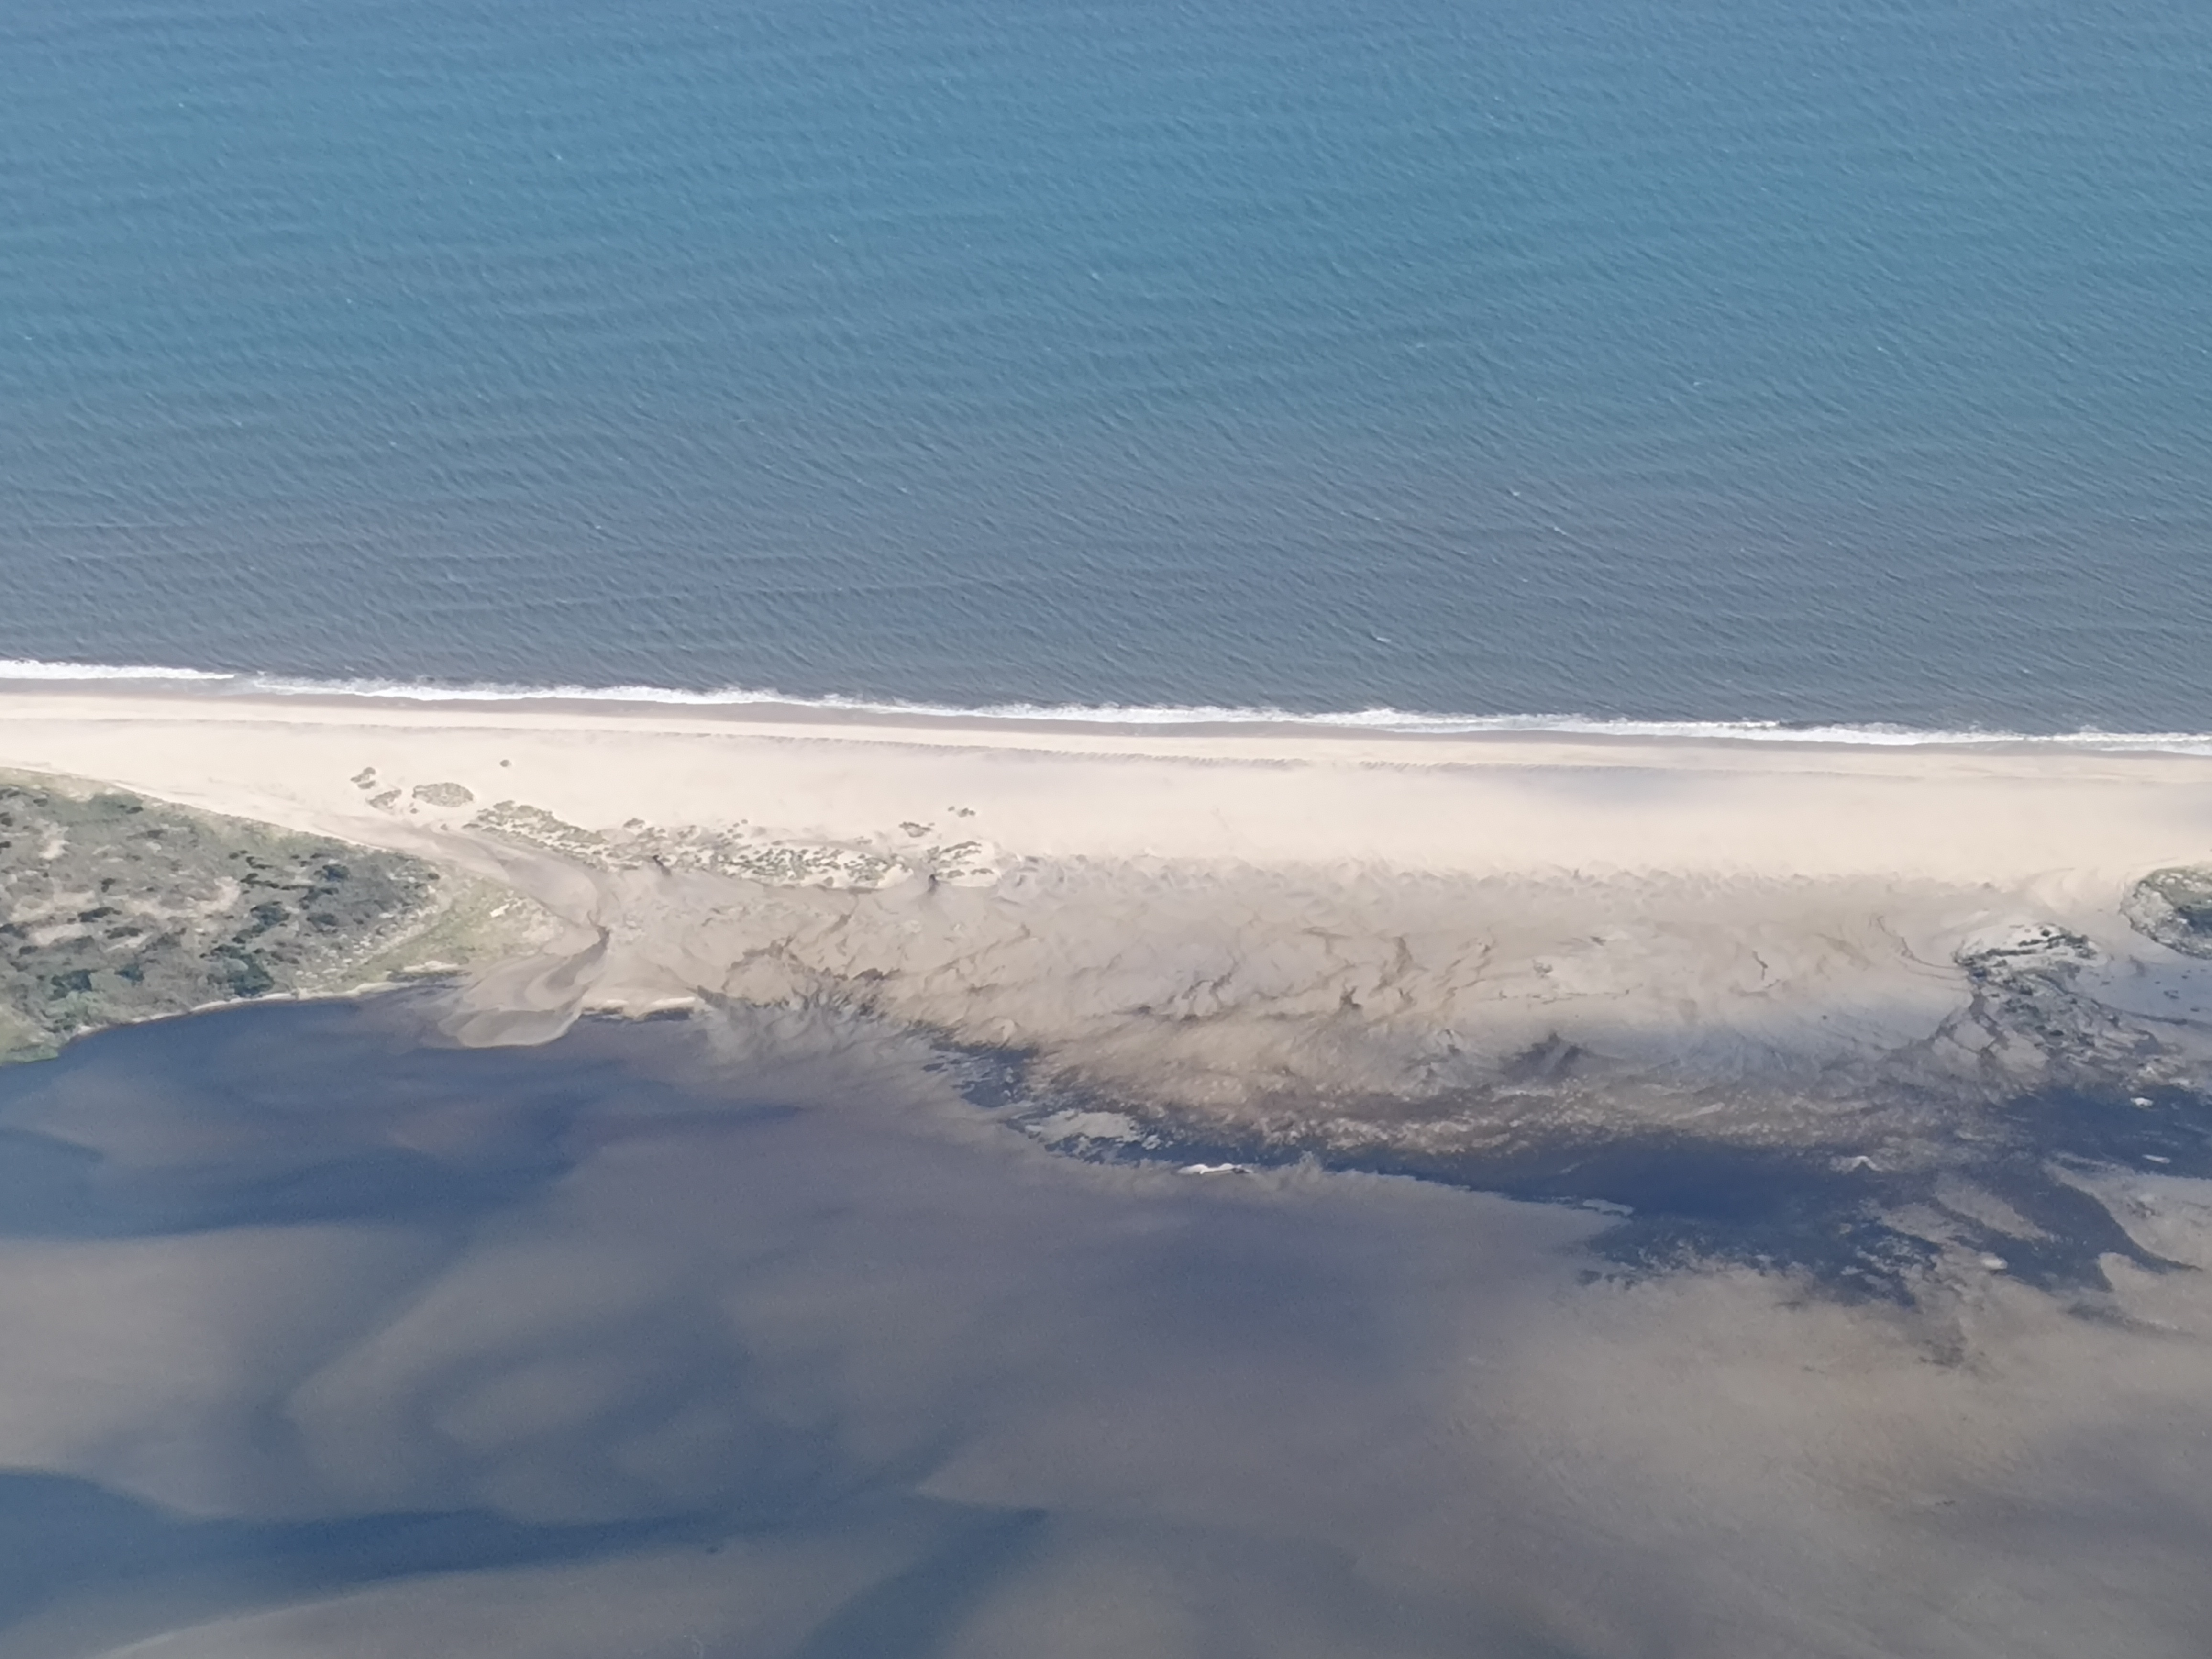 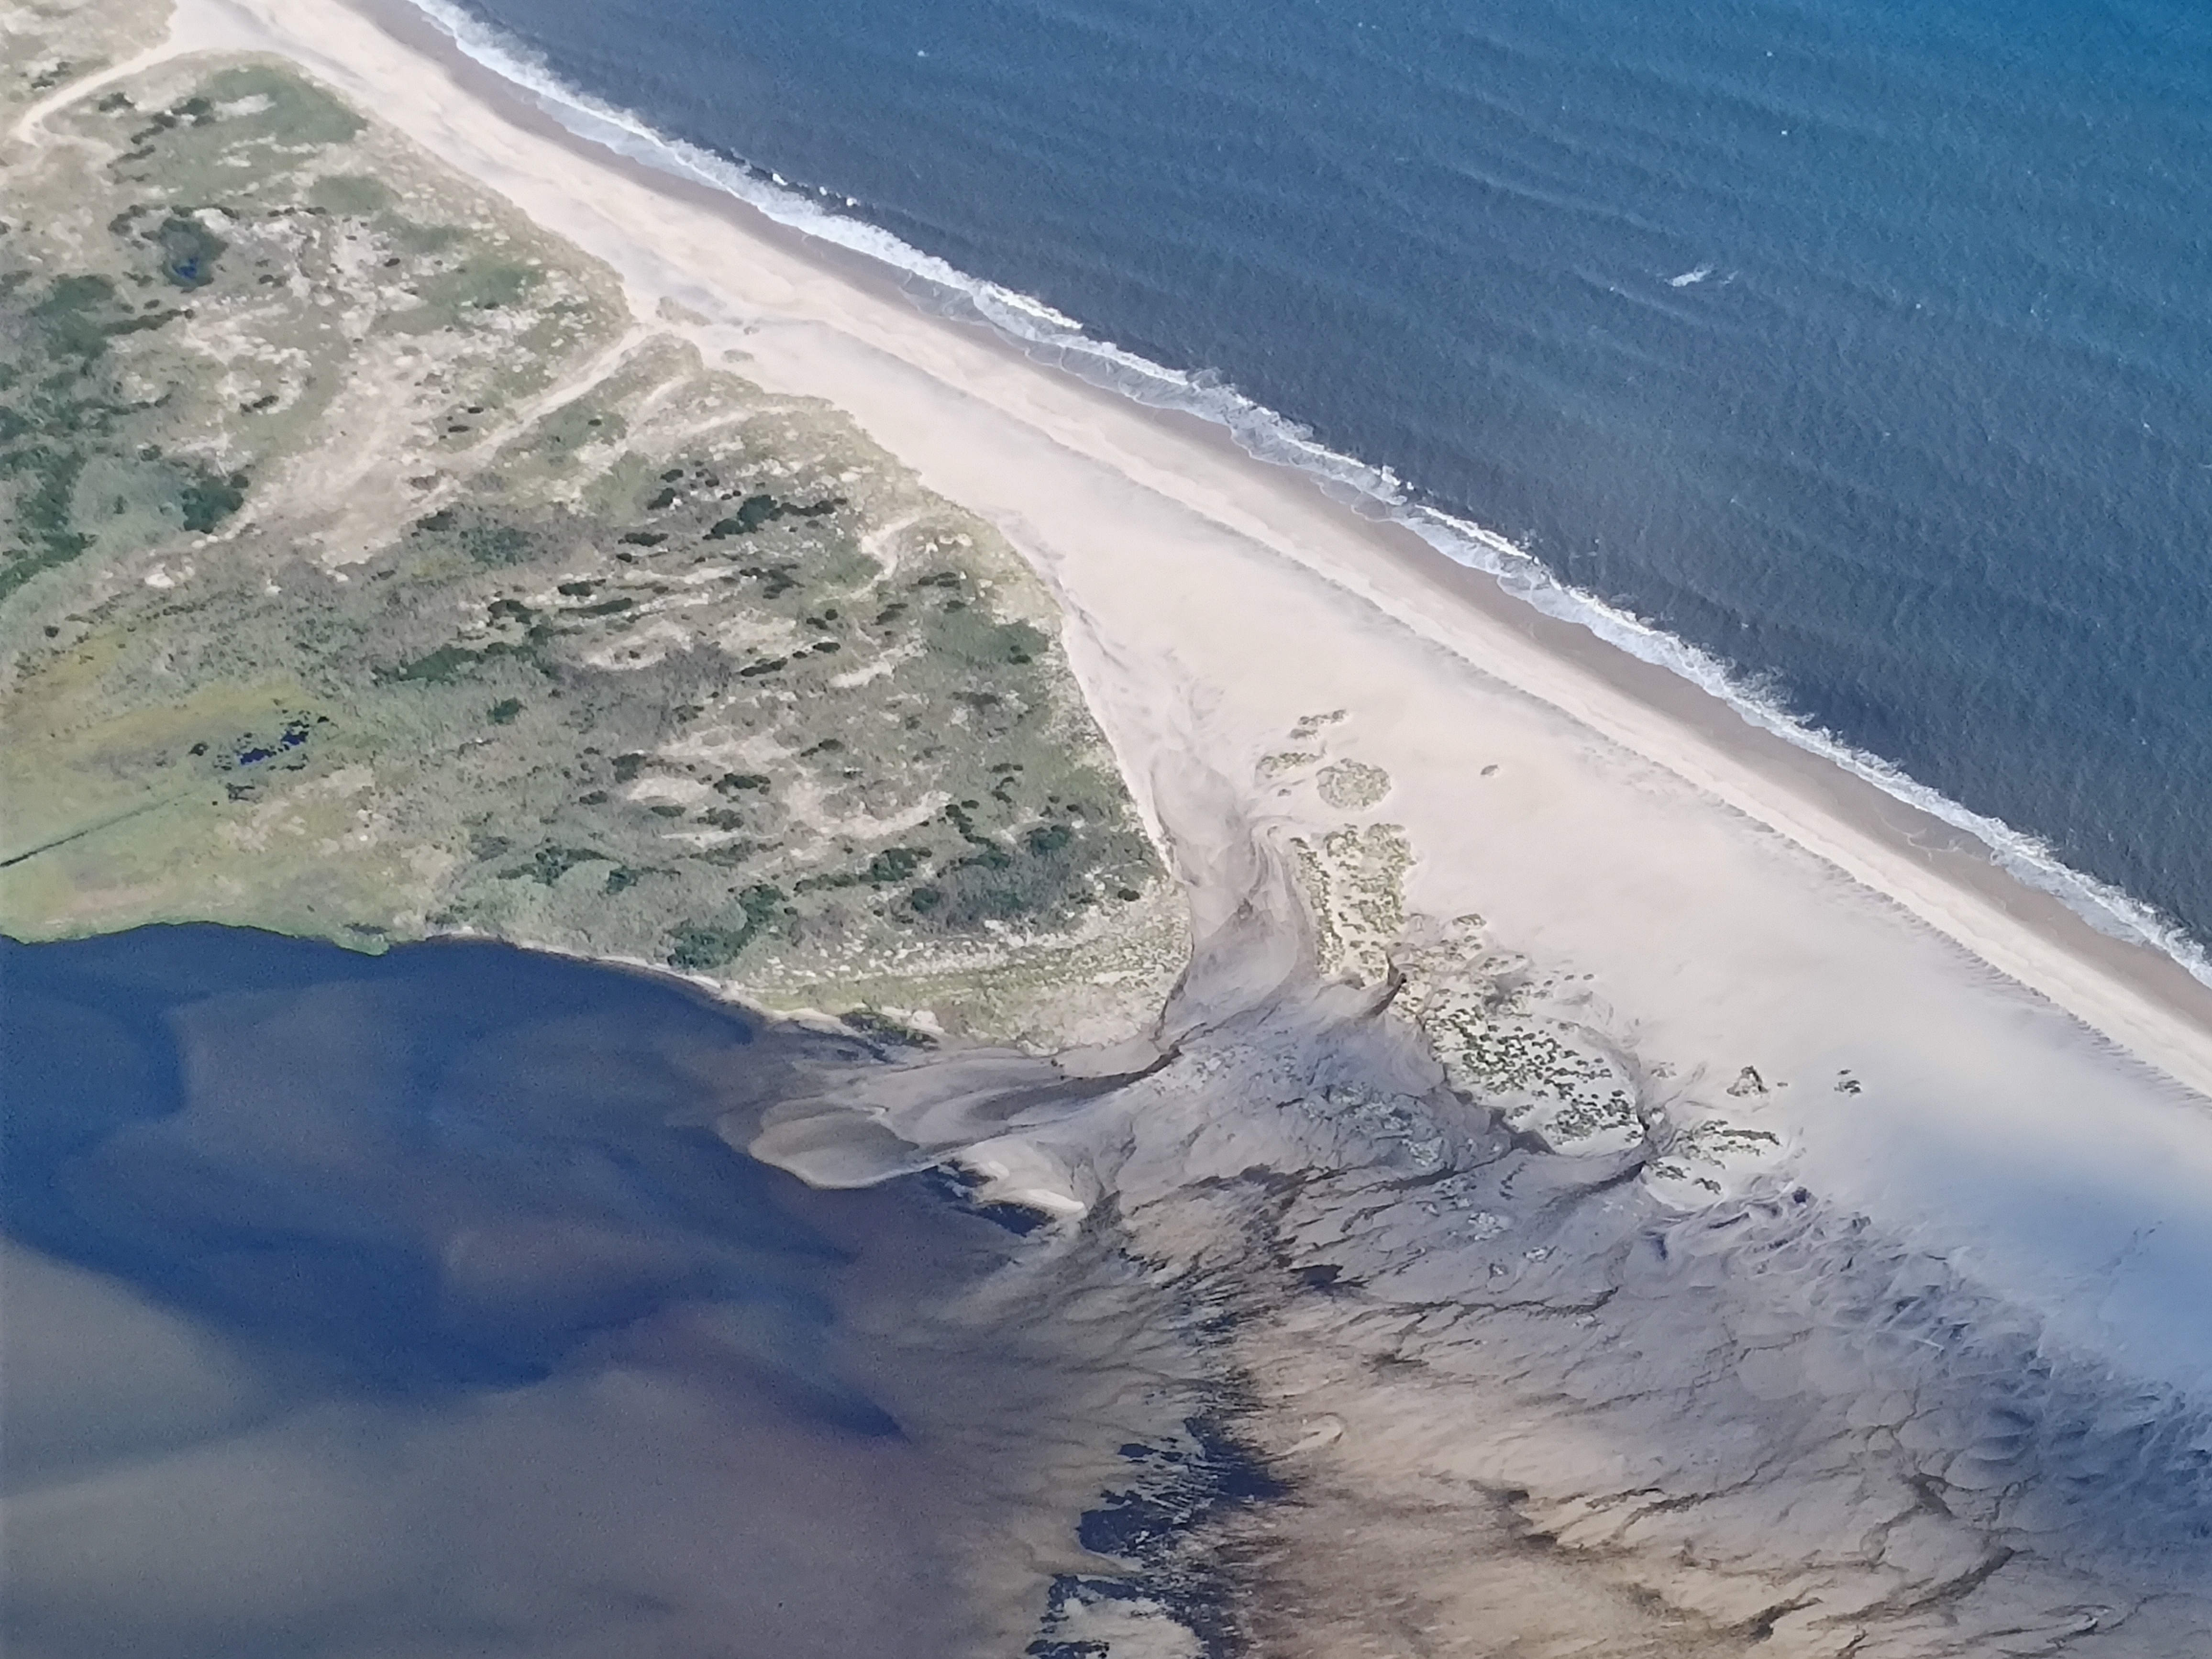 |
Oct 25, 2025 (CF)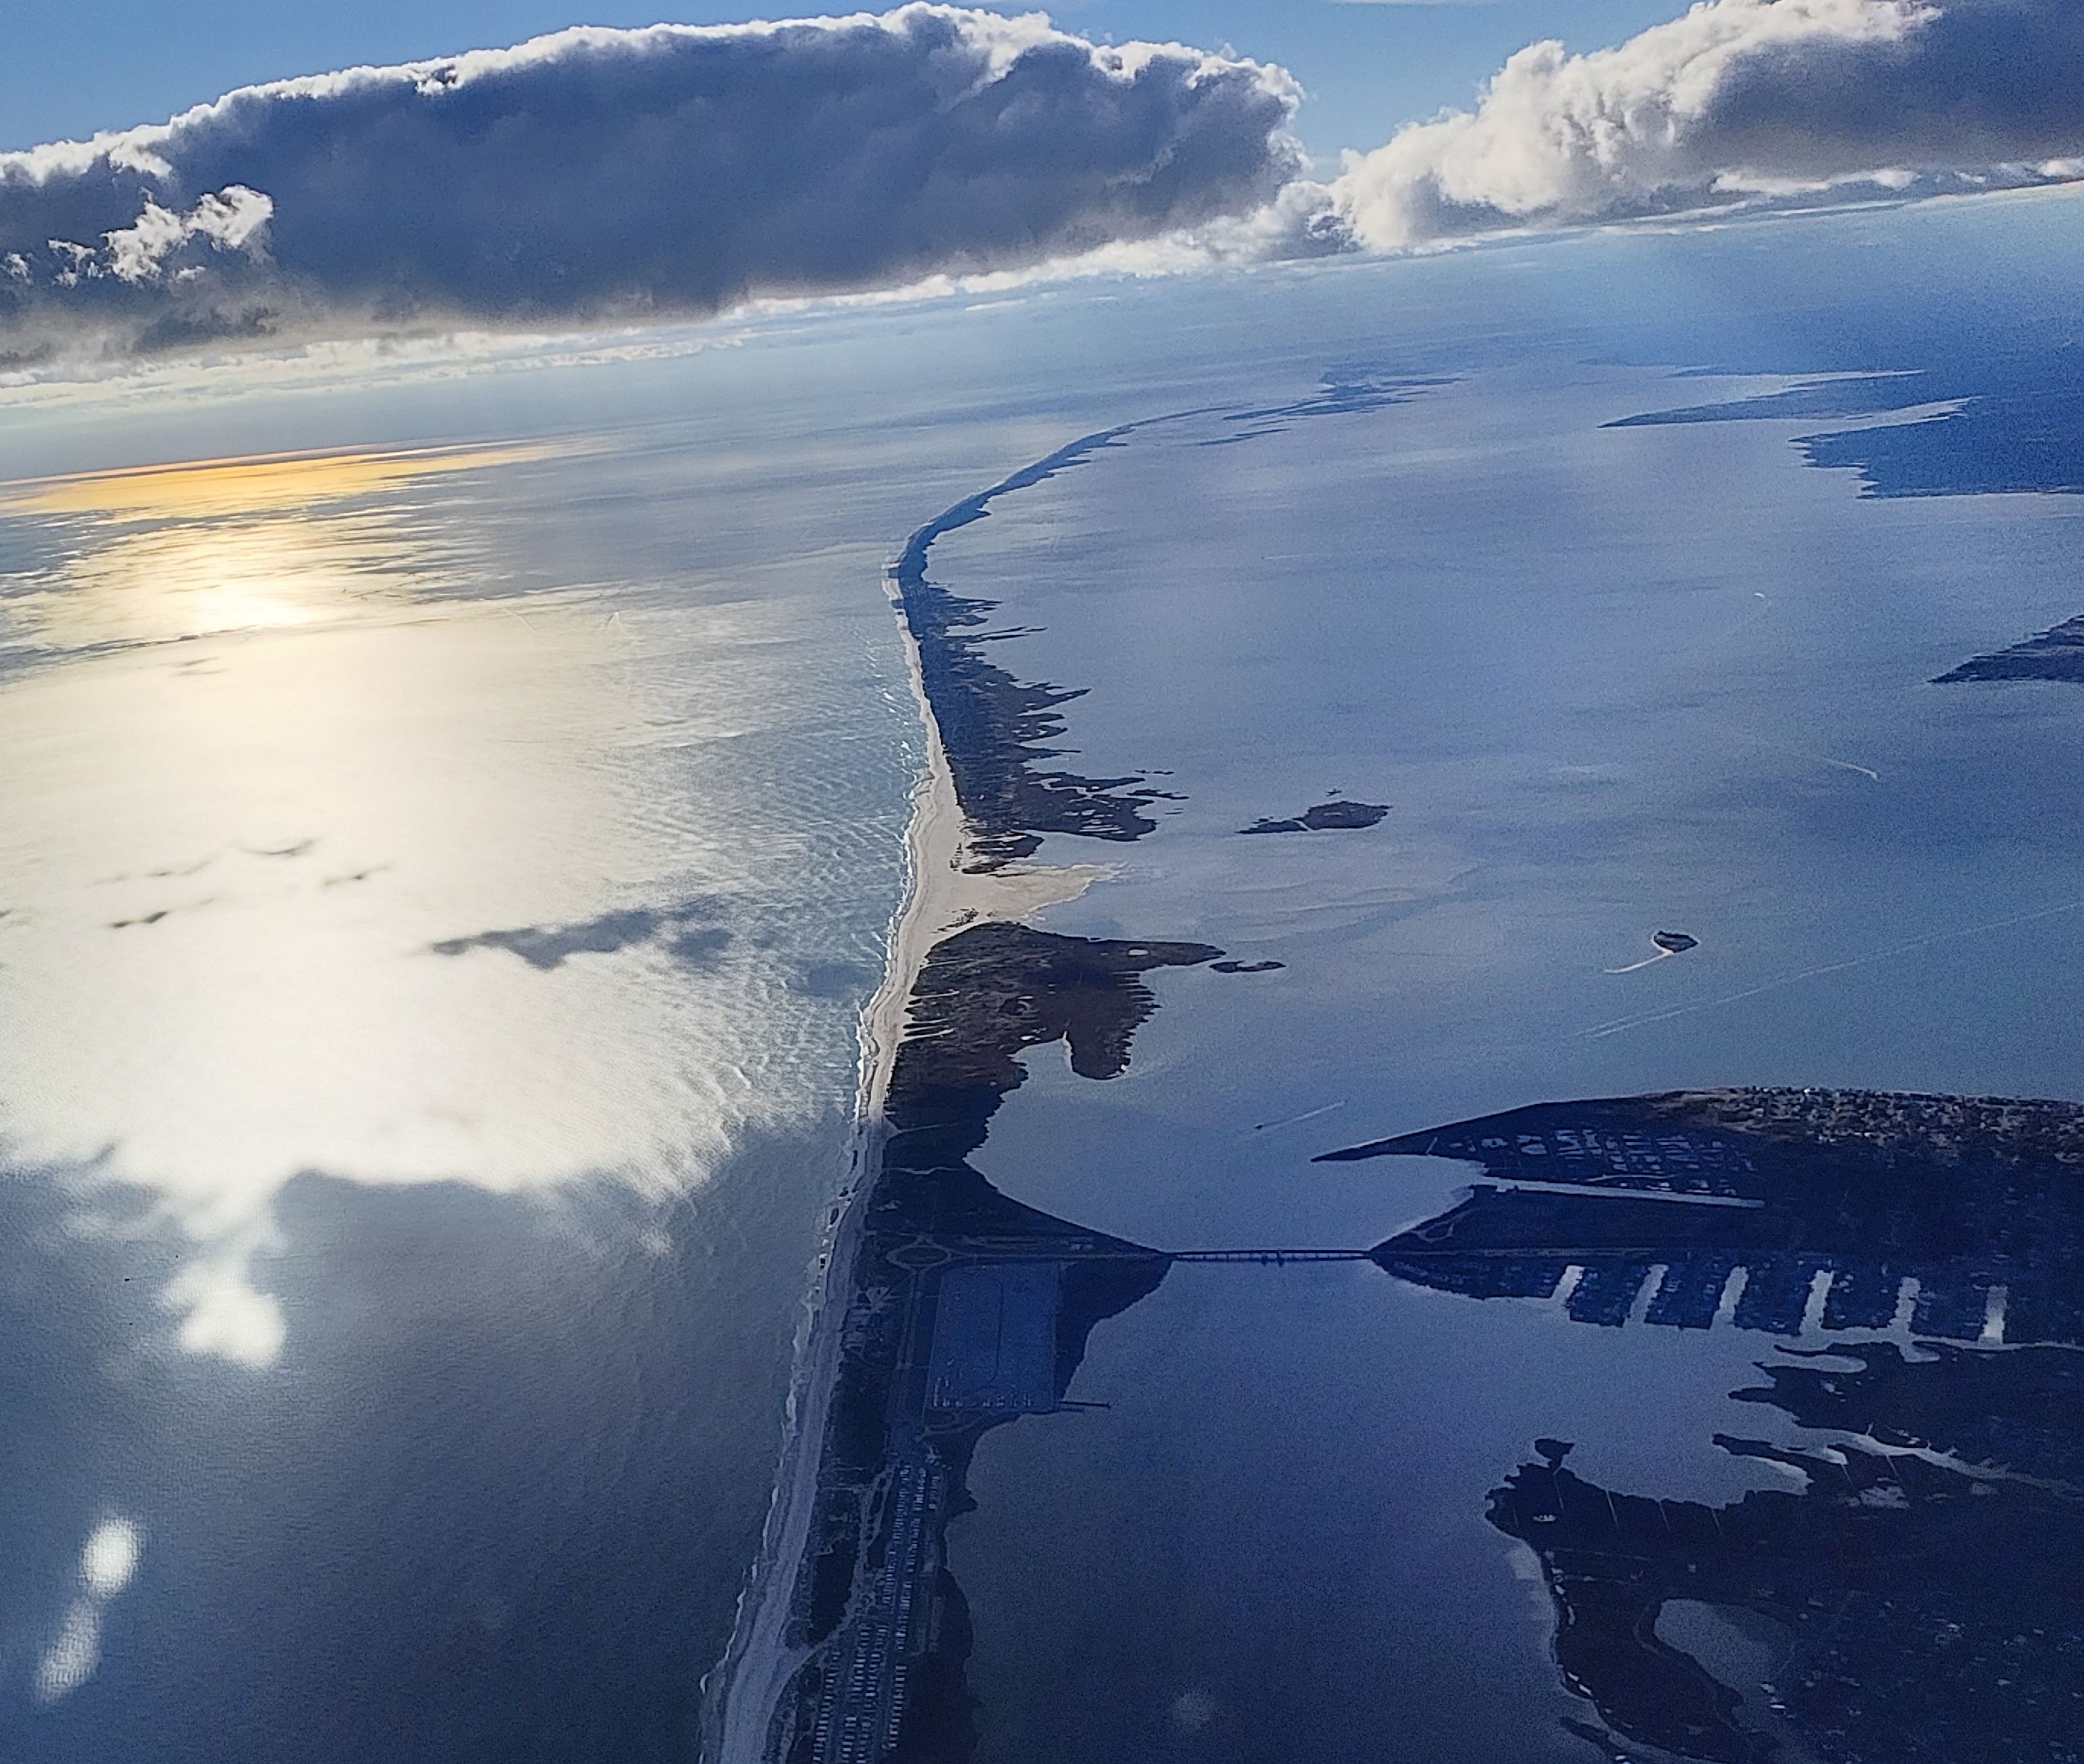 |
Nov 2, 2015 (CF)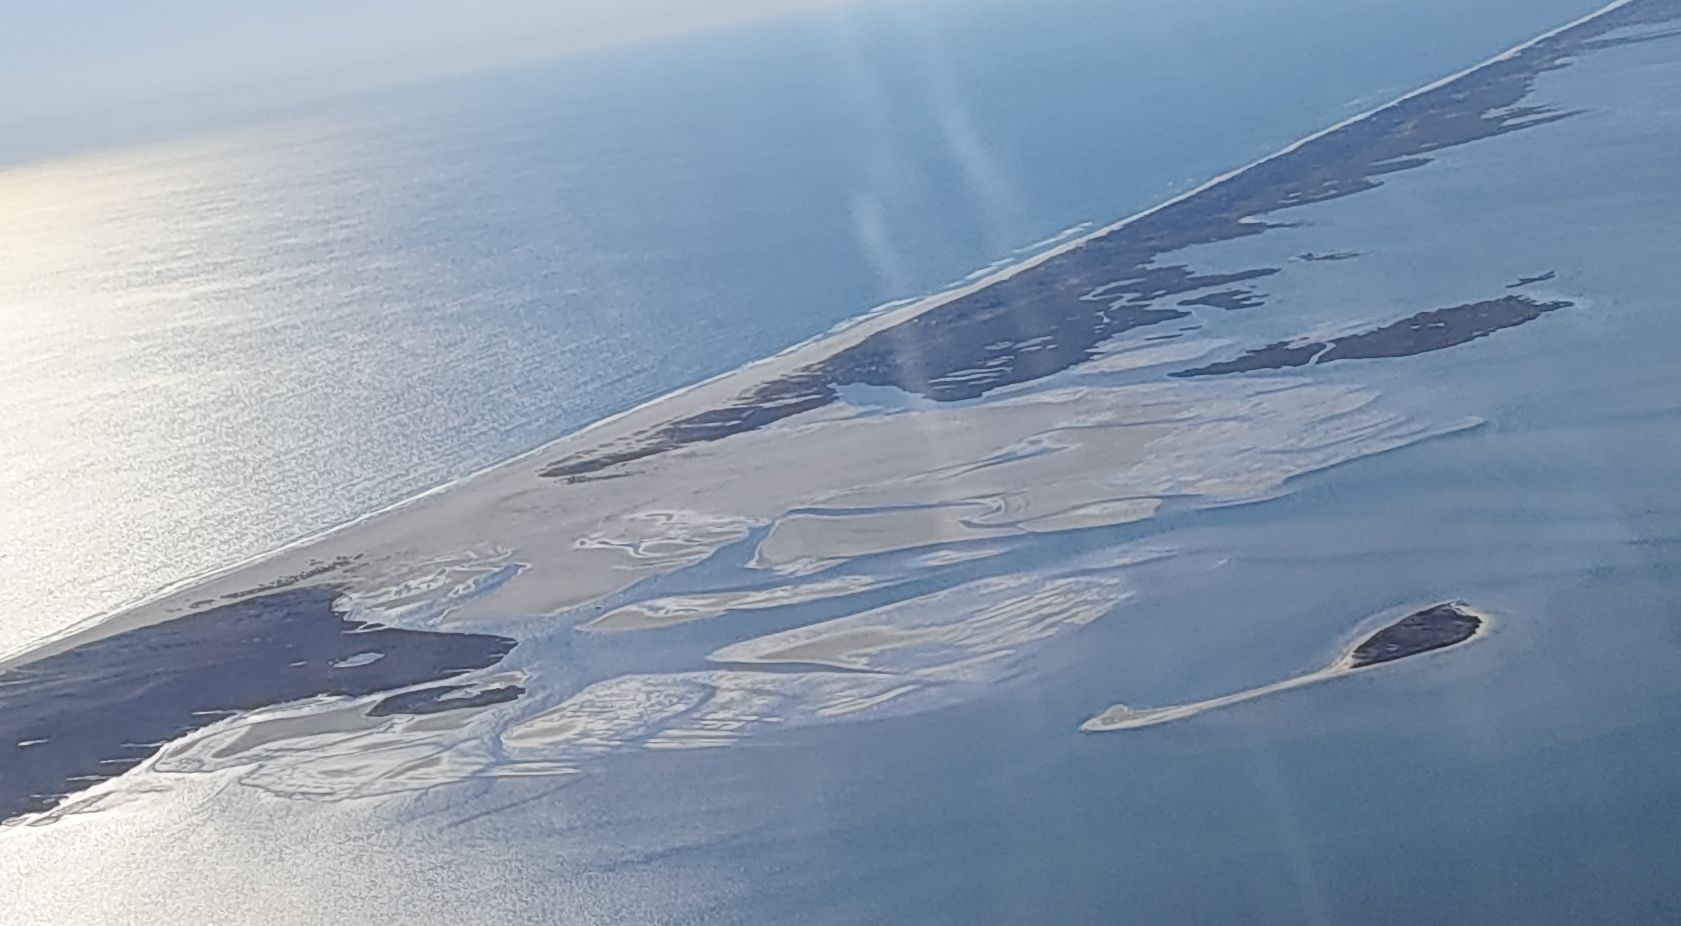 |
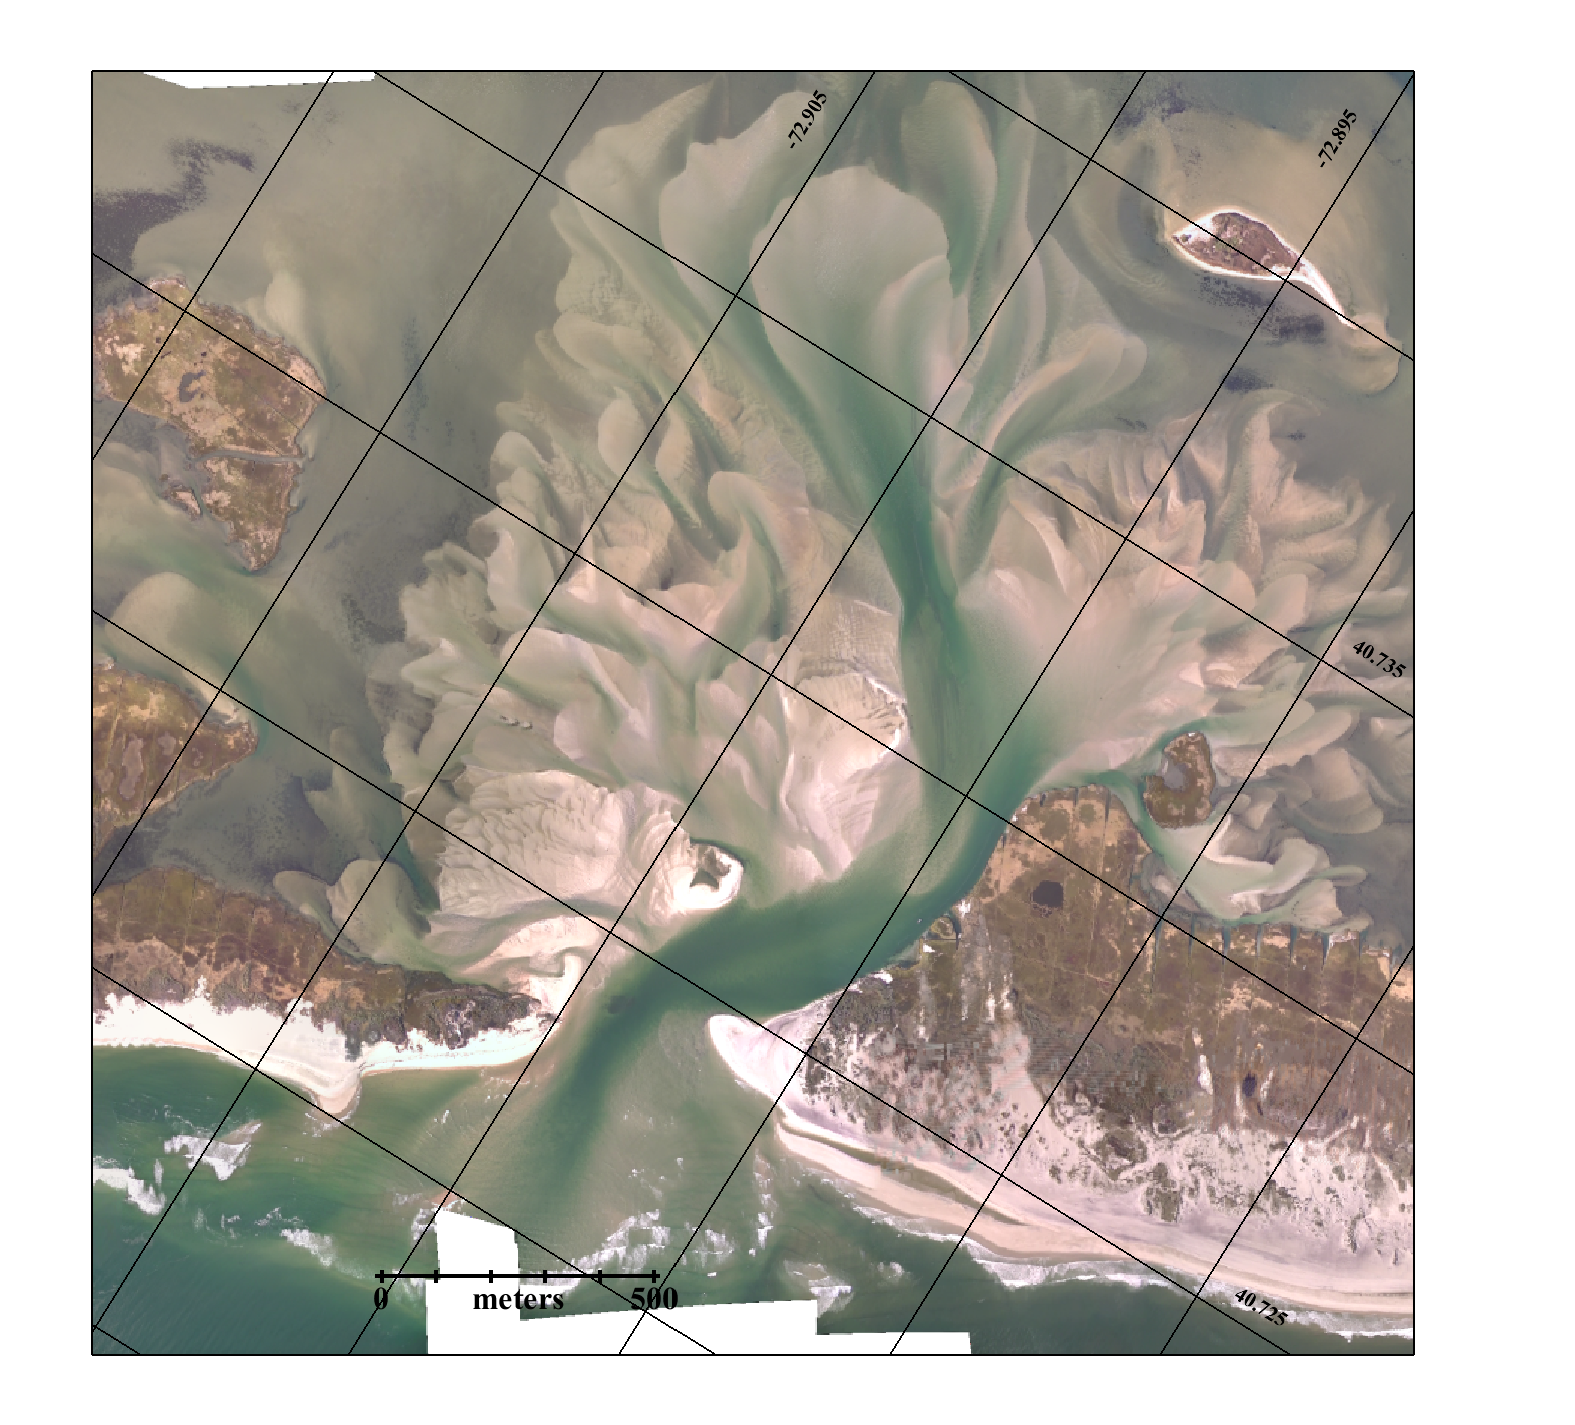
NEW:
Mark Lang has assembled all the
geo-referenced photo mosaics into a kml file that can be
viewed using Google Earth. By clicking between images
and using the fade in-out button you can clearly see how the
inlet is changing with time. The URL for the kml file
is: http://wx.somassbu.org/products/kml/OldInletBreach.kml
Hydrodynamic Modeling
Great
South Bay Observatory Data Collection
|
|
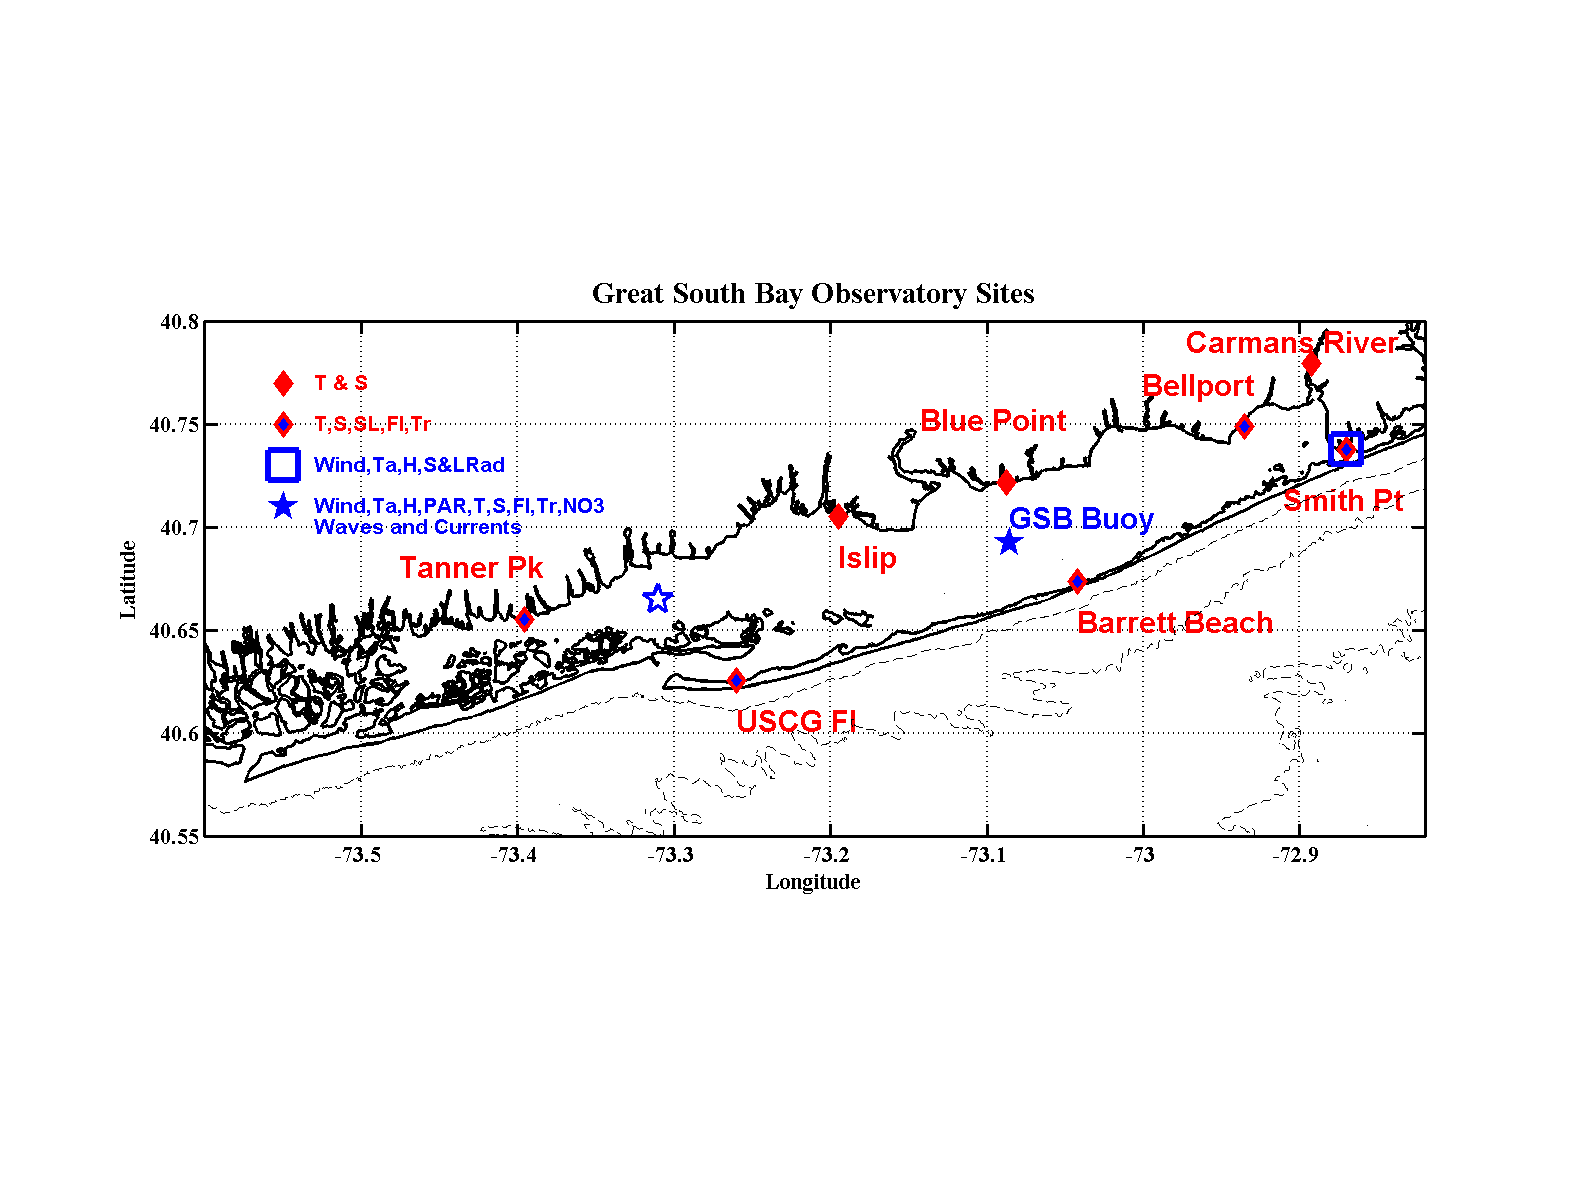 |
| Data are being collected
from eight stations on the Great South Bay using SeaCat
instruments measuring temperature and salinity.
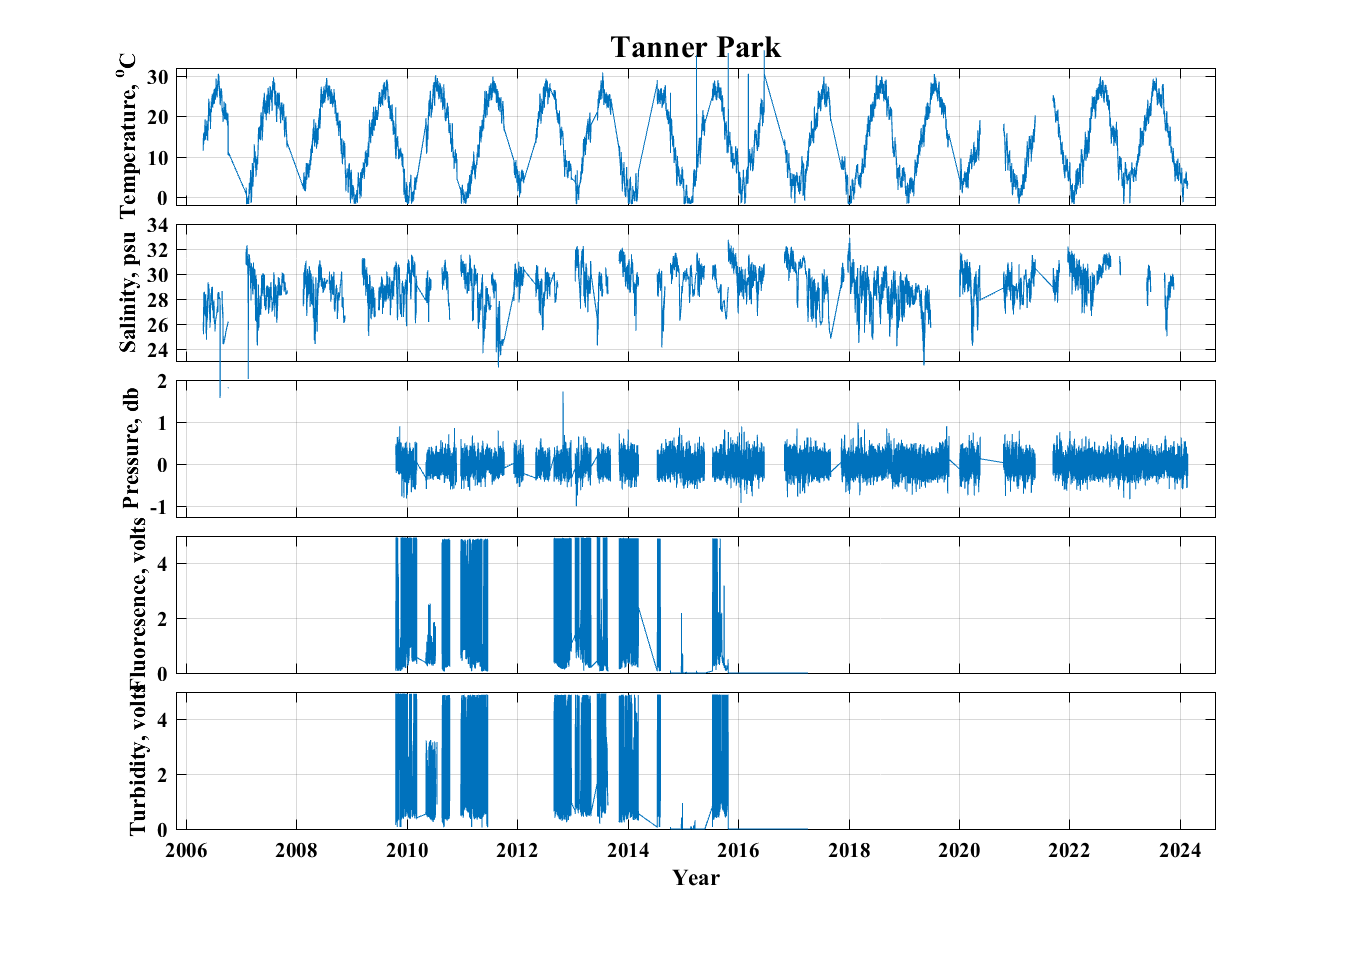
The stations include, from east to west on the
north shore: Smith Point, Bellport, Blue Point, Islip and Tanner Park, and
the US Coast Guard Station and Barrett Beach on Fire
Island. The instruments are deployed for as much
as three months at a time, less in the summer due to
heavy biofouling. |
||||
SBE 16 SeaCat SBE 16 Plus
SeaCat with WetLabs FLNTUS 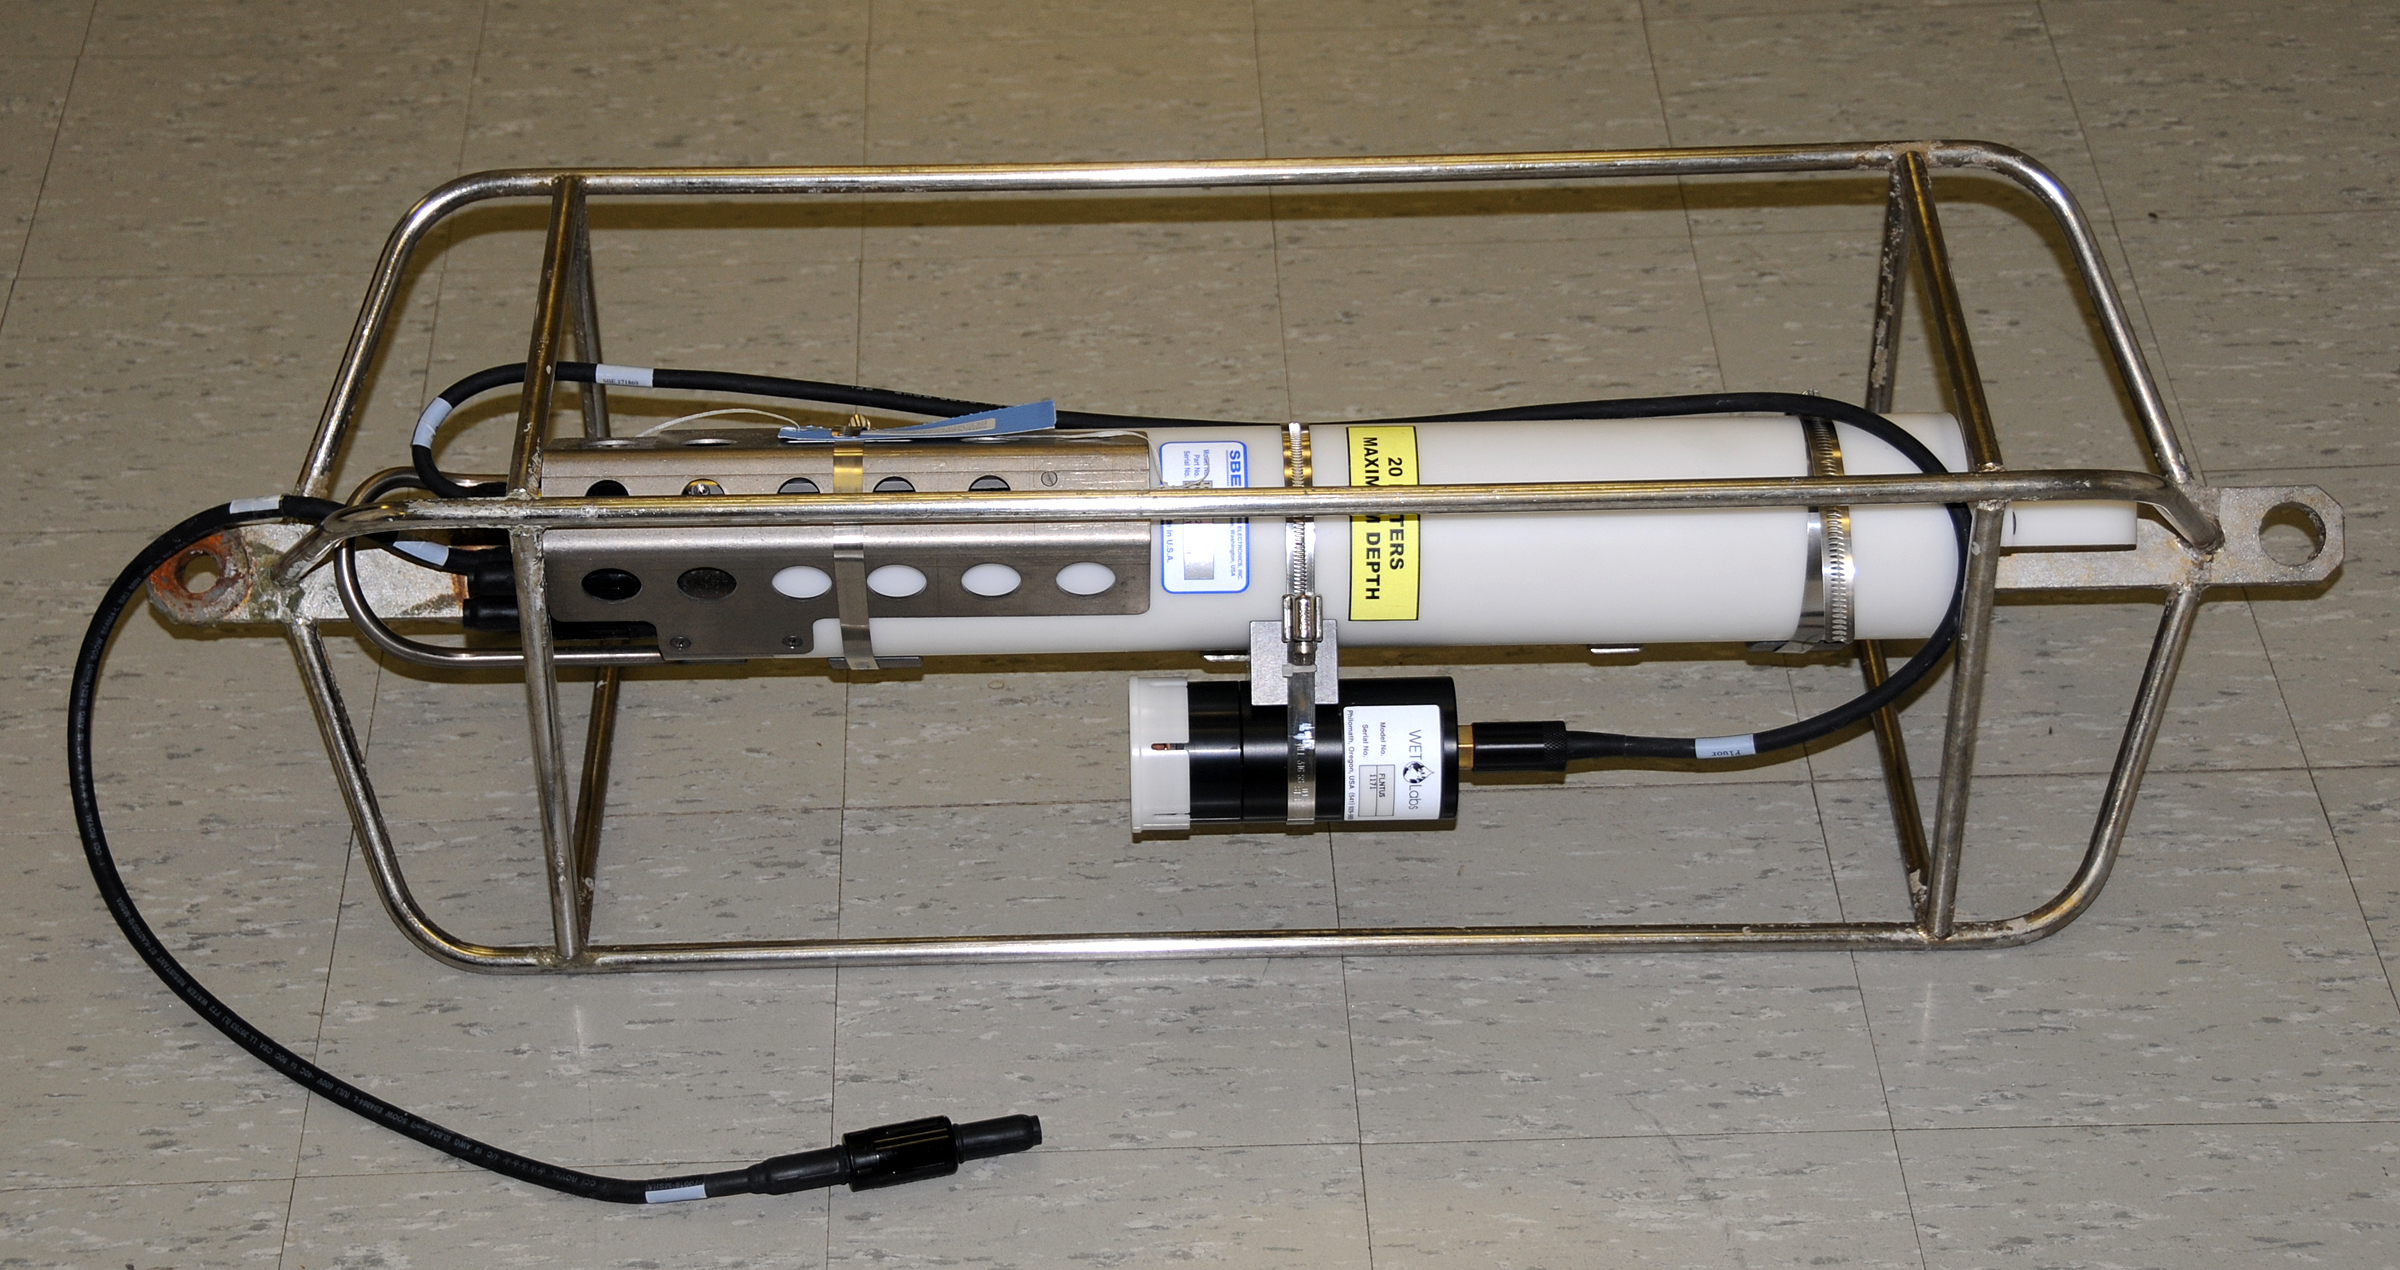 |
||||
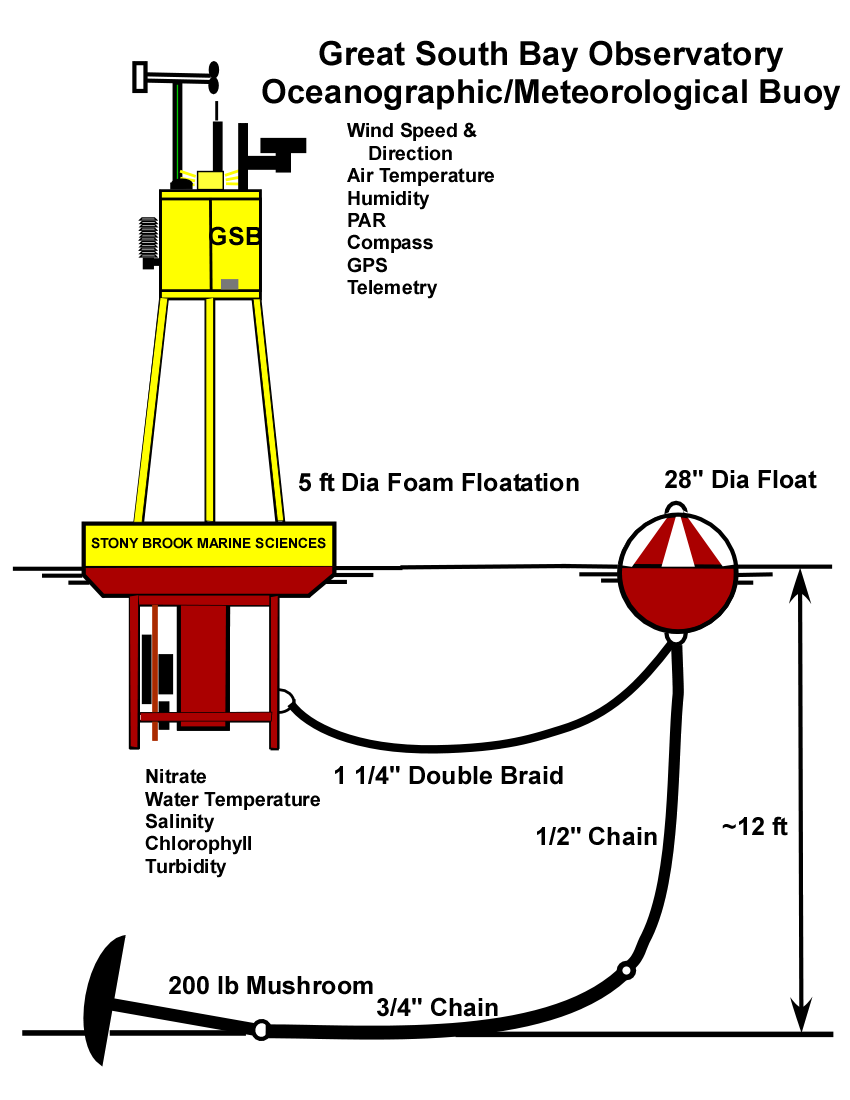
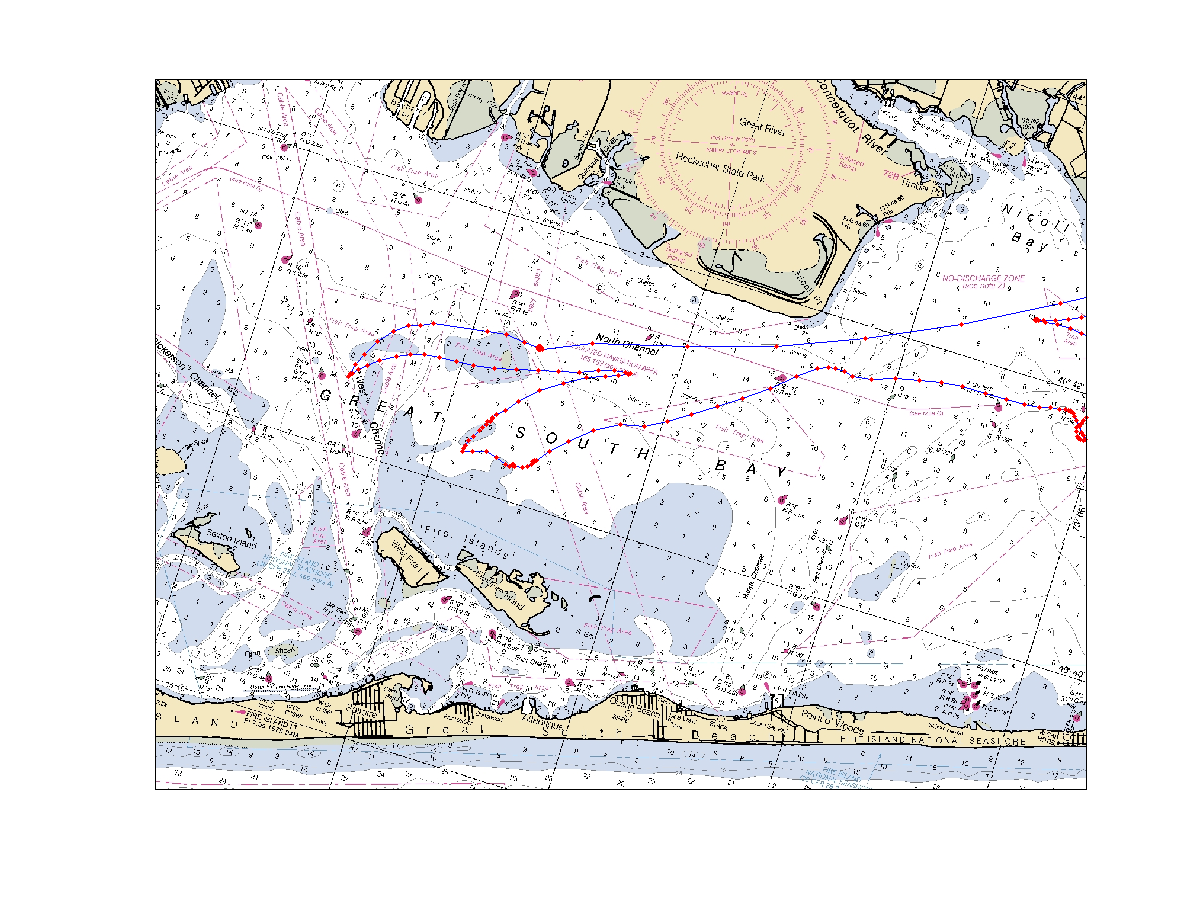
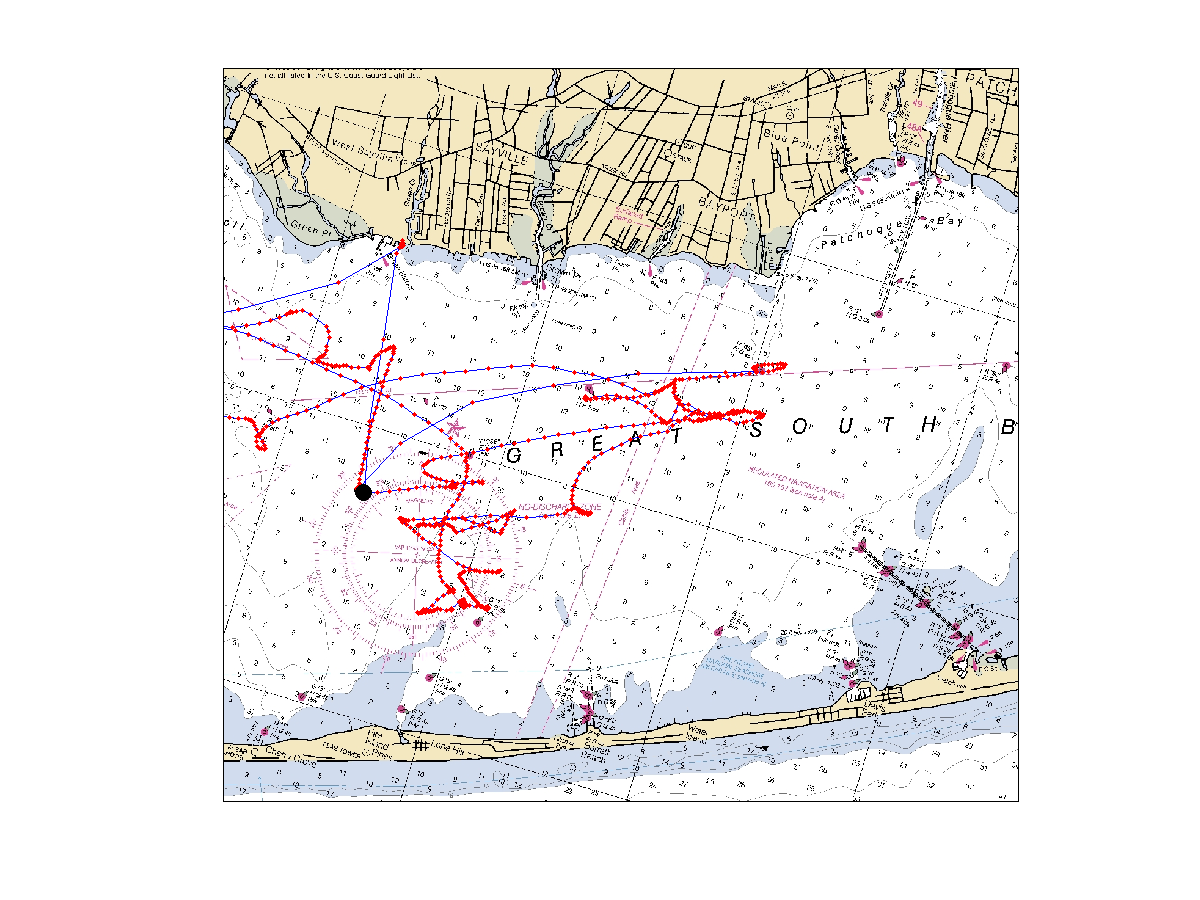
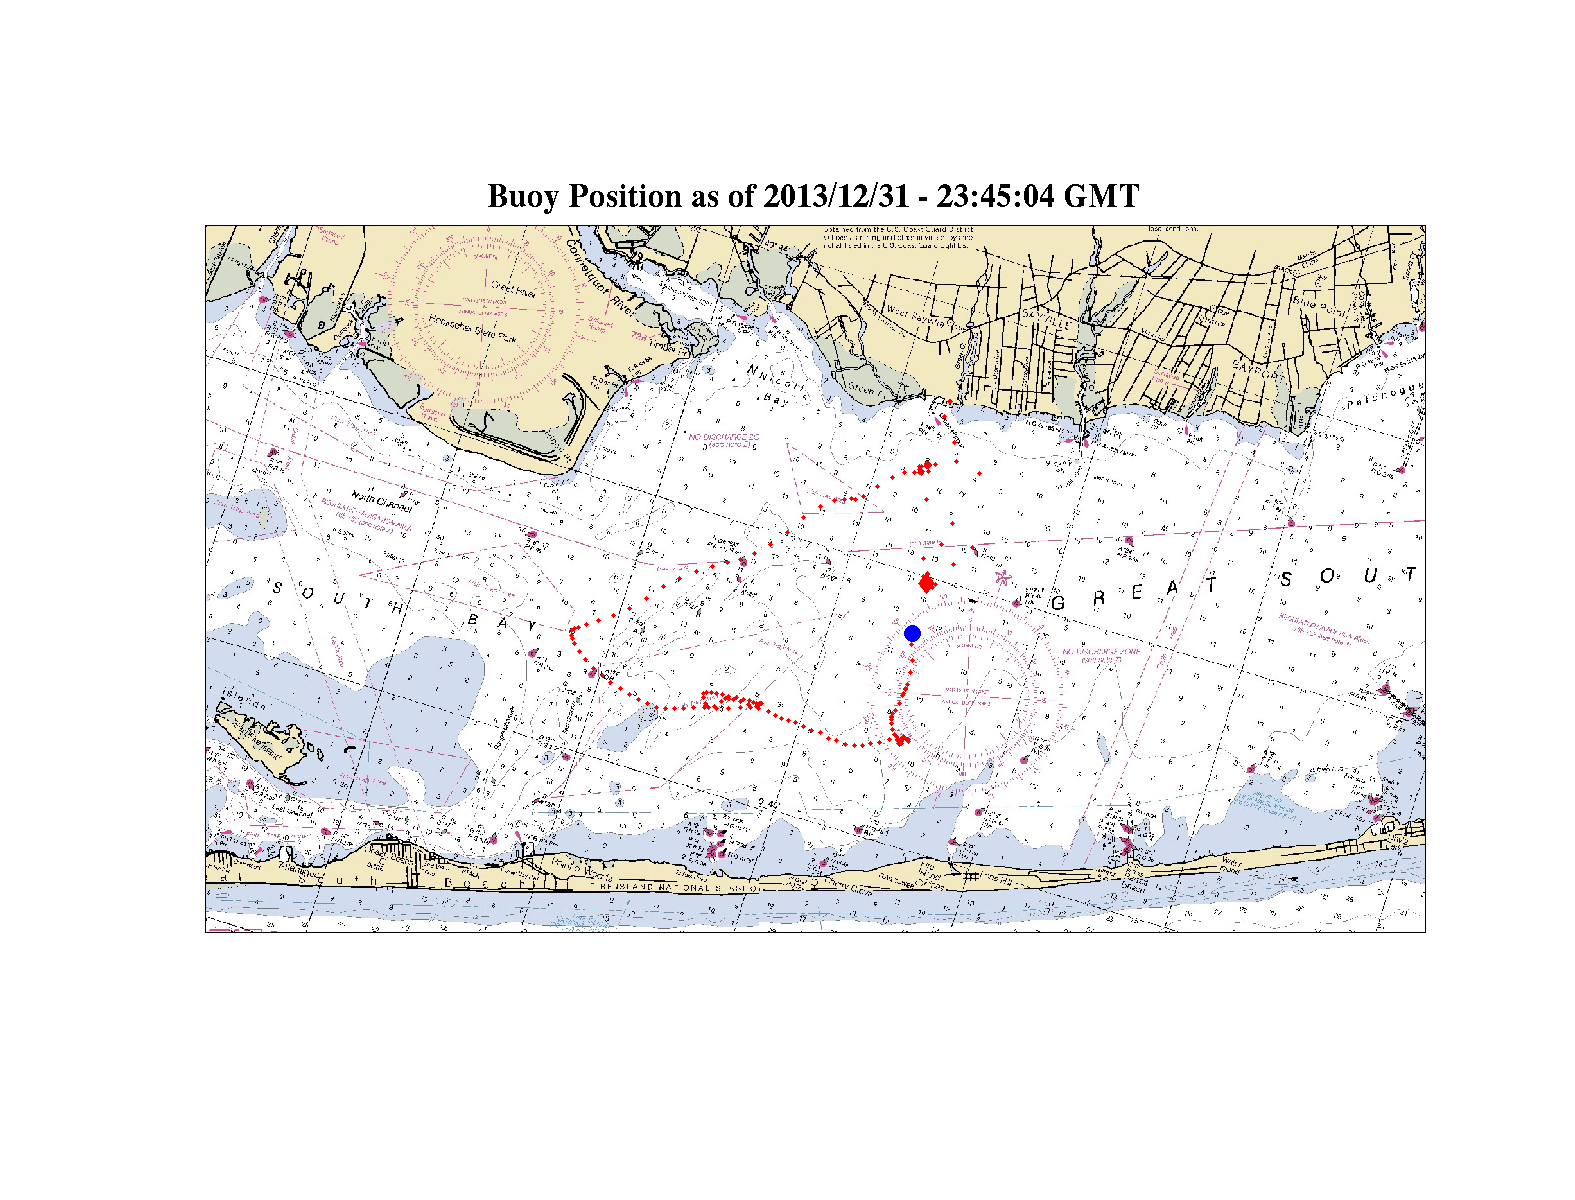
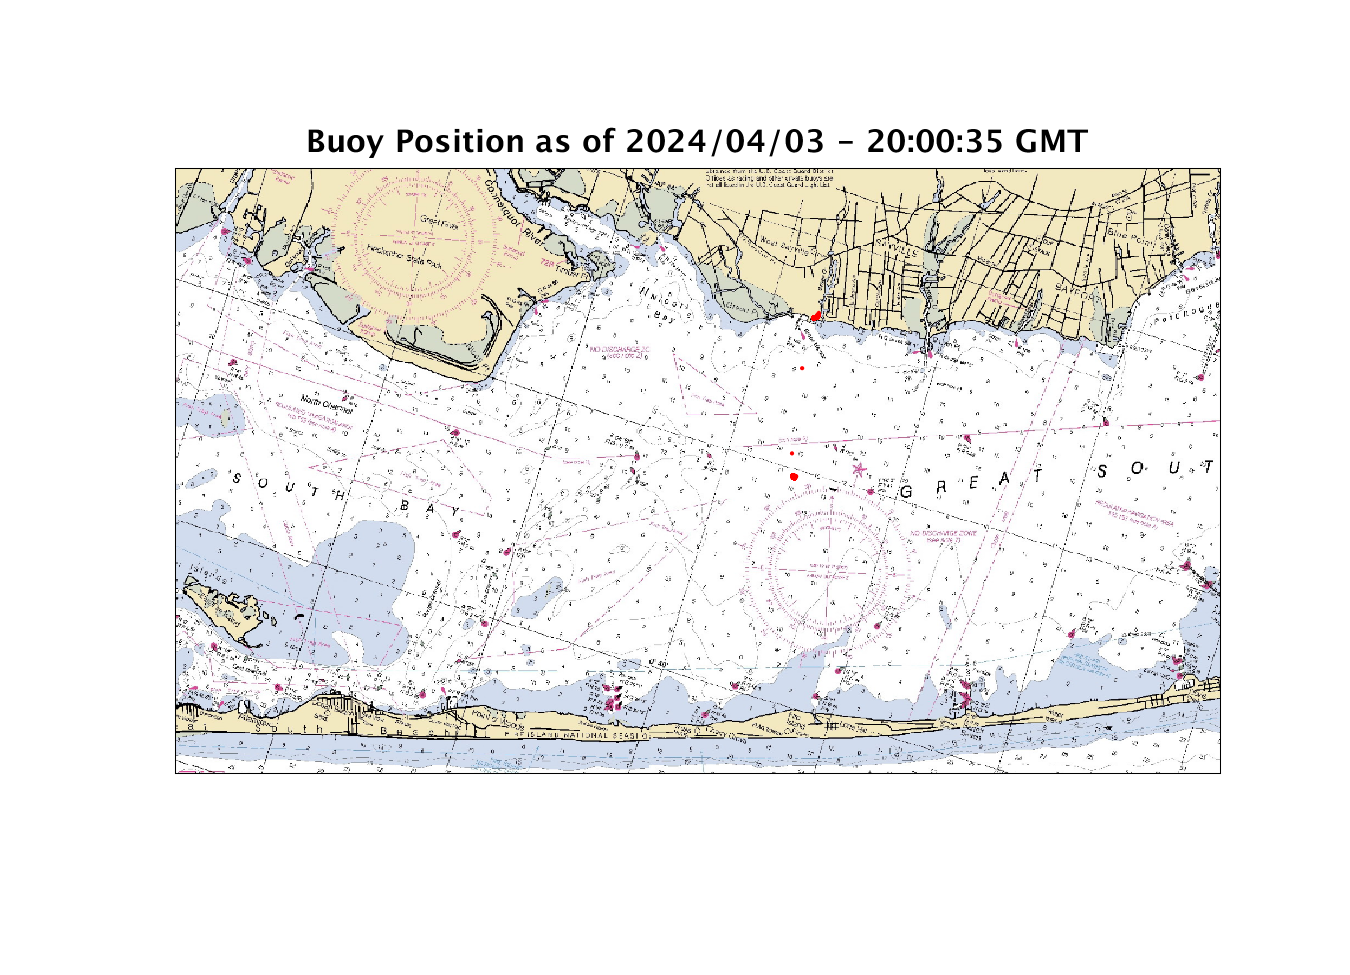
| Real-Time Data In addition to the delayed-mode SeaCat data, meteorological data are being collected from the south tower of the Smith Point bridge and these data are available in real time below. That data includes temperature and salinity from the Smith Point SeaCat, short and long wave radiation from Eppley pyronometers, and wind speed, wind direction, air temperature, humidity, barometric pressure and rainfall rate from a Vaisala WXT520. On October 6th, 2010 we deployed GSB #1 buoy south of Sayville at 40o 41.6'N, 73o 05.1'W. This buoy reports wind speed and direction, air temperature and humidity, photosynthetically active radiation (PAR), water temperature and salinity, chlorophyll-a fluorescence and turbidity. On December 29, 2010 ice forming in the Bay carried the buoy quite a ways as the ice sheets broke up and started to move around. The ice finally released the buoy south of Islip in mid-February at which time we towed the buoy to the West Sayville Marina on February 17th. After checking on the systems and repainting, the buoy was towed out and re-anchored near its original location, 40 41.552 N, 73 5.144 W, on March 23, 2011. The winter of 2011-2012 was particularly mild and we did not have any trouble with ice flows but significant ice build up in January 2013 captured the buoy again and dragged it first south and then some two miles west. It will be returned to its proper location as soon as possible. |
||||
|
| Smith Point Bridge |
GSB Buoy #1 south of Sayville | Bellport Marina |
|||||||||||||||
|
Buoy #1 data: Wind, Air Temp, Humidity, PAR, Water Temp, Salinity, Chlorophyll-a and Turbidity Hour-Averaged Data Files: 2011 2012 2013 2014 2015 2016 2017 2018 2019 2020 2021 2022 2023 2024 2025 Recent |
Plot of Bellport
data for the past 60 days 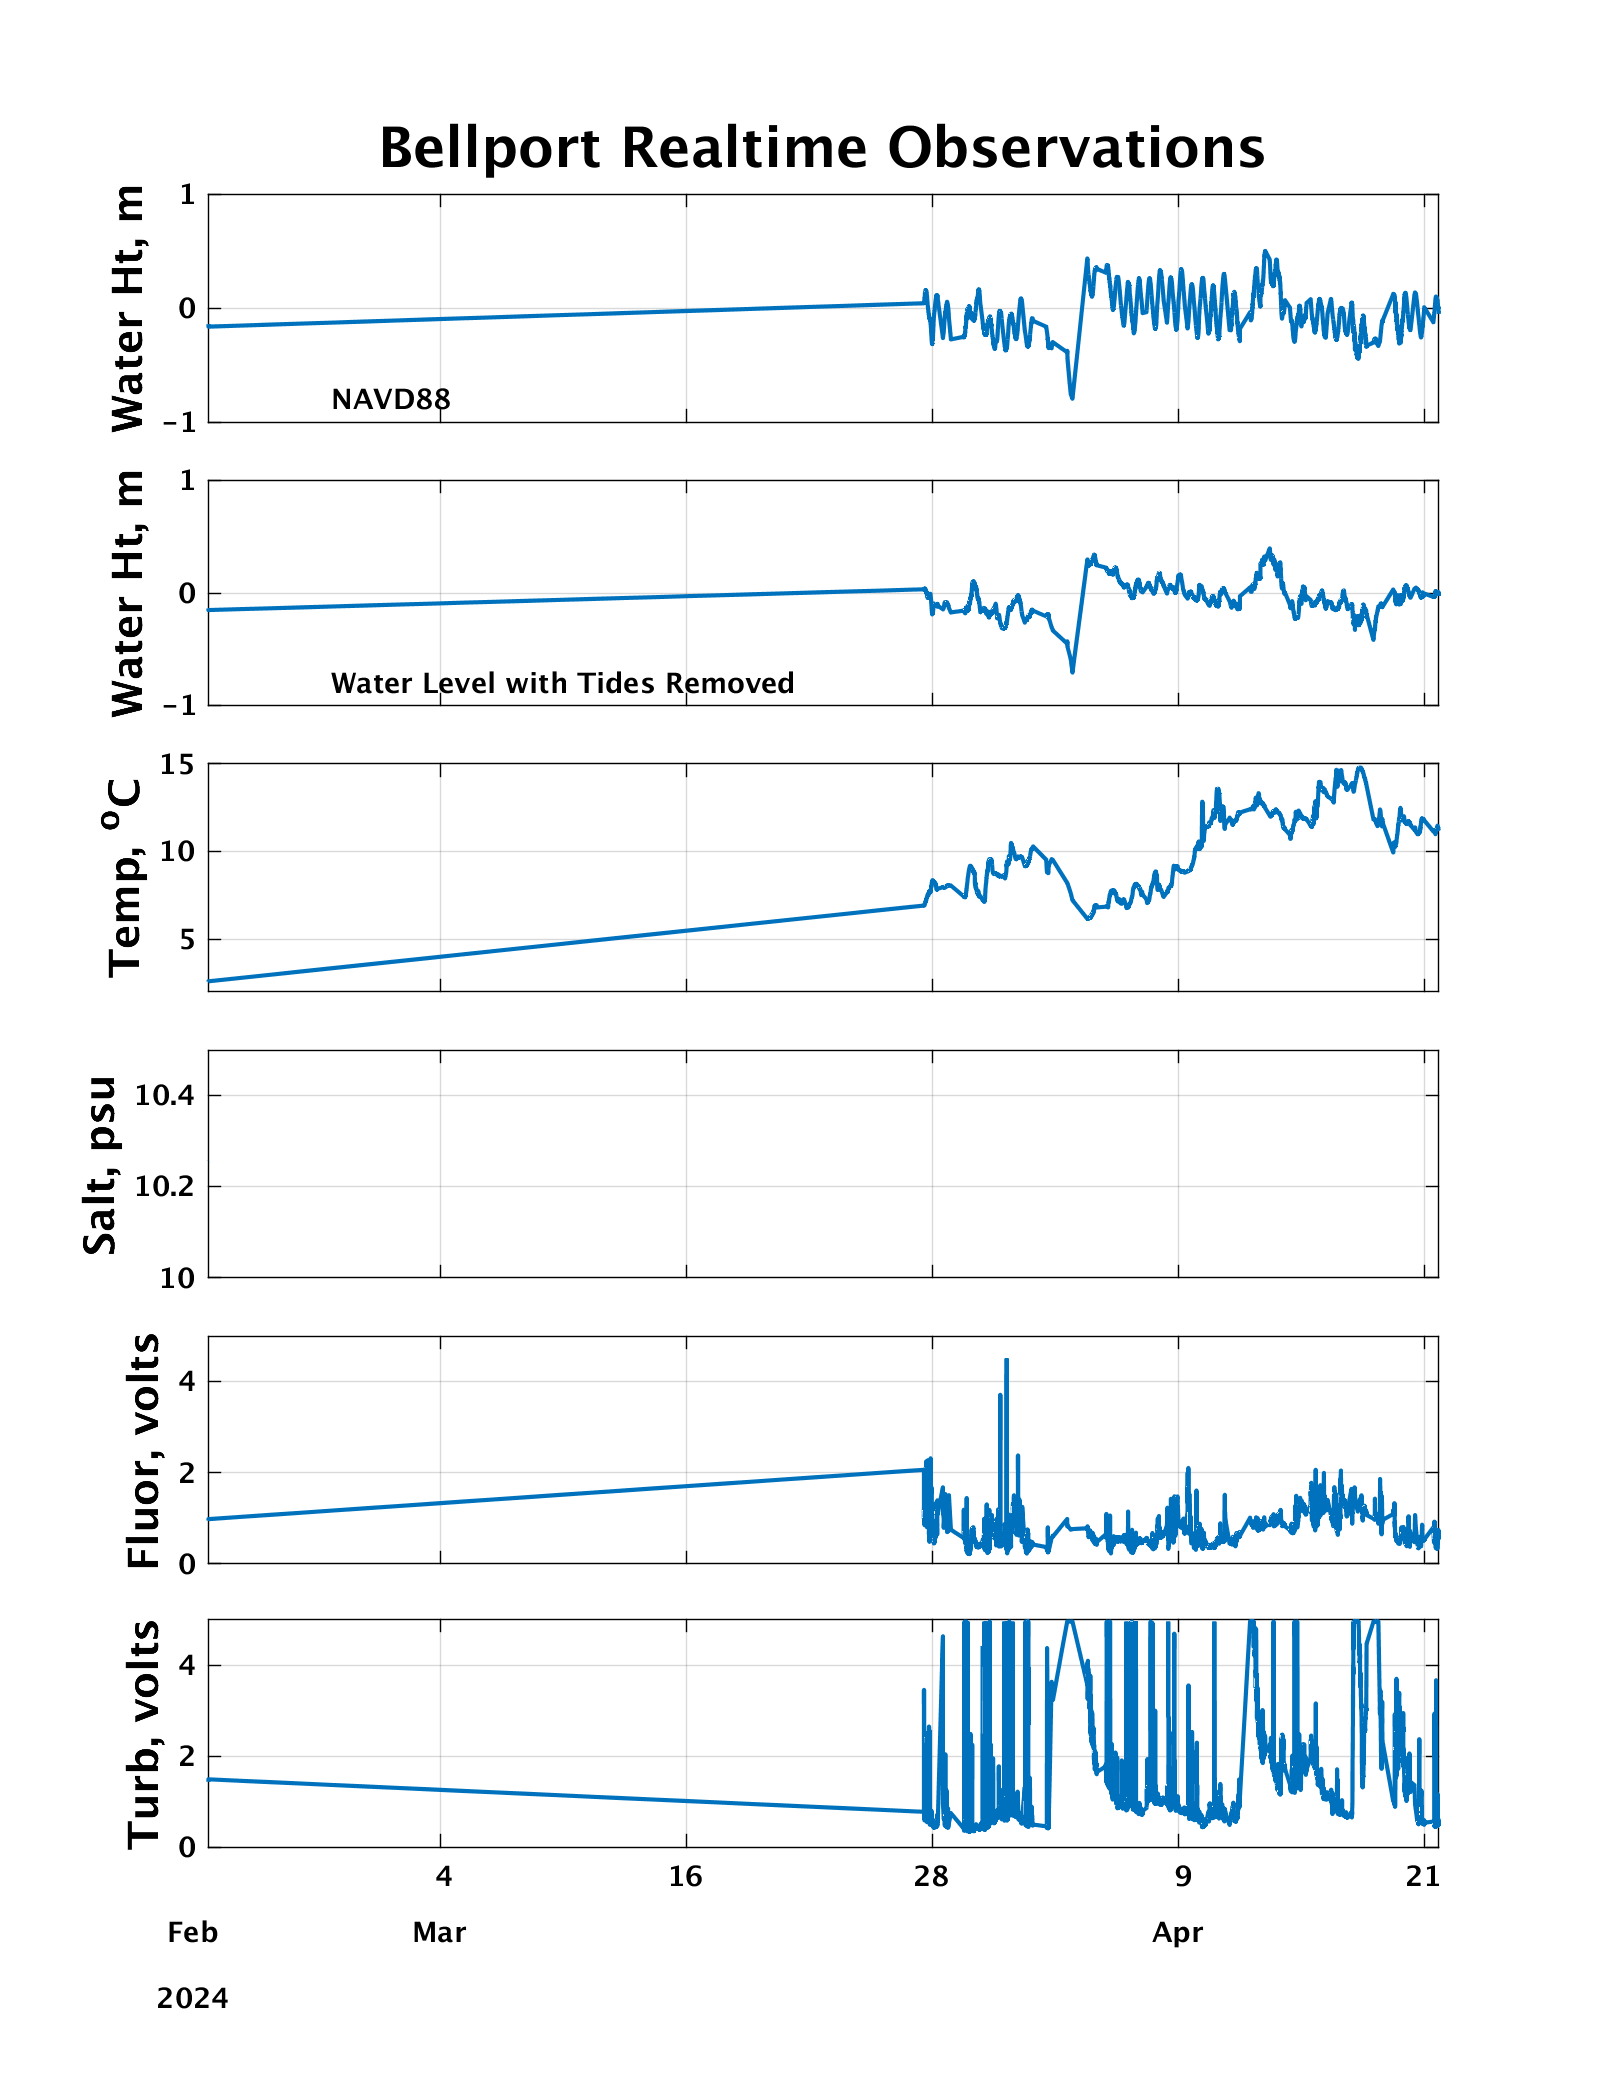 Recent averaged data file BPRT_2013 data BPRT_2014 data BPRT_2015 data BPRT_2016 data BPRT_2017_data BPRT_2018_data BPRT_2019_data BPRT_2020_data BPRT_2021_data BPRT_2022_data BPRT_2023_data BPRT_2024_data BPRT_2025_data BPRT_Recent The plot and data file include NAVD88 water
level, detided water level, temperature, salinity,
fluorescence and turbidity. The real time sensor is
located at the end of the marina dock.
|
|
||||||||||||||
Delayed-Mode SeaCat Data
from sites around Great South Bay
|
Bellport |
Blue Point
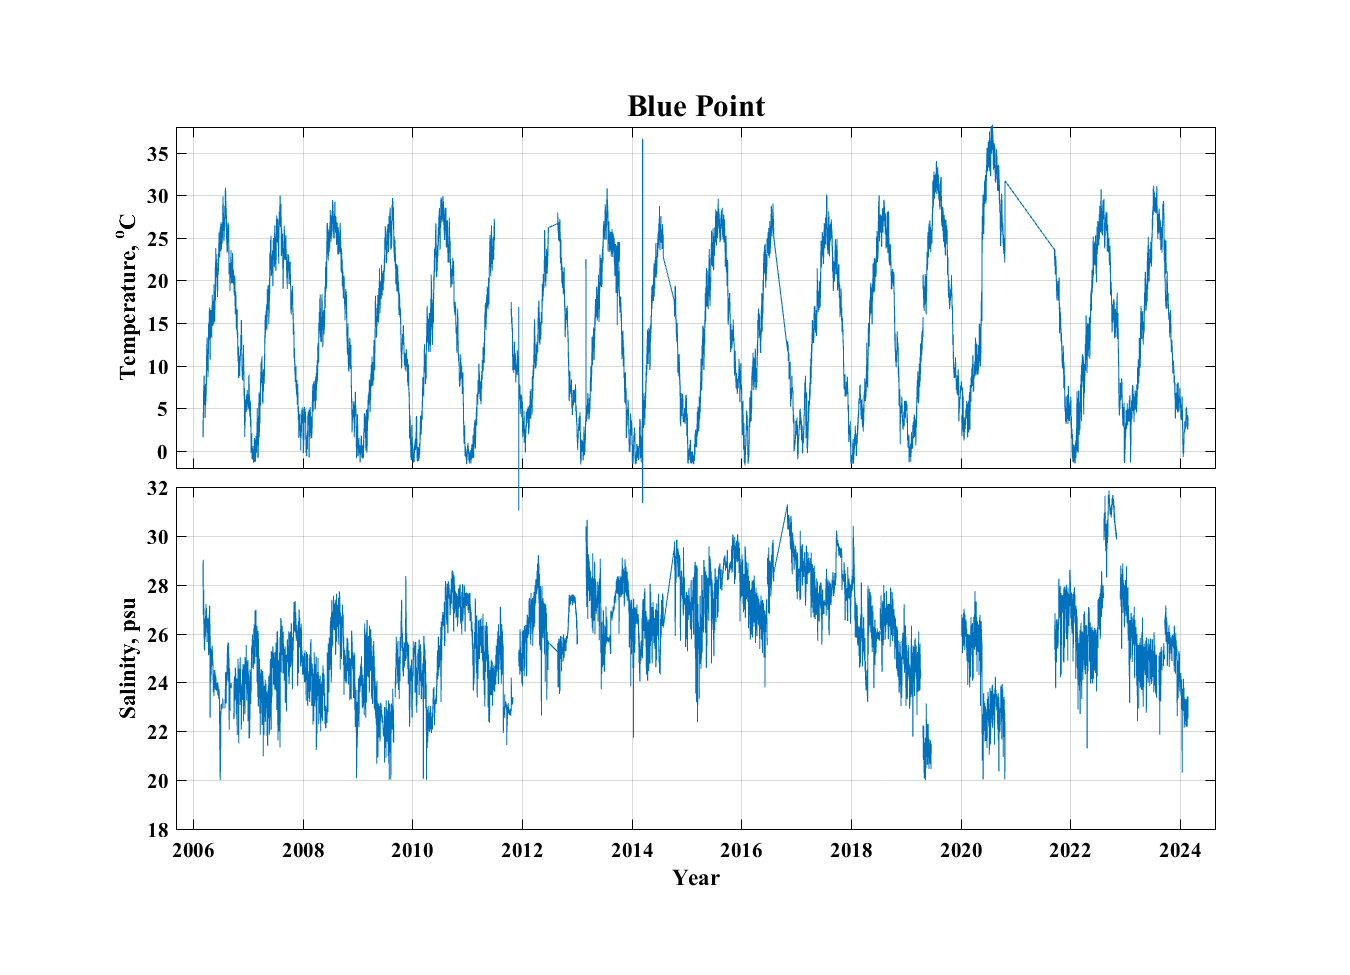 |
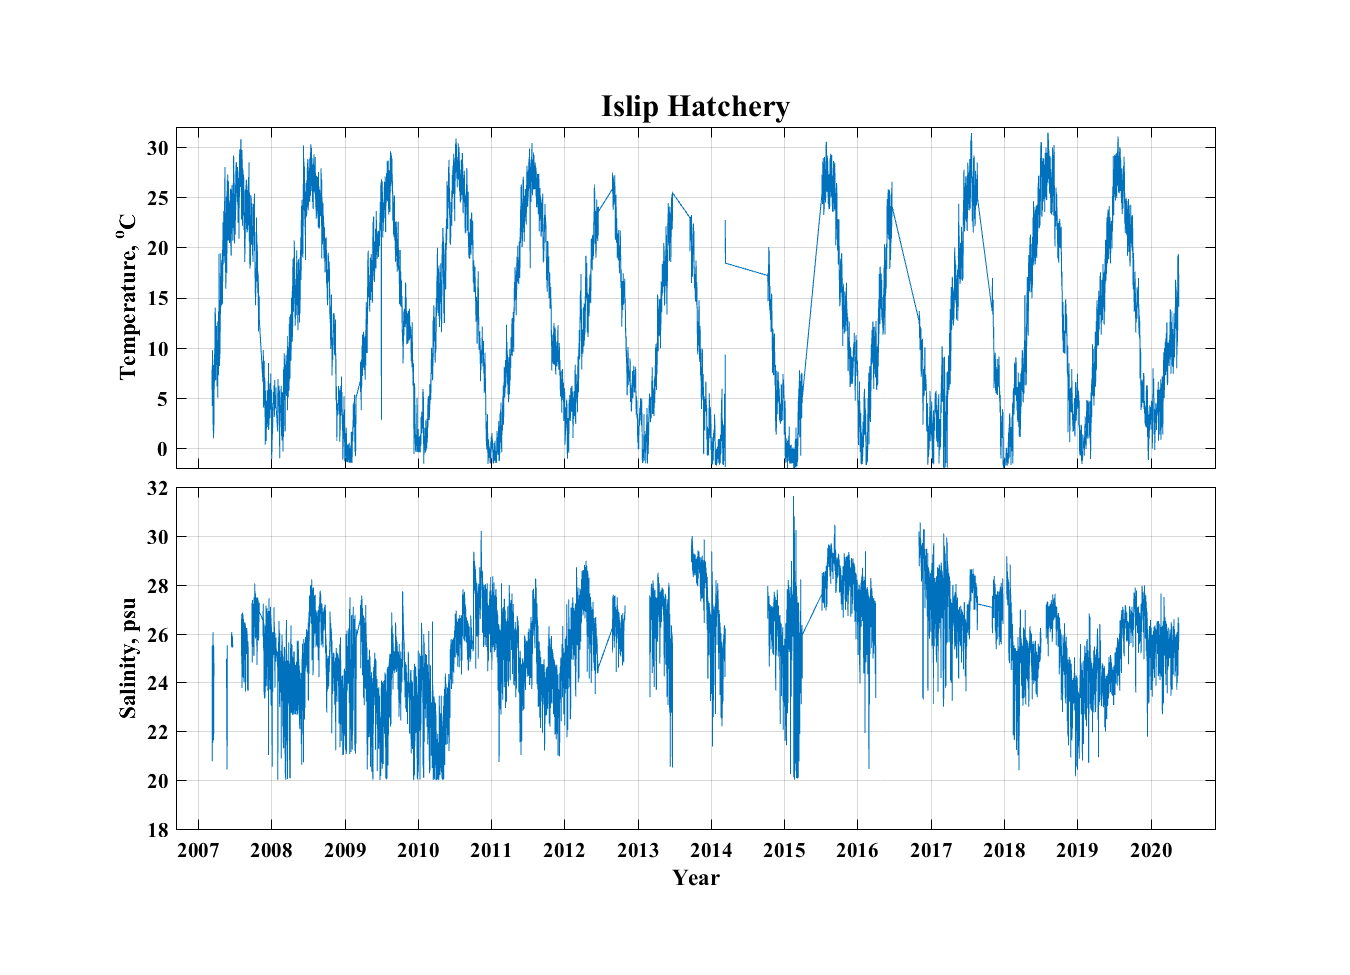
Islip Hatch/Fish Pier
 |
Tanner Park
 |
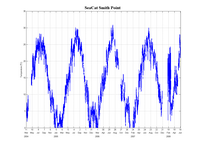
Smith Point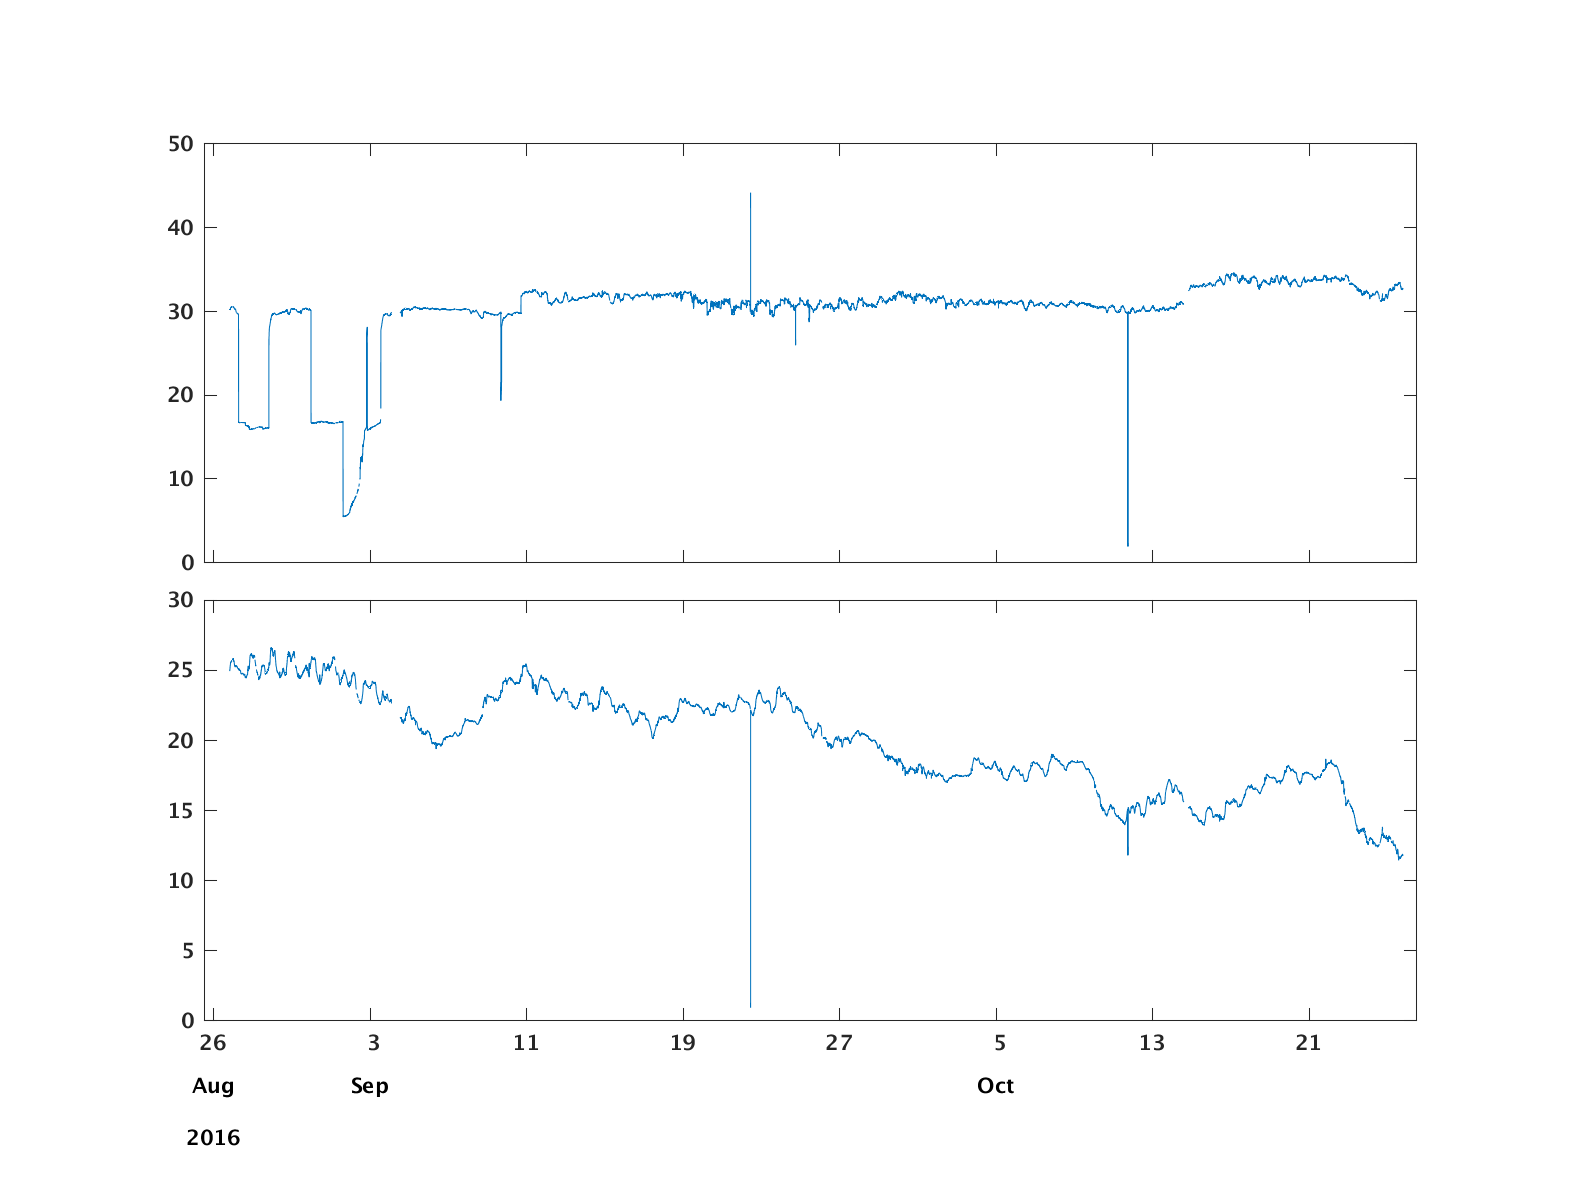 |
USCG Fire Island Inlet |
Barrett Beach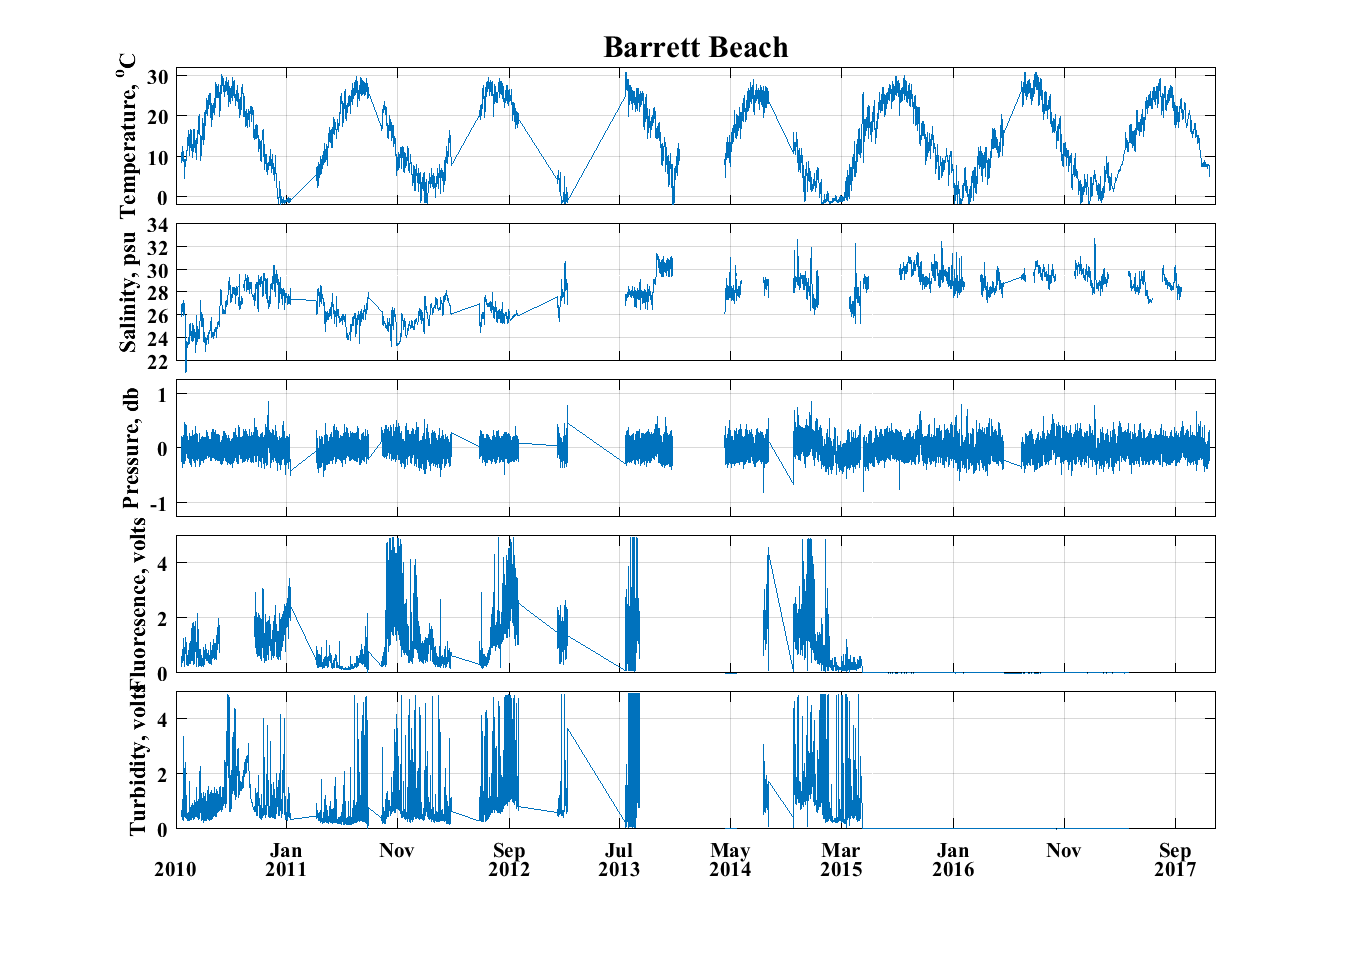 |
Carmans River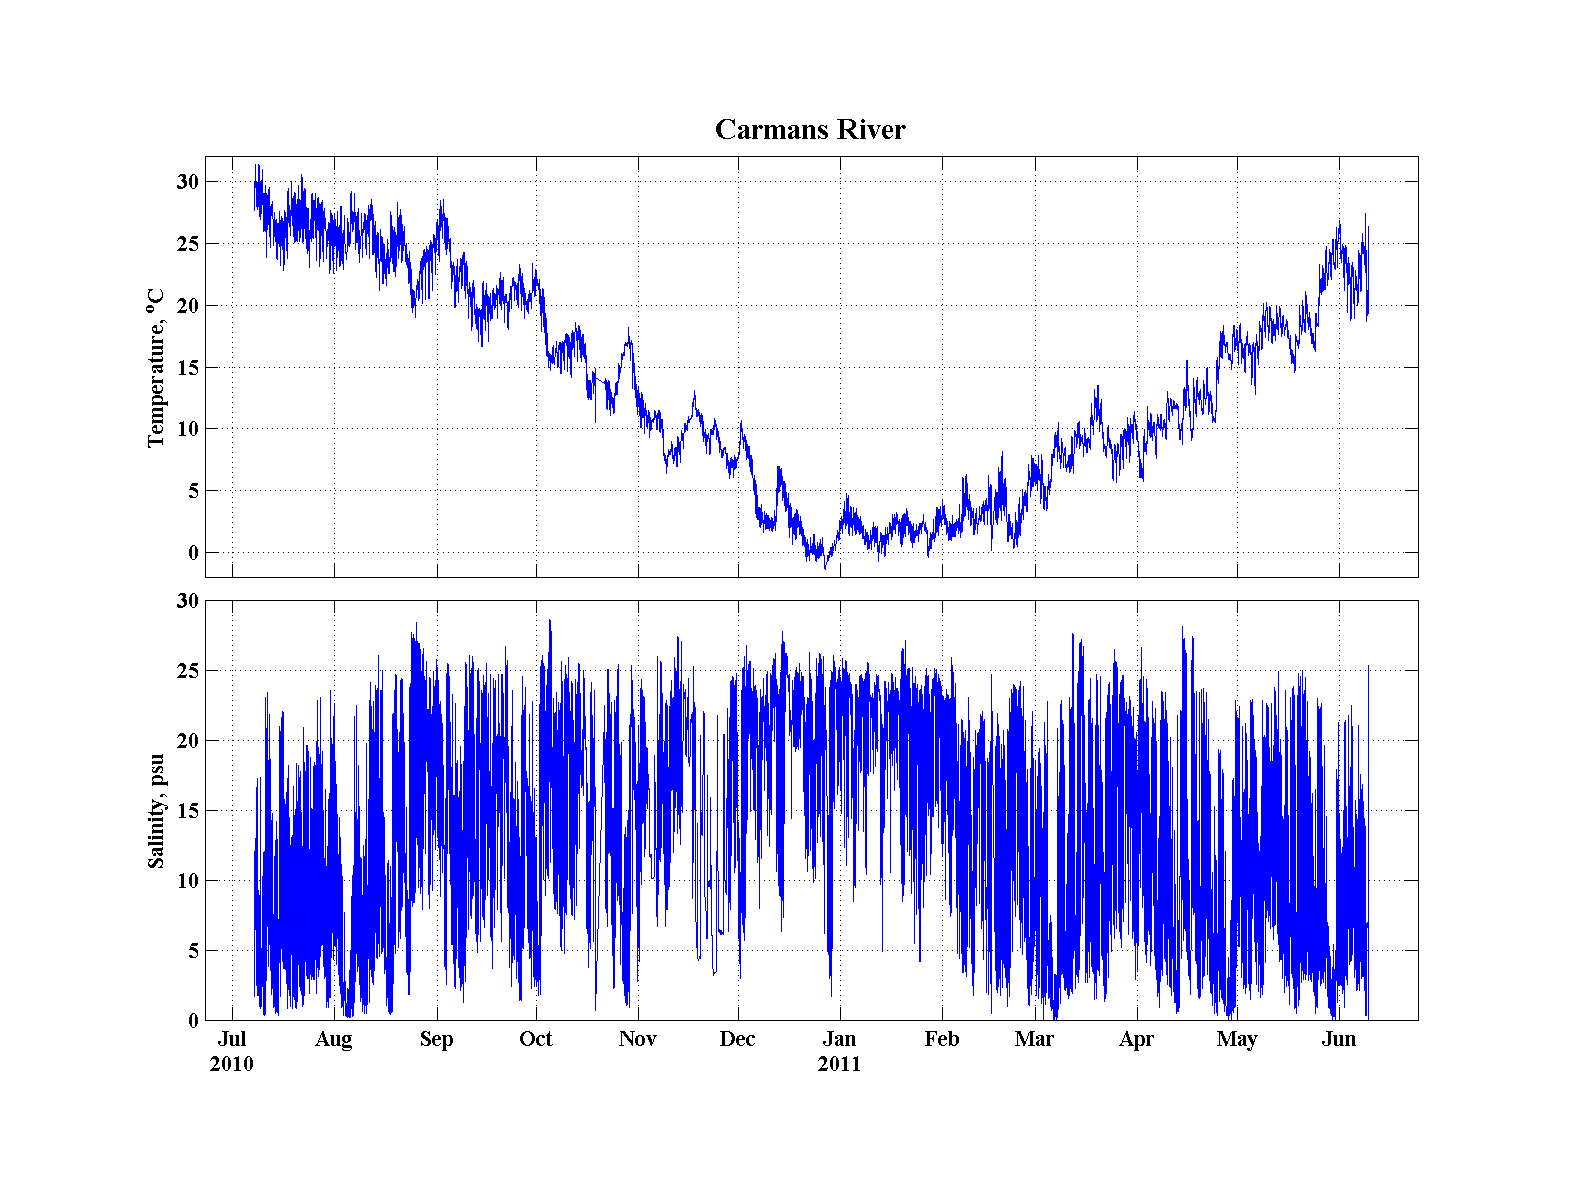 |
|
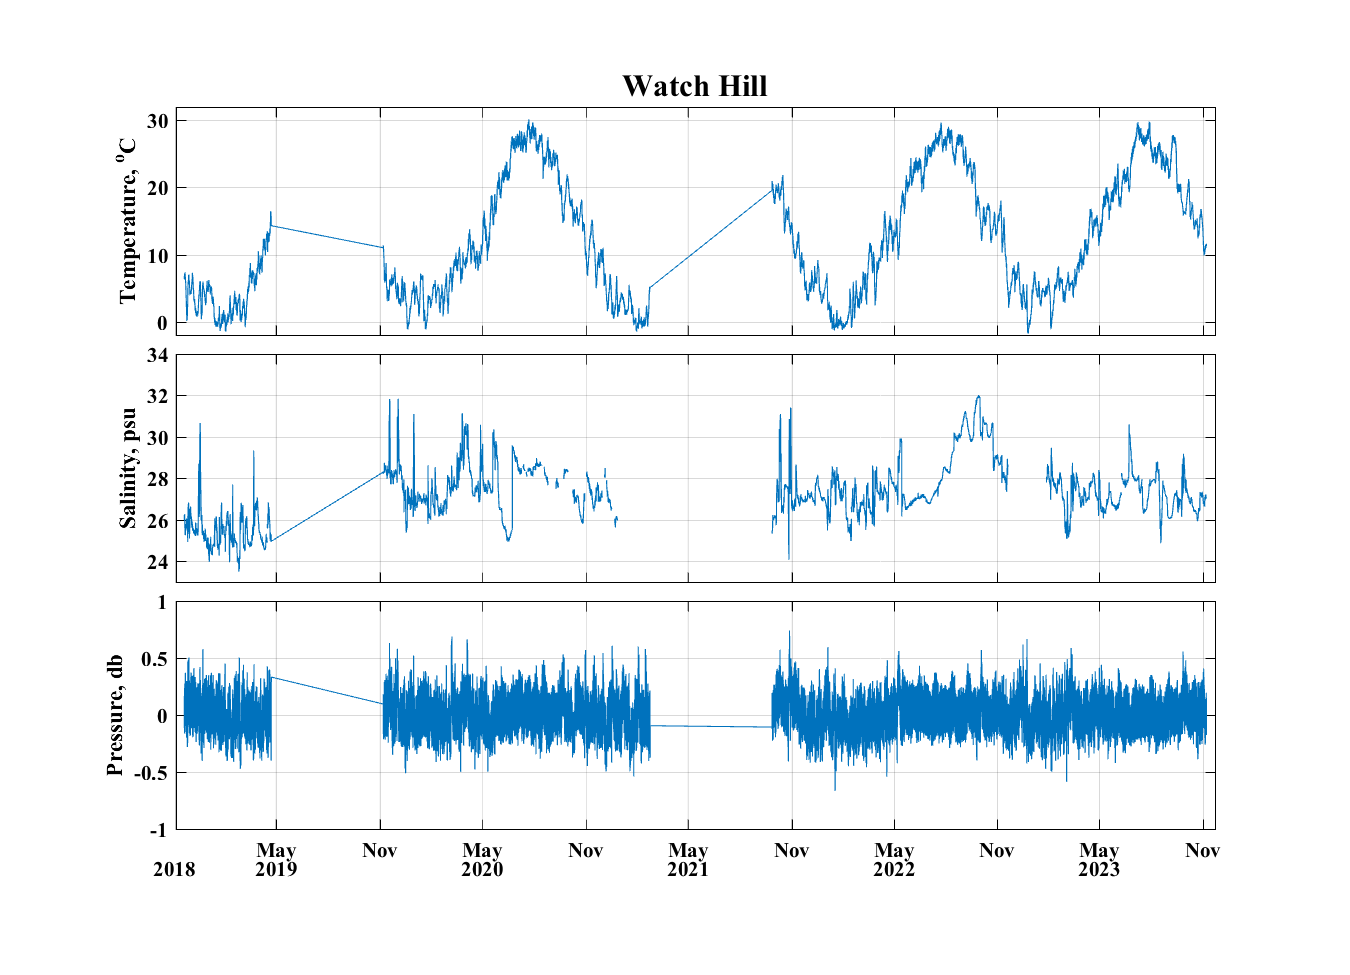
Watch Hill
 |
| Right-click to download any of the data files | ||
| Location |
Matlab Data Files |
ASCII Data files |
| Barret
Beach on Fire Island |
Barrett
Beach matfile |
Barrett
Beach dat file |
| Bellport
Marina |
Bellport matfile | Bellport
dat file |
| Blue Point
Hatchery Marina |
Blue Point matfile | Blue
Point dat file |
| Carmans River |
Carmans River matfile |
Carmans River dat file |
| Islip
Hatchery |
Islip Hatchery matfile | Islip
Hatchery dat file |
| Tanner
Park |
Tanner Park matfile | Tanner
Park dat file |
| USCG Fire
Island Base |
USCG
Fire Island Inlet matfile |
USCG
Fire Island dat file |
| Smith
Point Bridge |
Smith Point matfile | |
| Watch Hill |
Watch
Hill matfile |
Watch
Hill dat file |
Useful Websites
Current
Precipitation Map
A map of the United States
showing precipitation.
NDBO
Buoy 44025
Shows a 3-meter
discus buoy South of Long Island.
Islip
Airport Weather
Brookhaven
Airport Weather
Local
Towns Weather
Gives basic weather information for seven towns
around Long Island.
OceanWeather.COM
Click on the Current
Marine Data and the corresponding area to see
wave height and wind data over the oceans.


